Spatiotemporal evolution of Primary School Absenteeism during the Pandemic A(H1N1) pdm09 in 2009 - 2010. The case of Attica
Doukissas Leonidas|Kalogirou Stamatis|Karageorgi Athanasia
Health
2019 | Feb
The pandemic flu A(H1N1) pdm09 of 2009, which was initially detected in Mexico and rapidly spread throughout the globe, has been classified among pandemics as the quickest in modern human history. On the 10th of August 2010, the World Health Organization (WHO) announced that the virus H1N1 had completed its circle and the pandemic was finally over (WHO, 2009). In Greece, the first case of the flu A(H1Ν1) was reported on 18th May 2009. It involved a patient, aged 19, who had just returned from a trip to New York two days earlier (Panagiotopoulos et al. 2009).
Glezen (1996) compares the pandemics H1N1 of the years 1892, 1918, 1936,1957 per age and concludes from reviewing the special infection rate per age, that children of school age typically have the highest rates of infection during different pandemics (and interpandemic) periods. What is more, children play a significant role in the transmission of the virus in the general public due to their gathering at school and the fact that they fail to wash hands with soap and dry them with clean paper or air. In the current paper, for the first time in Greece, a mapping of school absences is formed in Primary Education for Attiki per Kapodistrian Municipality as we hold the notion that school absences are directly connected with the spread of the epidemic, the flu H1N1. The analysis was based on weekly data from 13/10 to 17/12 of the year 2009. An analysis of spatial autocorrelation was conducted by calculating the total and spatial rate Moran’s I for the ten week study. The spatial rates were classified and presented in the form of spatial standard maps, on which the areas where an outbreak of the phenomenon is noticed, are featured. These maps show the existence of spatial autocorrelation for the three most crucial weeks of analysis of the phenomenon as we will see further down. Furthermore, the chart of the average rates of pupil absences directly visualizes the development of the phenomenon as it also does with the counterpart check of statistical significant difference among the average rates. The location of municipalities with a high rate of absences can abet the head of health prevention policy in making more notified decisions (Ministry of Health, HCDCP, primary education). Even though the analysis concerns data of 2009, which was compiled for this purpose, the cases of the virus A, continue every year marking this analysis as up-to-date.As so, the total handling of incidents and deaths due to the virus H1N1 per region (Δούκισσας κ.α., 2016α) in combination with the school absences may be used as a future tool of clearer management and coordination of a potential new pandemic.
Data
In the current assignment, data from HCDCP has been used (weekly reports of epidemiological surveillance of the flu during the period 2009 – 2010) __which can be found at the electronic address www.Keelpno.gr. Furthermore, the population data resulted from the census in 2011 which was conducted by the Greek Statistic authority (www. statistics.gr). The data concerning the absences of students in Primary and Secondary Education was gathered from the National School of Public Health. This data, was gathered in close collaboration with the Institute of Technology, Computer, and Education) and is supervised by the Ministry of Education, Research and Religion. More specifically, the data concern the total of absences which were made by enrolled students, the time period between 25/9/2009 and 17/11/2009 on a daily basis. The recording of absences occurred in every school in Greece and included all levels of education and all types of schools. The data is organized in tables. Every entry on the table concerns the total absences for (the absences due to the virus are not documented individually in the system) and it includes consisted a0 the code of each school, b) the date of documentation of absences, c) the number of students absent per class , and e)the total of active students in each class. Initially a check was made as to the thoroughness and validity of the recordings of each entry. There was a very small number of entries which did not correspond to a school via its code and for this reason were excluded. We created cross questions and after its execution it was noticed that in some entries the municipality in which the school belongs to, was not that which resulted from its code. Therefore, the necessary corrections were made and then moved on to the editing of the data. By creating sequential queries we were able to create the final inquiry, By leaving out Monday and Friday due to increase deviation (in order to avoid false observation) the final variable was calculated which is the average rate of absences during the days Tuesday -Wednesday and Thursday, leaving out the days that schools are closed (public holiday like 28/10 or 17/11). The geographical detail of the variable is local authority Kapodistria. The analysis in the current article concerns Attica only.
Theoretical background
The major difference from the pandemic between the years 1999 to 2009 and the pandemic of 2009 was the actual age group infected in morbidity and deaths (ECDC, 2010). The pandemic of the virus A(H1N1) affected the younger age group and mostly school students (Health Protection in Midlands, 2009) not to mention, households (Nishiura et al, 2009). In Greece, it is calculated that the clinical rate of infection was higher for children between the ages 5 -19 years old but was much smaller for those who were over 64 years of age. It is generally estimated that approximately 19.7% percent of the Greek population was infected (HCDC, 2010). By calculating the morbidity rate (Tsimpos, 2004) concerning the virus A(H1N1) per 100.000 residents we noticed a rapid increase of incidents up to the age of 15. To be more specific, up to the age of 5, 200 cases per 100.000 residents were documented. The numbers showed a rise (300 cases) with a minor change among the age group 5 – 10. Furthermore, the increase among the age group 10-15 is quite impressive and holds the highest rate (500 cases/100.00). This data proves that children, mostly in primary schools, constitute the initial cluster of the virus A(H1N1) (Doukissas et al., 2016). The pandemic reached its peak between the 48th and 49th week of 2009 (Maltezou et al., 2011).
Methodology
The thematic mapping deals with the creation and studying of thematic maps. In the thematic map, what actually interests us is the spatial distribution of the data whereas the positions and distances of the spatial units are relative and symbolic. The most common thematic map is the choropleth map. One way of exploring the spatial dependence is by using techniques which examine the rates of different spatial units. Goodchild (1987) mentions that in general, spatial autocorrelation is interested in finding out to what extent a variable recorded in one spot is similar to the recorded variables of the same variable which is geographically close to it. In other words, spatial autocorrelation is an evaluation of the spatial structure of a variable concerning the spatial position of its rate. The establishment of spatial standards holds the greatest interest from the perspective of coming to a conclusion concerning the spatial distribution of the variable.
Results of spatial analysis
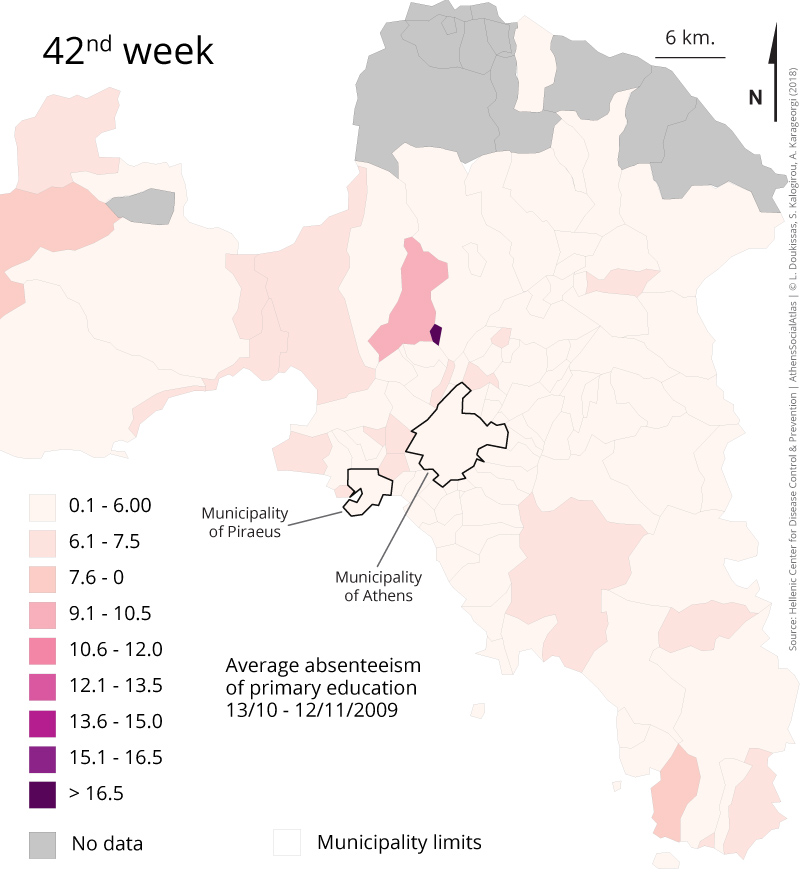
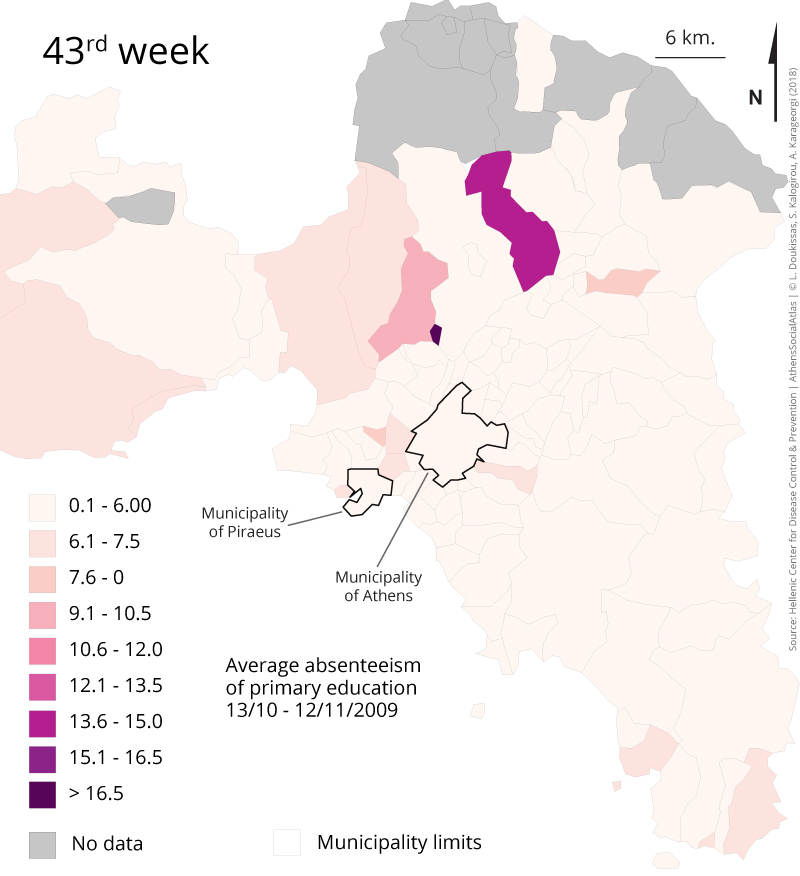
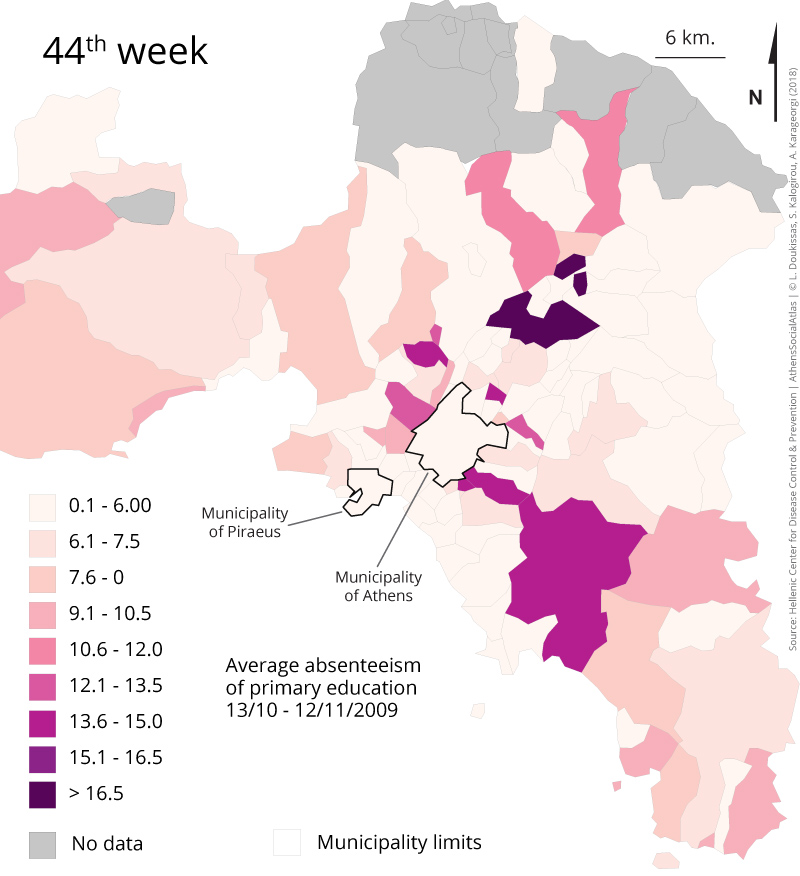
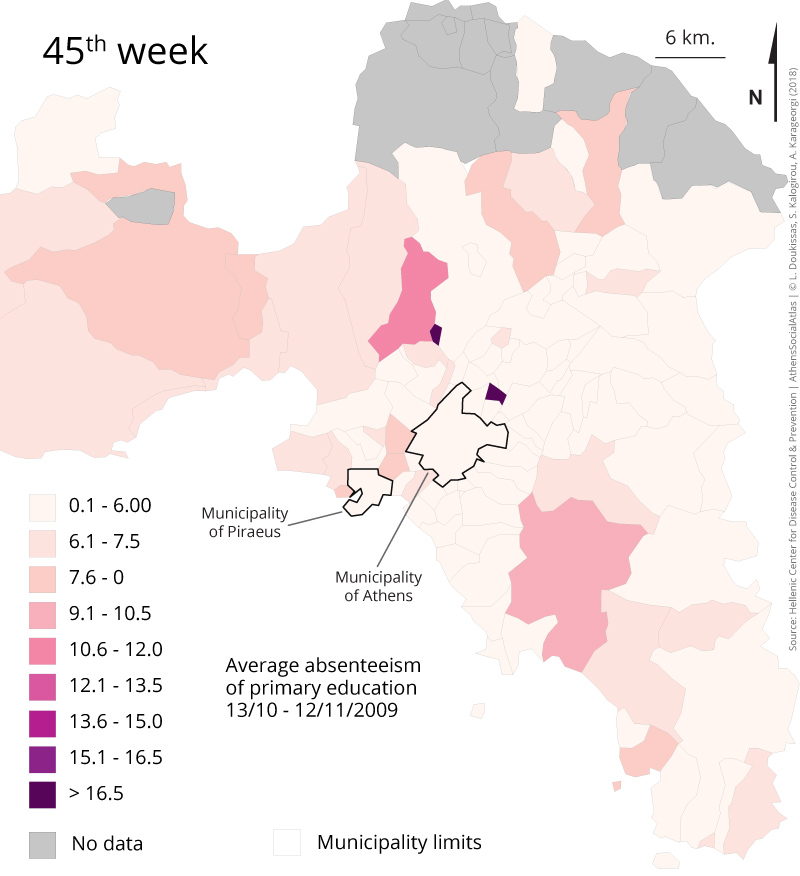
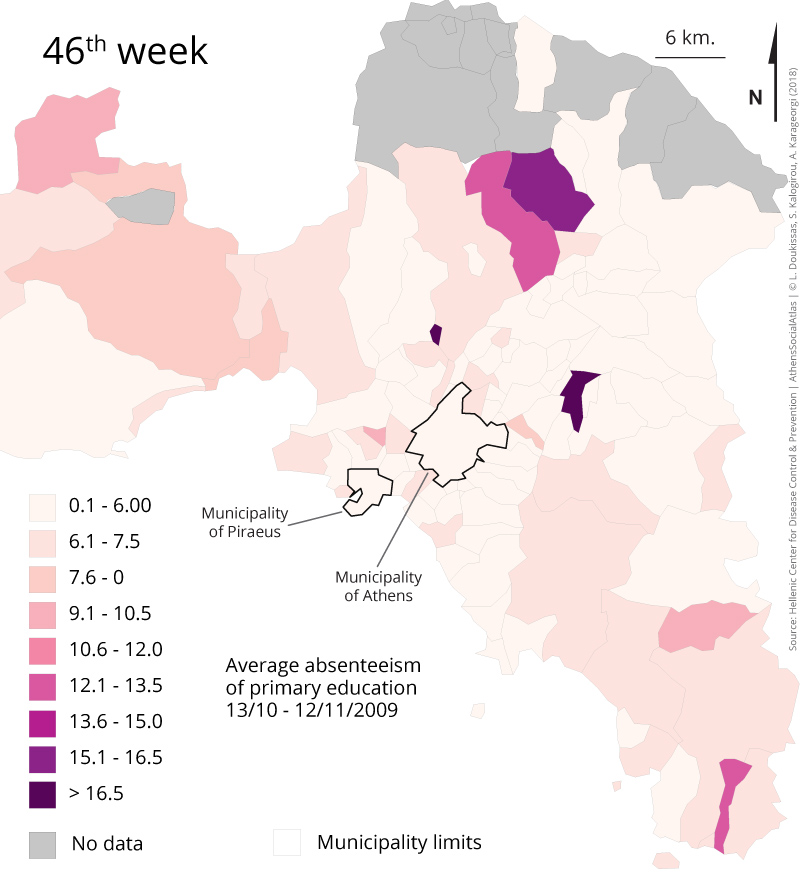
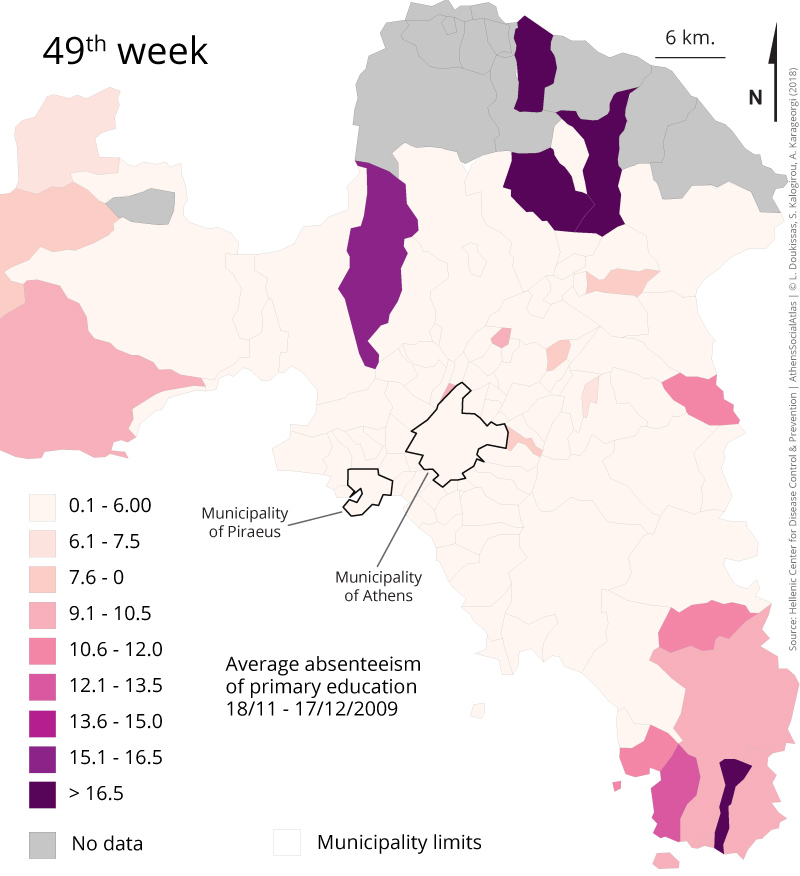
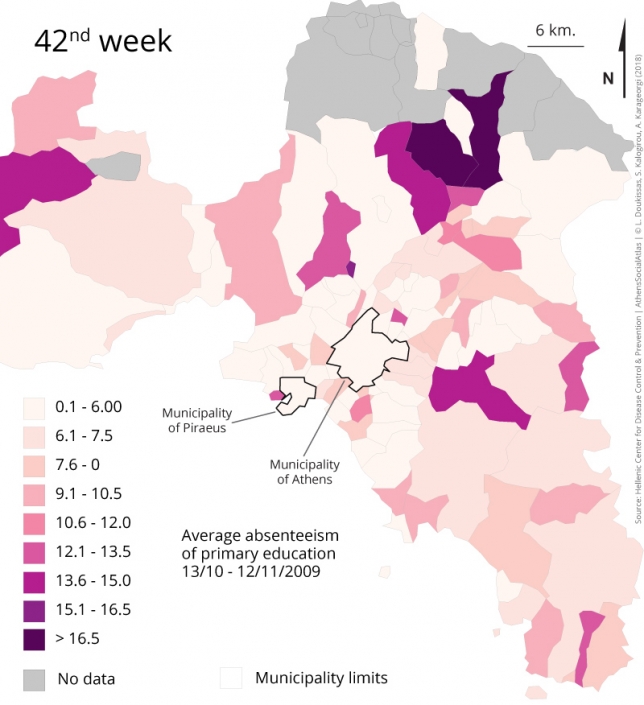
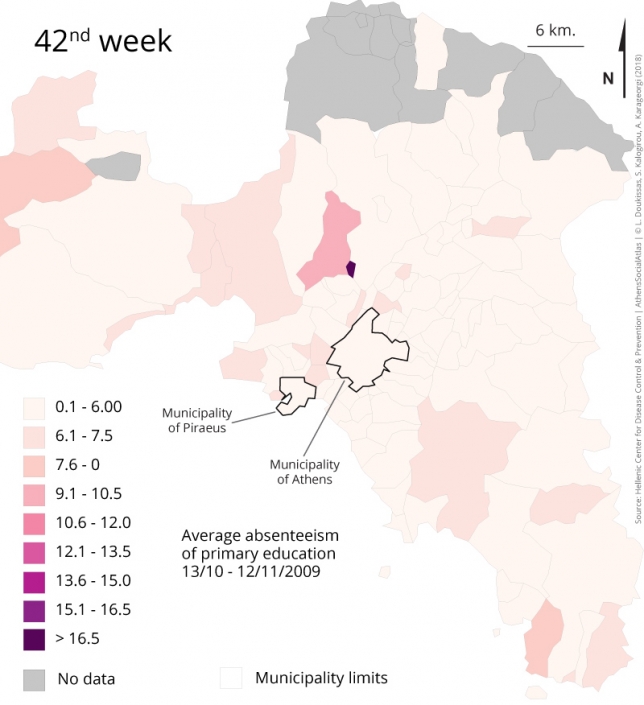
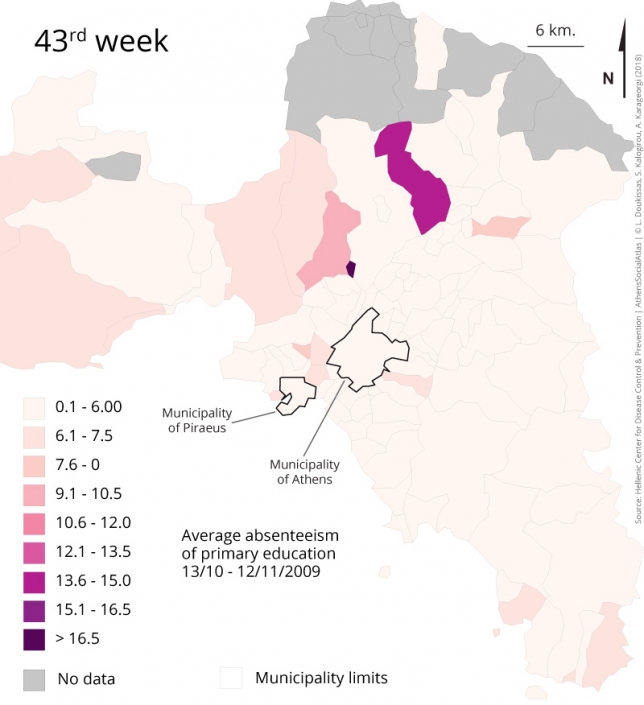
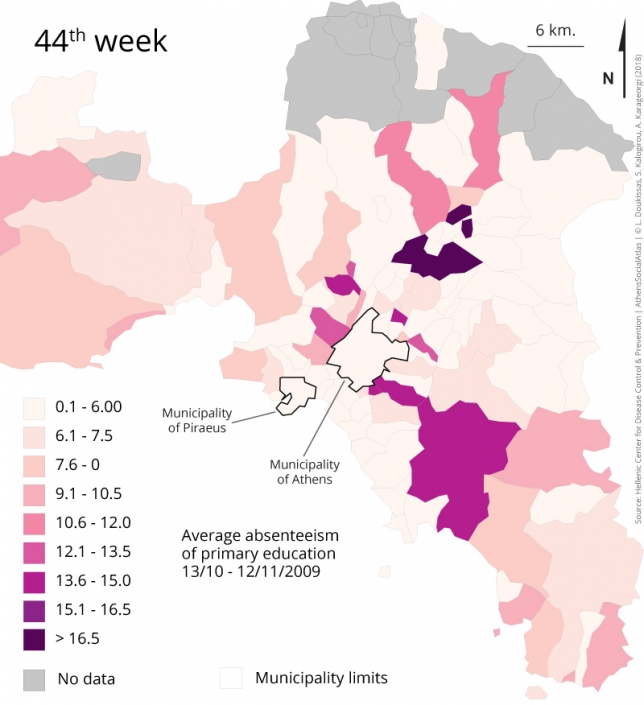
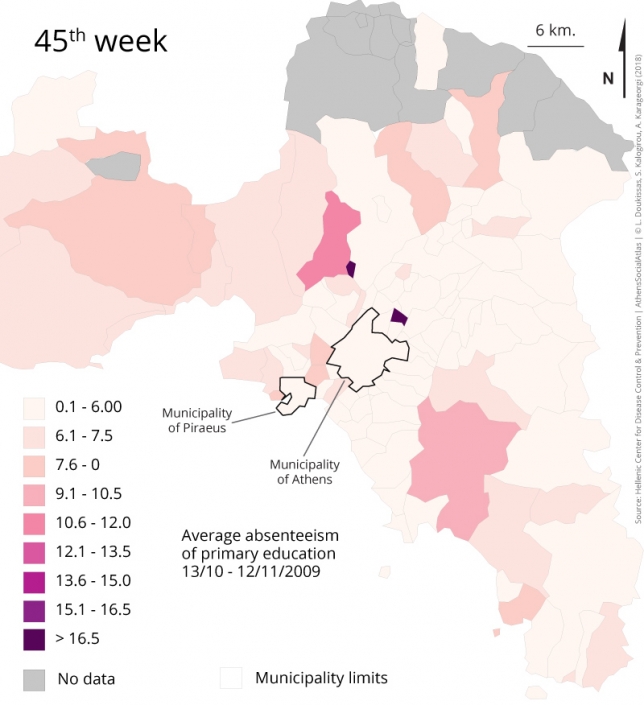
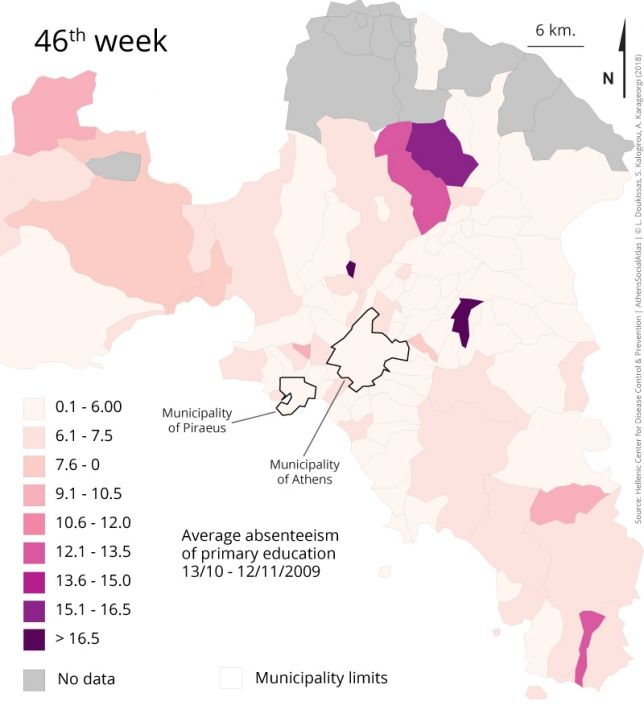
In figure 1 (Maps 1-6) as well as in figure 2 (Maps 7-12)the mapping is shown per week (from the 42nd to the 51st week of the year 2009)of the absence percentage at primary education in Attiki.. The numbering begins from top left to bottom right. The phenomenon begins to heighten in the Western part of Attiki, especially in the municipality of Ano Liosia and the community of Krioneri. During the 44th week, we notice a peak in absences mostly in the municipalities of Kruoneri, Kamatero, Peristeri, Filothei, Kropiou and Markopoulou and municipality of Kapandriti. Of course, it is important to mention that the 44th week was the week of a national holiday celebrated on the 28th October, therefore a high number of absences may have been due to the National holiday. The last map from Figure 1 which documents data of the 46th week shows rather high rates in the Western part of Attiki Zefiriou, Mandras, Erithron, Geraka and the communities of Krioneri and Afidnon. Lastly, we can notice a high percentage of absences in the Southern part of Attiki as well, in the area of Ag. Constandinou.
Figure 1: Mapping of the absentee rates in primary schools during 13/10 to 12/11/2009 in Attiki (Maps 1- 6)
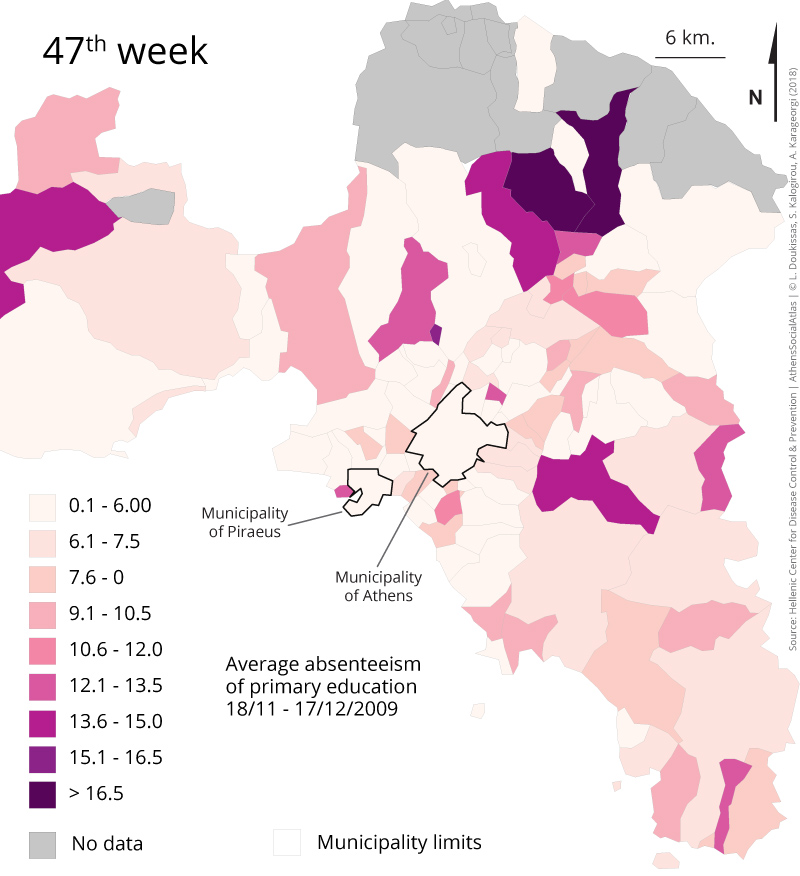
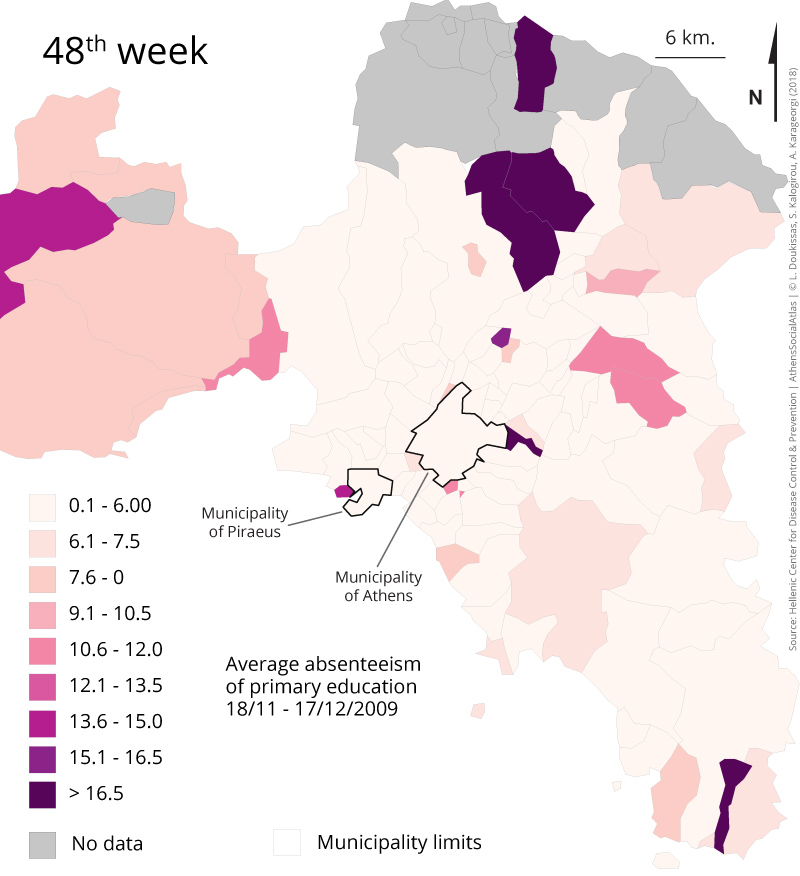
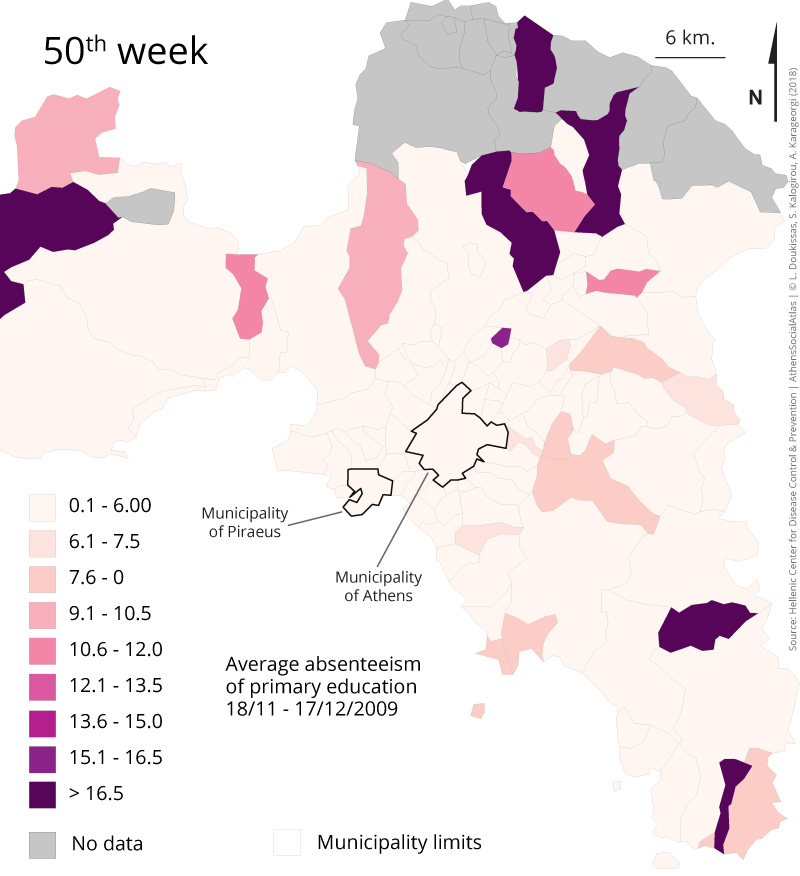
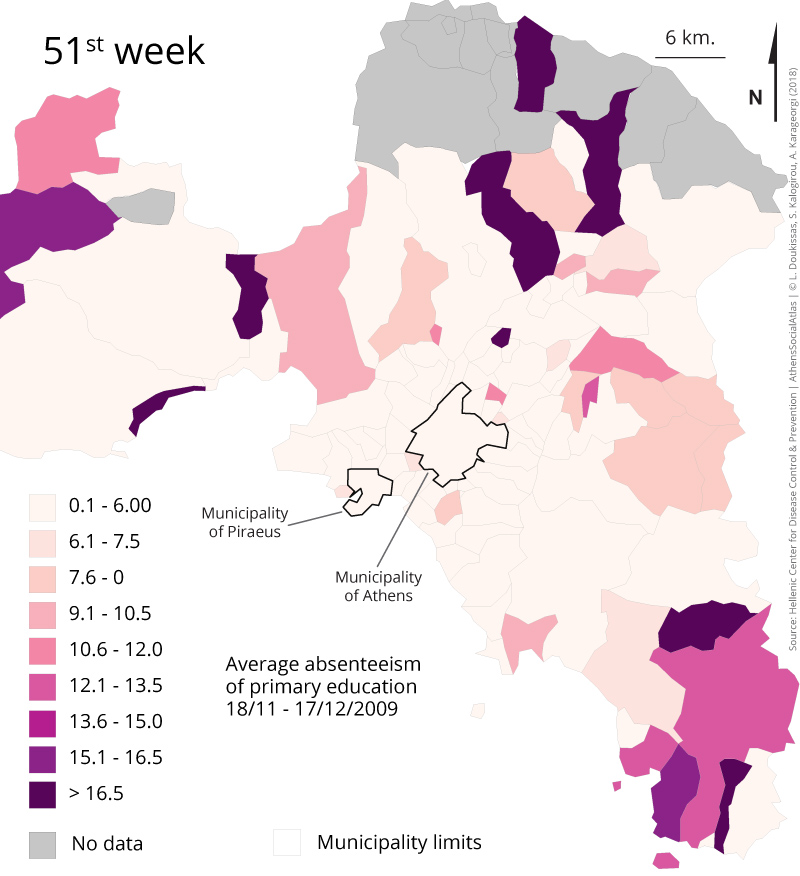
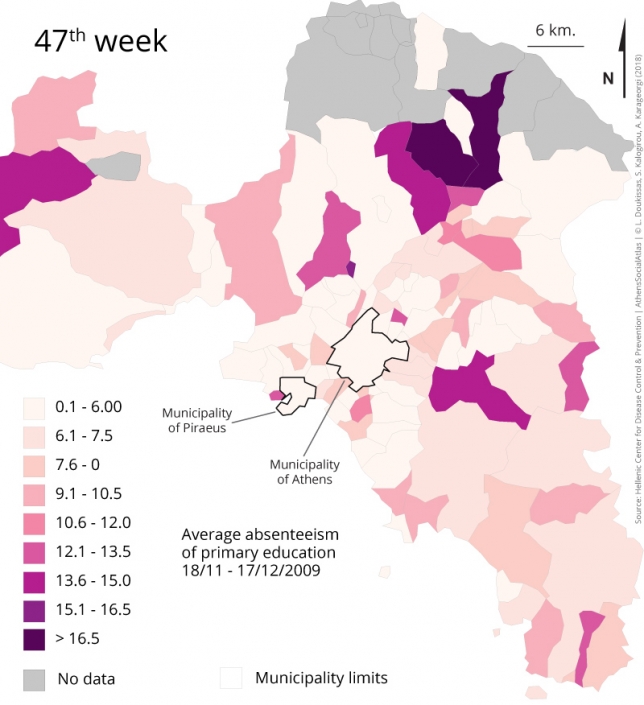
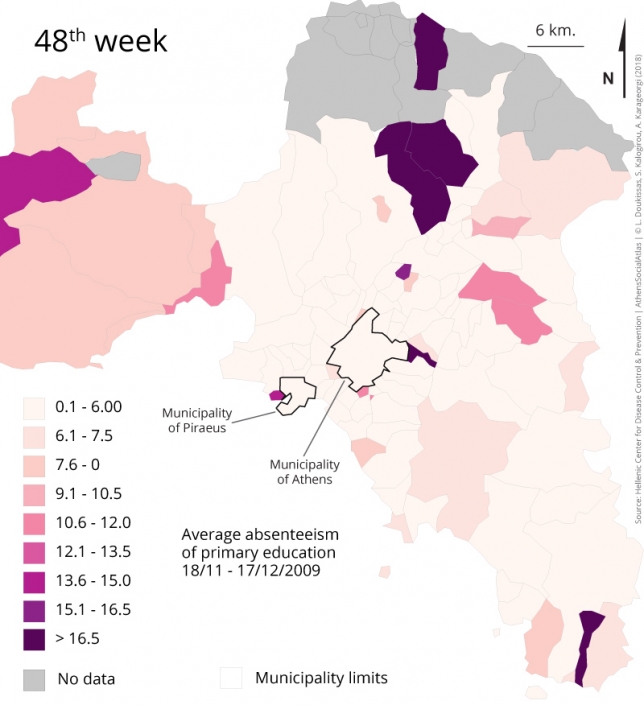
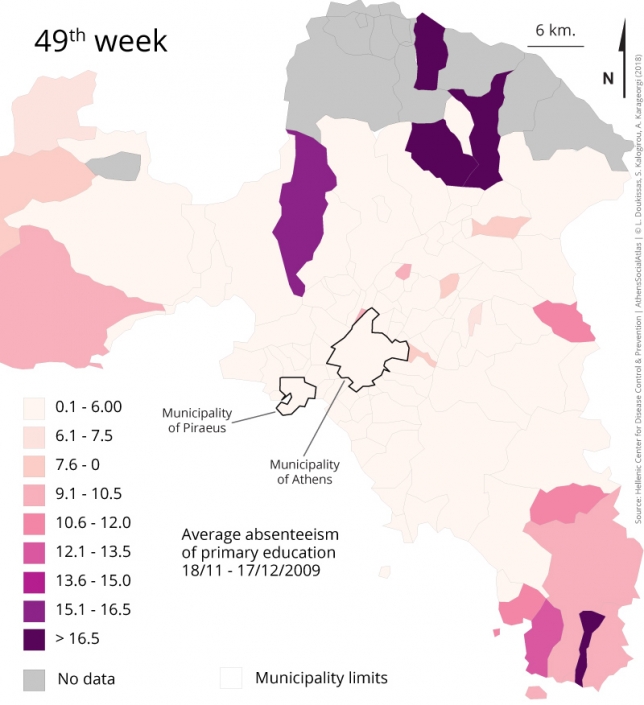
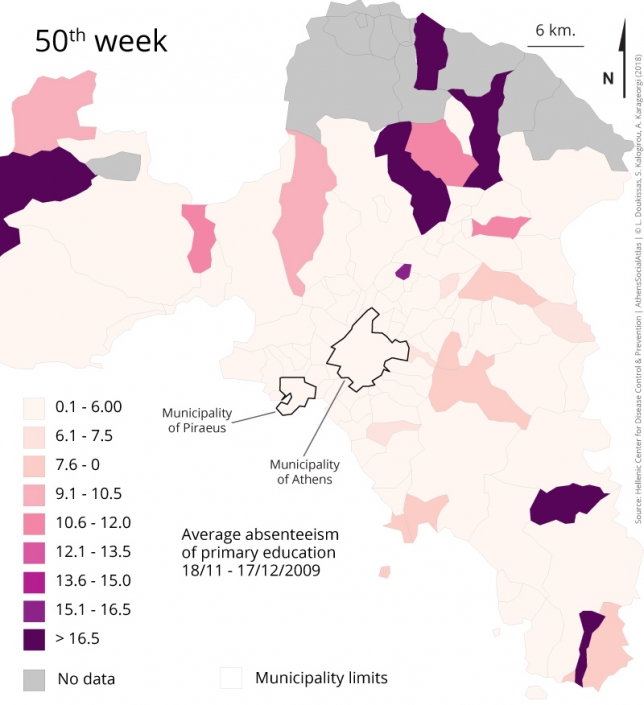
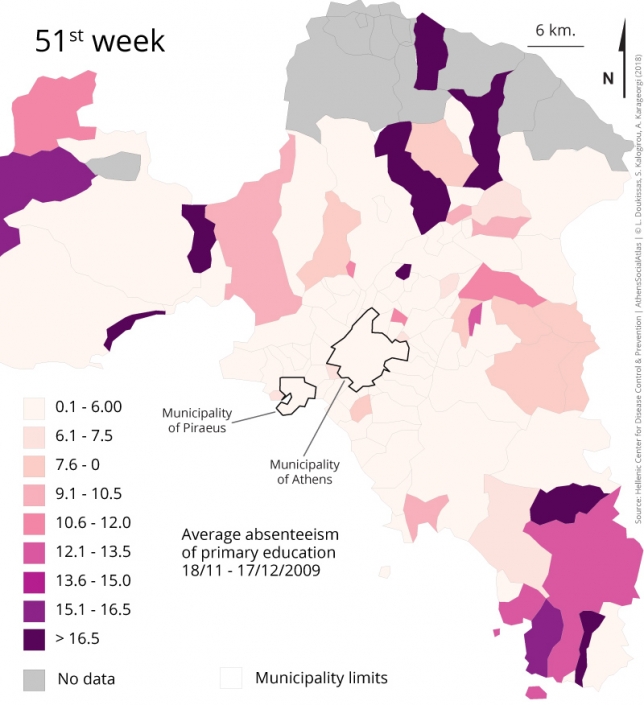
Moving on to Figure 2, during the 47th week we can notice that the phenomenon is intense and expands over to the Northern and Southern suburbs. Starting from the North-East part of Attica the local authorities that appeared to have high rates (above 16.5%) are the following. The communities of Krioneri, Afidnon and Kapandriti and the municipalities of Ano Liosia, Aspropirgou, Vilion and Dionisou. The municipalities with the next smallest percentage (between 12.5% and 15%) are the municipalities of Paiania and Artemidos. Finally, the municipalities of Vouliagmeni and Vari marked a rate of 9% to 10% during the 47th week of 2009. During the next week (48th) we notice that the communities of Krioneri and Afidnon mark the highest rates along with the municipality of Villia. The municipalities that follow are those of Likovrisi, Papagou, Eleusina as well as in the south part of Attica the community of Agios Konstantinos in the southern part of Attica. Rates of 9% to 10.5% can also be seen in the municipalities of Megara and Mandra. During the 49th week, extremely high rates (more than 16%) are noticed in the western part of Attika as well as the southern part of it. More specifically the communities of Markopoulou, Kapandriti, Afidnon as well as the municipality of Filis which continues to hold high rates. Moreover the phenomenon seems to be expanding and new clusters seem to be forming in the Southern part of Attiki, particularly in the municipalities of Keratea, Laureotiki, Anavyssos as well as the community of Agiou Konstandinou and Palaia Fokaia. During the 50th week, the phenomenon of absences seems to be milder. One must state that during the 49th and 50th week the number of closed schools reached its peak either because of the flu or of precautionary reasons. It is estimated that that number reached a number of 1.600 schools in primary education (Doukissas et al.,2018). As a result, the image we can form from the 50th week could be realistic since many schools remained closed and did not report these absences in the registering system. These schools are found at local authorities with map symbols with no rates. Lastly, in the 51st week, we notice a resurgence of the phenomenon in the Southern parts of Attica (the same municipalities and communities but with a more severe number of absences than that of the 49th week ) and the municipalities of Magoula and Vilia and communities of Markopoulo and Kapandriti.
Figure 2: Mapping of the absentee rates in primary schools during 18/11 to 17/12/2009 in Attiki (Map 1- 6)
Moreover, we observe that many areas, mainly the region of Athens and Southern suburbs of Athens showed a relatively low rate of absences during the period we are examining. We conclude that this may be due to the high socio-economic status of the population residing in these areas resulting from the high stated family income and high level of education (Kalogirou 2010) and it may be possible that greater care is given to matters of personal hygiene (washing one hands, clothes thoroughly). According to the rates of human poverty stated by United Nations, which constitute «synthetic» rates, they imprint the human poverty of a population in one municipality, in relation to the rest, on the basis of their socio-economic profile, so one can reach a conclusion that in the municipalities of the Peripheral region of western Attica the 21% of the population resides there with one of the highest levels of poverty (Region of Attica, 2015). Even though, as mentioned above, the pandemic of the virus A(H1N1) was at its peak during the 48th – 49th week, the findings of the current assignment is that school absences in the region of Attica reached their peak during the 47th week. Meaning one or two weeks earlier than the peak of the phenomenon in the general population which was during the 48th to 49th week (Maltezou, 2011). This proves the assumption that school absences come before the general peak of the phenomenon in the general population.
Section 2
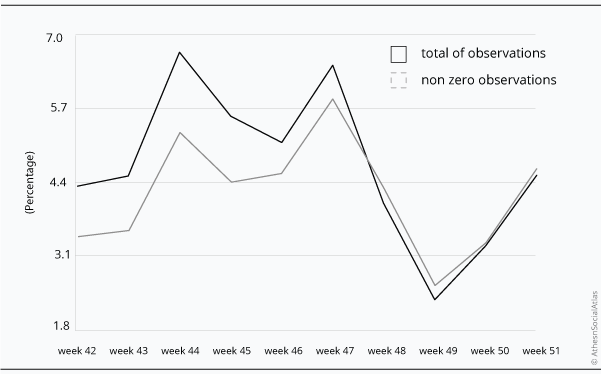
In Figure 3 we notice the development of the average rates of absences throughout ten weeks in Kapodistrian municipalities in the region of Attiki. The dashed line is referred to the total of observations, while the continuous one to non zero (Municipalities with zero percent of absences were excluded). The average rate of absences in the 44th week coincides with the national holiday of the 28th October where one can observe absences for other reasons rather than illness. The week with the highest absentee rates is documented to be the 47th week, of 2009 while the absentee rate during the two following weeks seems to be declining.
Figure 3: average rates of absences per Kapodistrian municipality throughout October to December 2009 per week
Section 3
In this section we present the results of the analysis of spatial autocorrelation which were taken by calculating the total and local rates of Moran’s I with the help of the logistics GeoDa c. 09.2a, (Anselin,1995).
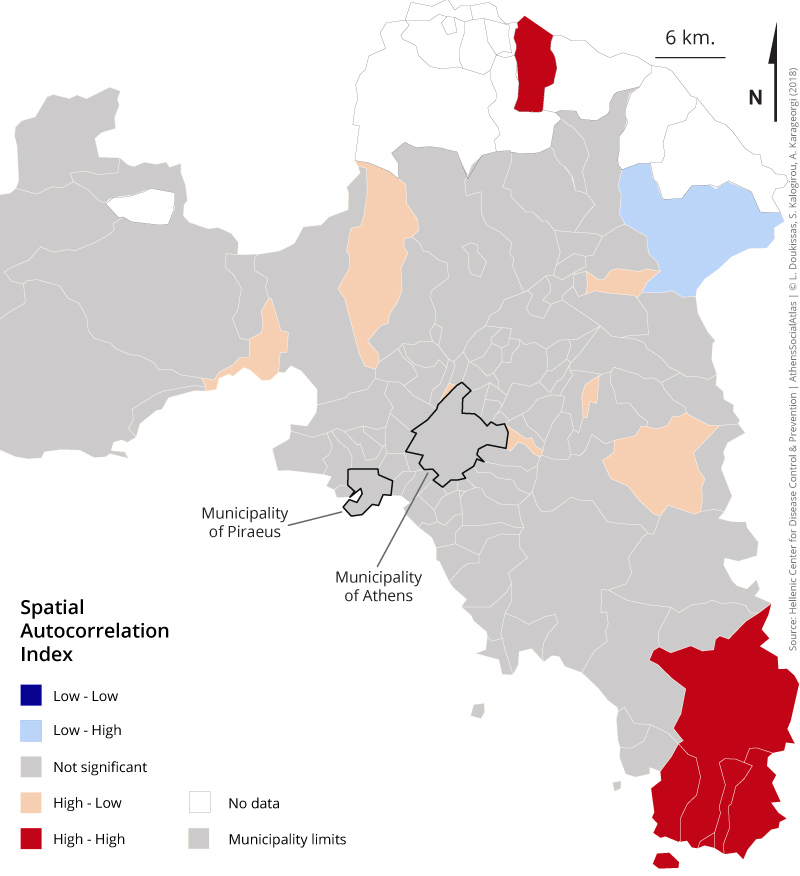
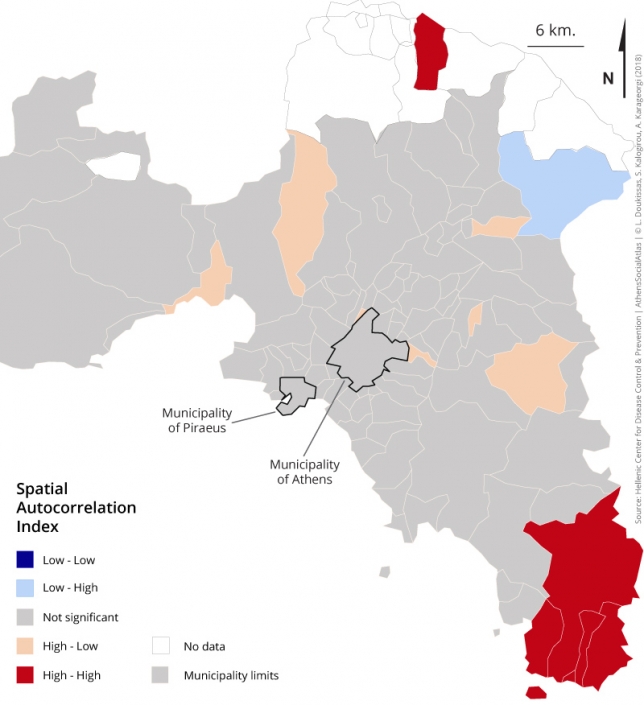
From Μap 11 it is obvious that the data gathered from school absences does not seem to have notable spatial standards. The Moran’s I rate of average absence percentage of the above week is positive.For example, the 49th week the rate of local Moran’s I index is 0,29 and is statistically important at a level 5%.
According to Μap 11, which concerns the classification of local Moran’s Rate of the 49th week , we notice a spatial standard similar to a high absence percentage in neighboring areas per Kapodistria of Lauretiki and many scattered spatial municipalities with high rates that border with municipalities of lower rates of absence percentage.
Map 11: The spatial patterns of absences in primary schools for the 48th week in the region of Attiki.
Conclusion:
We believe the prompt timely and spatial detection of the peak of school absences will add to more rapid mitigation of the phenomenon in the event of a new epidemic wave and hope that this assignment will contribute to achieving this. . The ultimate goal of the government in the event of a new pandemic would be to reduce the time needed to contain the phenomenon (evaluation of severity, informing the medical staff, the making of an efficient vaccination) once it is detected. Such a method that could help in alleviating them is a mechanism of prompt notification of those involved especially when the school absence percentage seems to overpass a certain threshold. As a result, the appropriate authorities will be able to make any further decisions needed regarding school units (Hygiene interventions, closing of schools).
Acknowledgements: The authors feel the need to thank professor of the National Public Health School Takis Panagiotopoulos as well as the scientific associate Dimitri Papamichail for their scientific contribution, support and guidance in the management of the data that arose in this assignment. Their valuable help was a way to complete the current publication.
[1]: Banner photo: https://www.health.harvard.edu/mind-and-mood/does-a-virus-cause-alzheimers, © Dr_Microbe/Getty Images
Entry citation
Doukissas, L., Kalogirou, S., Karageorgi, A. (2019) Spatiotemporal evolution of Primary School Absenteeism during the Pandemic A(H1N1) pdm09 in 2009 – 2010. The case of Attica, in Maloutas T., Spyrellis S. (eds) Athens Social Atlas. Digital compendium of texts and visual material. URL: https://www.athenssocialatlas.gr/en/article/the-pandemic-ah1n1/ , DOI: 10.17902/20971.87
Atlas citation
Maloutas T., Spyrellis S. (eds) (2015) Athens Social Atlas. Digital compendium of texts and visual material. URL: https://www.athenssocialatlas.gr/en/ , DOI: 10.17902/20971.9
References
- Δούκισσας Λ, Καλογήρου Σ, Παναγιωτόπουλος Τ, κ.ά. (2016) Χωροχρονική μελέτη απουσιών την περίοδο εκδήλωσης του ιού H1N1 κατά την πανδημία του 2009. Η περίπτωση της Ελλάδας. Στο: 9ο Πανελλήνιο Συνέδριο HellasGis, Αθήνα: ΕΜΠ.
- Δούκισσας Λ, Τσίμπος Κ και Καλογήρου Σ (2016) Μελέτη Θνησιμότητας λόγω του ιού H1N1 κατά την Πανδημία του 2009. Η περίπτωση της Ελλάδας. Στο: 14ο Εθνικό Συνέδριο του Ελληνικού Τμήματος της Ευρωπαϊκής και Διεθνούς Εταιρείας Περιφερειακής Επιστήμης, Παραγωγική Ανασυγκρότηση και Περιφερειακή Ανάπτυξη, Αθήνα: Πάντειο Πανεπιστήμιο Κοινωνικών Και Πολιτικών Επιστήμων.
- Ινστιτούτο Τεχνολογίας Υπολογιστών και Εκδόσεων (ΙΤΥΕ) (2018) Βάση Δεδομένων καθημερινής Καταγραφής Απουσιών. Πάτρα.
- Καλογήρου Σ (2015) Χωρική Ανάλυση: μεθοδολογία και εφαρμογές με τη γλώσσα R. Σύνδεσμος Ελληνικών Ακαδημαϊκών Βιβλιοθηκών. Available from: http://hdl.handle.net/11419/5029.
- Καλογήρου Σ (2015) Περιφερειακή Στρατηγική για την Κοινωνική Ένταξη και την Καταπολέμηση της Φτώχειας. Αθήνα.
- Κέντρο Ελέγχου και Πρόληψης Νοσημάτων (ΚΕΕΛΠΝΟ) (2009) Εβδομαδιαίες Εκθέσεις Επιδημιολογικής Επιτήρησης της Γρίπης. Αθήνα.
- Τσίμπος Κ και Παπαδάκης Μ (2004) Δημογραφική Ανάλυση – Αρχές- Μέθοδοι-Υποδείγματα. Αθήνα: Εκδόσεις Σταμούλης.
- Anselin L (1995) Local indicators of spatial association – LISA. Geographical analysis, Wiley Online Library 27(2): 93–115.
- Cliff AD and Ord JK (1973) Spatial Autocorrelation. London: Pion.
- Cliff AD and Ord JK (1981) Spatial processes: models and applications. London: Pion.
- Doukissas L, Kalogirou S, Panagiotopoulos T, et al. (2016) Space time study of absenteeism during the Pandemic A (H1N1). The case of Greece. In: HellasGis, Athens: National Technical University of Athens. Available from: http://www.hellasgi.gr/images/9synedrio/Papers/F1.pdf.
- Doukissas L, Kalogirou S and Tsimpos C (2018) Spatial Patterns of SMRs due to the virus A(H1N1)pdm09 during the pandemic in Greece in 2009. European Journal of Geography 9(2): 134–148.
- European Center for Disease Control and Prevention (ECDC) (2010) The 2009 A(H1N1) Pandemic in Europe.
- Glezen WP (1996) Emerging infections: pandemic influenza. Epidemiologic reviews, Oxford University Press 18(1): 64–76.
- Goodchild MF (1987) A spatial analytical perspective on geographical information systems. International journal of geographical information system, Taylor & Francis 1(4): 327–334.
- Health Protection Agency West Midlands H1N1v Investigation Team (2009) Preliminary descriptive epidemiology of a large school outbreak of influenza A (H1N1) v in the West Midlands, United Kingdom, May 2009. Euro Surveillance: Bulletin Europeen sur les maladies transmissibles – European communicable disease bulletin 14(27).
- Hellenic Center for Disease Control and Prevention (HCDC) (2010) Weekly Reports and Epidemiological Surveillance of the Flu During the Period 2009-2010.
- Kalogirou S (2015) Spatial Analysis. Association of Greek Academic Libraries. Available from: http://hdl.handle.net/11419/5029.
- Kalogirou S (2010) Spatial inequalities in income and post-graduate educational attainment in Greece. Journal of Maps, Taylor & Francis 6(1): 393–400.
- Maltezou HC, Katerelos P, Mavrouli M, et al. (2011) Seroepidemiological study of pandemic influenza H1N1 following the 2009–2010 wave in Greece. Vaccine, Elsevier 29(38): 6664–6669.
- Nishiura H, Wilson N and Baker MG (2009) Estimating the reproduction number of the novel influenza A virus (H1N1) in a Southern Hemisphere setting: preliminary estimate in New Zealand. The New Zealand Medical Journal, New Zealand Medical Association (NZMA) 122(1299): 73–77.
- Panagiotopoulos T, Bonovas S, Danis K, et al. (2009) Cluster of new influenza a (H1N1) Cases in travellers returning from sCotland to greeCe – Community transmission witHin tHe european union? Euro Surveillance, European Centre for Disease Prevention and Control 14(21): 19226.
- Tsimpos C and Papadakis M (2004) Demographic Analysis Principles – Methods – Models. Athens: Stamoulis.
- World Health Organization (WHO) (2009) Influenza-like illness in the United States and Mexico. Disease Outbreak News.
