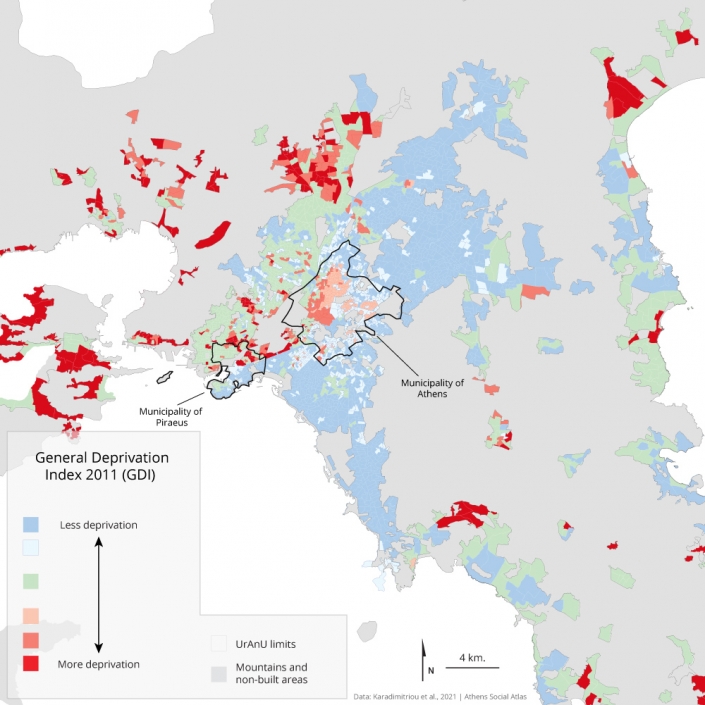
Deprivation areas in Attica
Arapoglou Vassilis|Karadimitriou Nikos|Maloutas Thomas|Sayas John
Economy, Quartiers, Social Structure
2021 | Jun
The objective in this section is to locate the city’s neighbourhoods where multiple deprivation is elevated. Similar studies have been developed in several countries (the UK having probably the largest number) and they are based on variables related to quality of life e. The content of this section is based on work in progress about multiple deprivation in Athens and in the region of Attica (Arapogou et al., 2021; Karadimitriou et al., 2021; Karadimitriou et al. 2017).
The method followed in order to map multiple deprivation is rather simple, but innovative nevertheless, insofar as the study of deprivation in Greek cities is concerned: The variables used were provided by the 2011 Population Census. Either very high, or very low, values in some areas indicated the presence of issues of potential concern. These variables cover three sectors: Employment, education and housing. For each of these sectors, a deprivation index was calculated. The sum of these three indices is the index of multiple deprivation (IMD).
A number of variables was used to calculate the deprivation index for each sector. Sub-sectors were created within each sector to accommodate the selected variables (table 1). Sub-sectors were attributed equal weights, meaning that they contributed equally to the sector’s overall index, irrespective of the number of variables they comprised. In the same way, the three sectors contributed equally to the IMD calculation.
Table 1: Variables used to calculate deprivation indices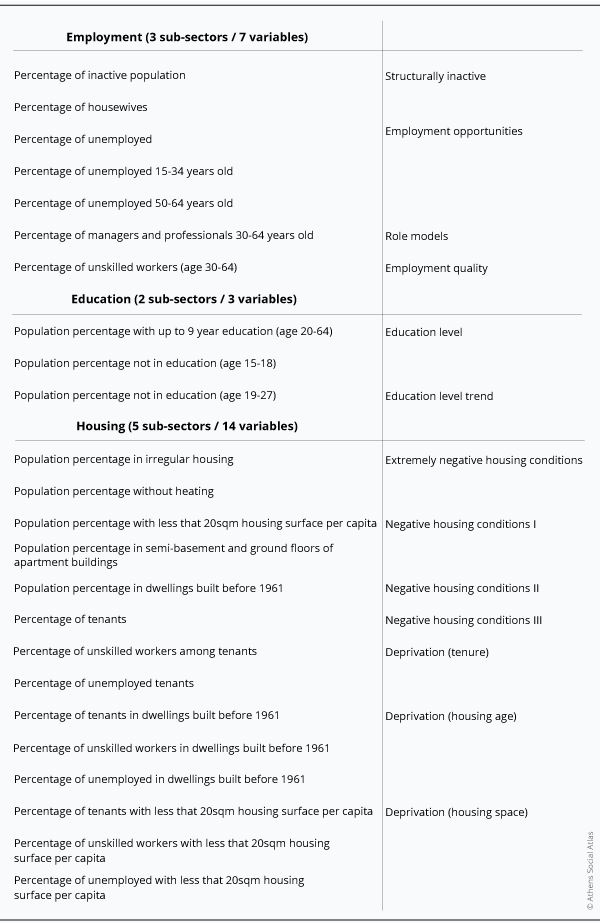
Each variable in every spatial unit of analysis (URANU) was attributed a deprivation index value according to its average and standard deviation, in the following way:
χ = value of variable “ν” in URANU “i”
1-7 = range of values of deprivation indices
1: χ < μ(ν) 2: μ(ν) < χ < μ(ν)+0,5 stdev(ν) 3: μ(ν)+0,5 stdev(ν) < χ < μο ν+1 stdev(ν) 4: μ(ν)+1 stdev(ν) < χ < μο ν+2 stdev(ν) 5: μ(ν)+2 stdev(ν) < χ < μο ν+3 stdev(ν) 7: μ(ν)+3 stdev(ν) < χ [/av_textblock] [av_gallery ids='20223,20229,20232' style='big_thumb' preview_size='no scaling' crop_big_preview_thumbnail='avia-gallery-big-crop-thumb' thumb_size='portfolio' columns='5' imagelink='lightbox' lazyload='avia_lazyload' av_uid='av-jx0r9zze' admin_preview_bg=''] [av_textblock size='' font_color='' color='' av-medium-font-size='' av-small-font-size='' av-mini-font-size='' av_uid='av-jv2pwr9z' admin_preview_bg='']
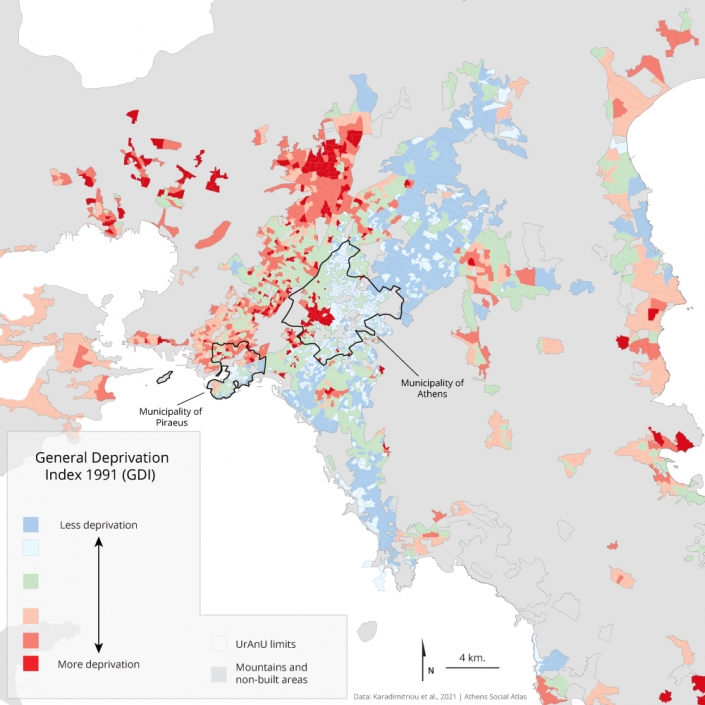
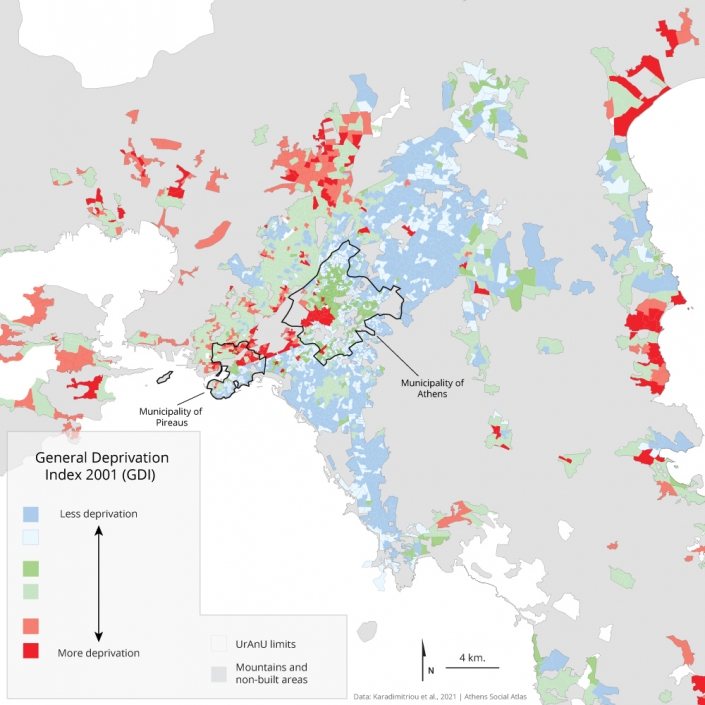
Maps 1-3: Distribution of residential areas according to the Index of Multiple Deprivation (IMD) for 1991, 2001 and 2021
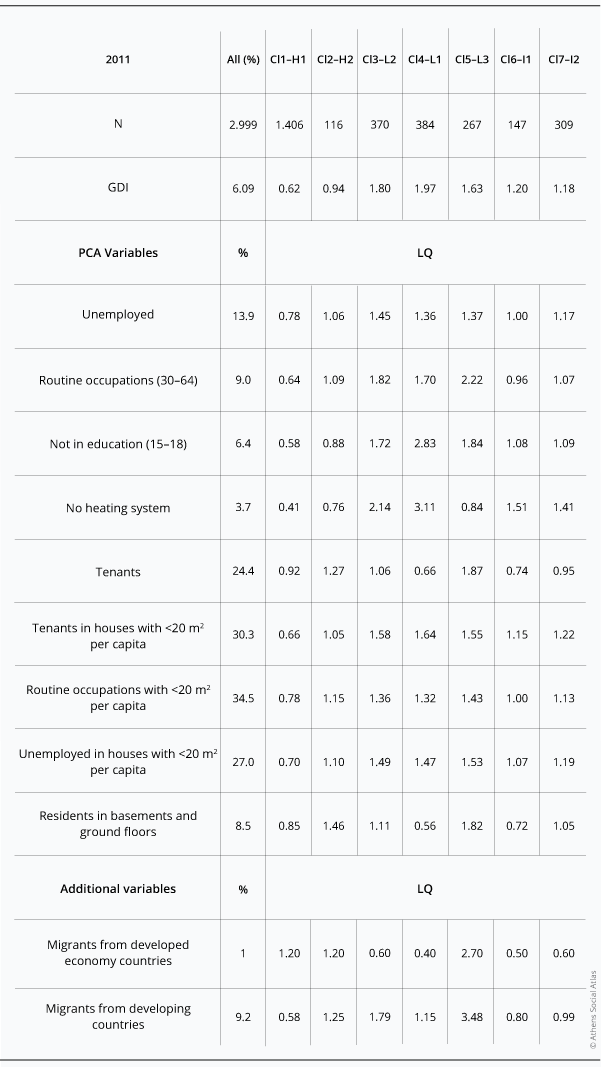
Table 2 shows the content of residential area σ grouped according to the IMD. Values in this table are location quotients, i.e. multiple or submultiple values of the mean of each variable for the whole city. For example, the percentage of the unemployed in the area group with the lowest index of deprivation (group 1) is 0,69 of the mean of unemployment, while in those with the highest index (group 6) it is 1,75 times the mean.
Table 2 shows that the variables that really make a difference for the areas of intense deprivation (group 6) in respect to their average city values are: living in irregular housing, housing without heating, early drop-out from education (15-18 year old), unskilled employment, lack of housing space per capita, housewife status for women, and unemployment. In these deprivation areas young people and immigrants from developing countries are overrepresented —mainly from the Indian sub-continent— although these variables were not used to calculate the index of deprivation.
Table 2: Residential areas, grouped according to the Index of Multiple Deprivation (IMD 1991) and compared using the location quotients of various social variables (location quotients) 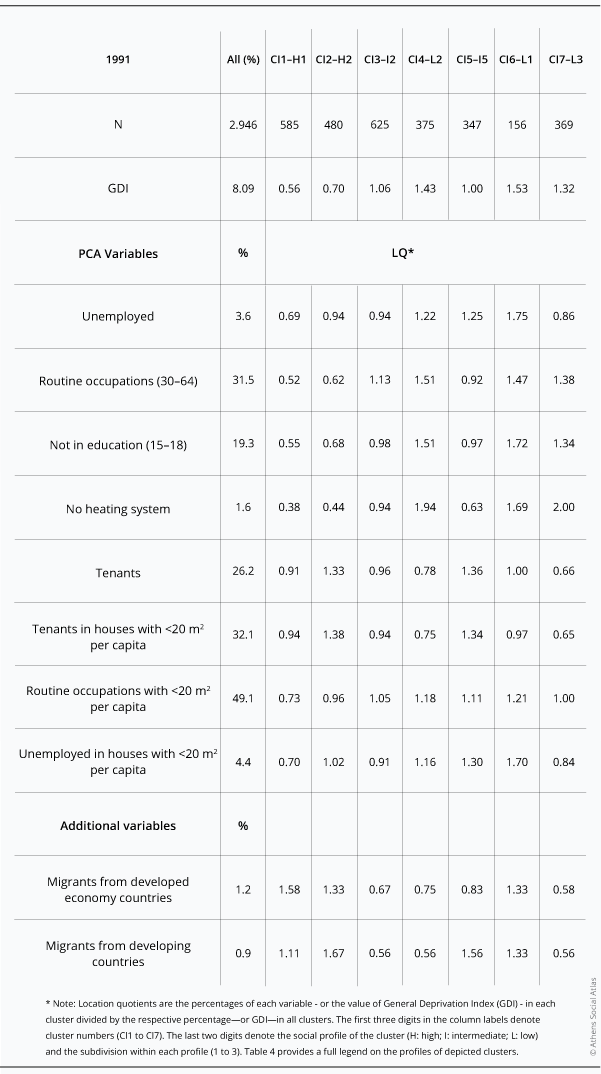
Table 3: Residential areas, grouped according to the Index of Multiple Deprivation (IMD 2001) and compared using the location quotients of various social variables (location quotients) 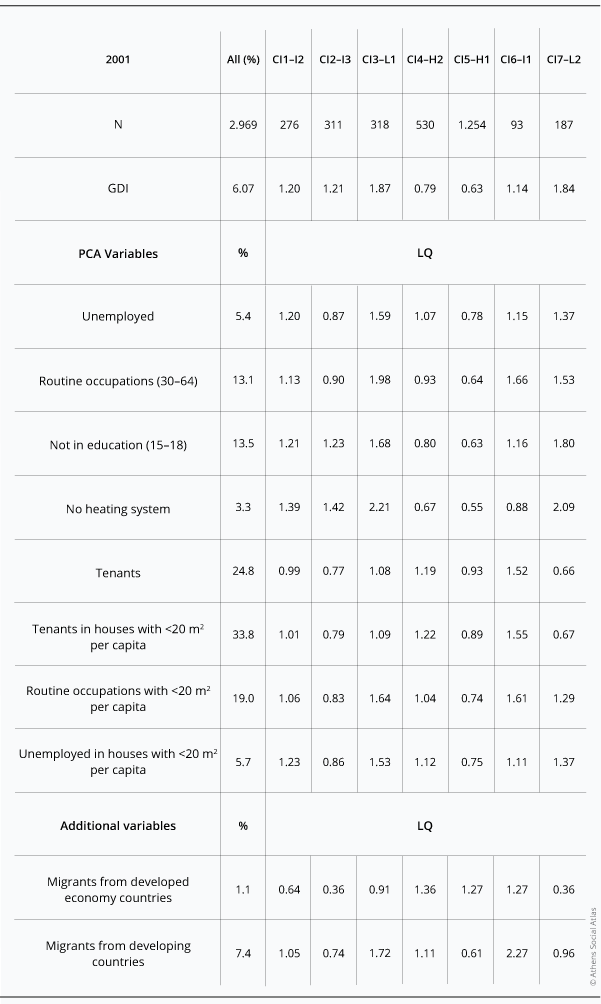
Table 4:Table 3: Residential areas, grouped according to the Index of Multiple Deprivation (IMD 2011) and compared using the location quotients of various social variables (location quotients)
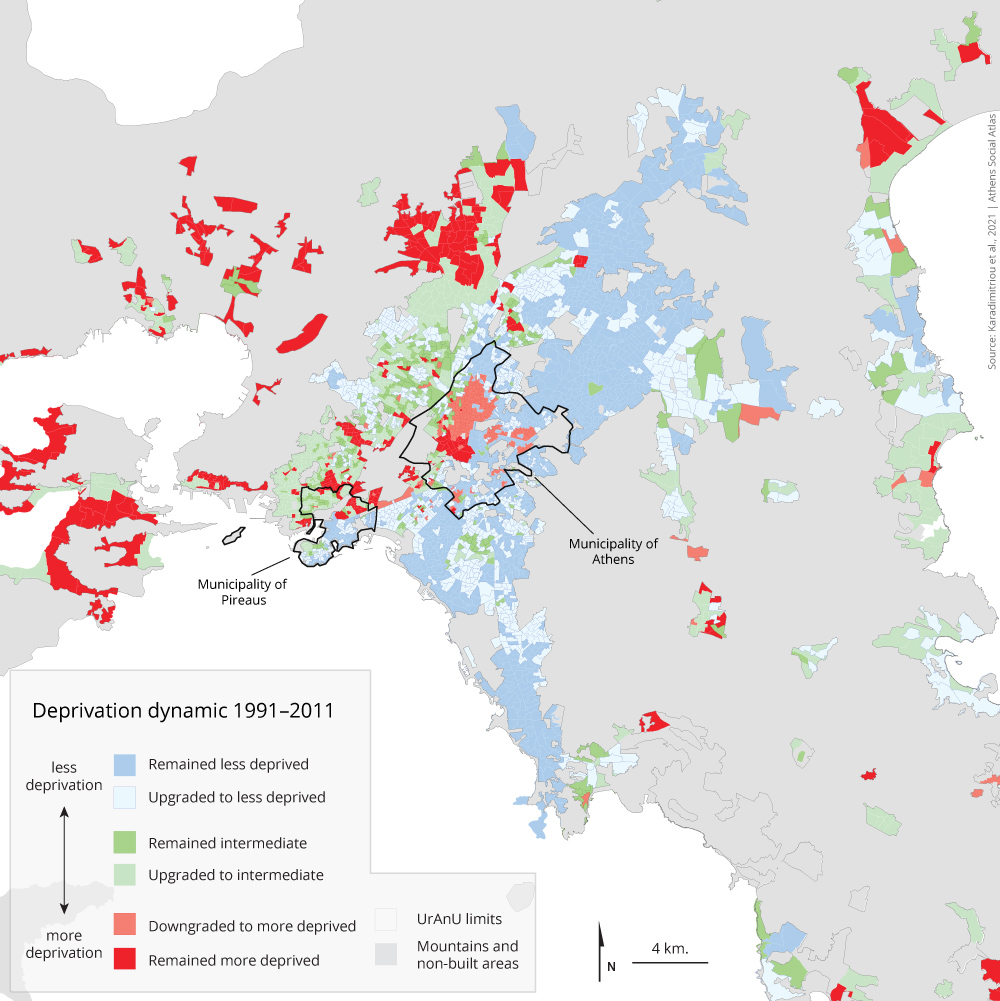
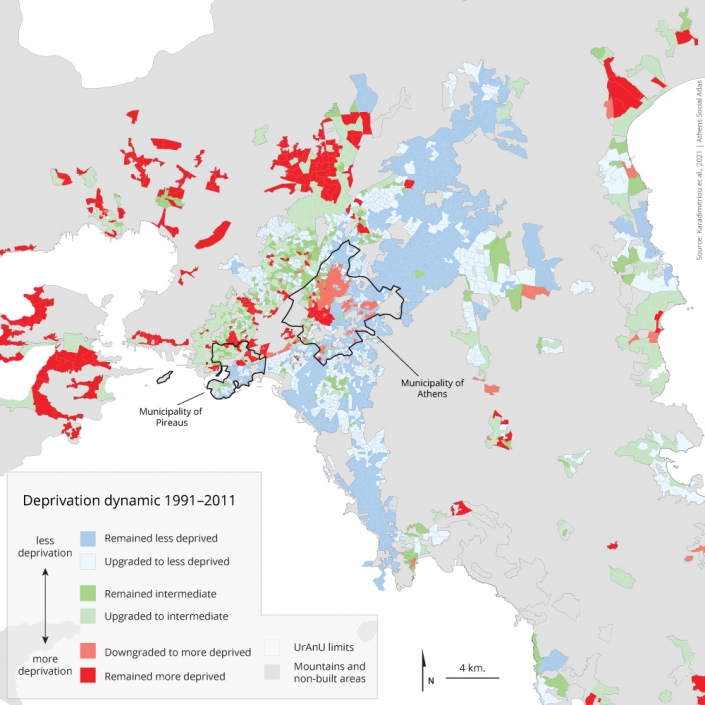
Map 4 shows the spatial and temporal dynamic of the multiple deprivation areas in Attica, between 1991 and 2011. The map shows the changes in multiple deprivation in the approximately 3000 URANUs (URANU: Urban ANalysis Unit). Every URANU has approximately 1200 inhabitants.
The areas in deep blue are URANUs where multiple deprivation was low in 1991 and remained low in 2011, as described in Table 2. Areas in light blue are URANUs where multiple deprivation was moderate in 1991 and dropped further in 2011. In dark green areas multiple deprivation remained moderate throughout the period 1991-2011. Multiple deprivation became moderate in areas in light green during said period. Finally, in deep red are the areas where multiple deprivation remained high throughout said period, whereas light red are areas where multiple deprivation became high.
There are three key observations regarding the spatiality of multiple deprivation during the period 1991-2011:
(1) Multiple deprivation in the periphery, especially in the west of Attica, remains stable insofar as its location is concerned.
(2) There is a limited number of enclaves within the Athens basin, where deprivation remains unchanged. These are a few areas in the centre of the Municipality of Athens and at the border of the Municipality of Piraeus. Deprivation in most URANUs in the Western Sector has dropped to moderate level.
(3) In the centre of the Municipality of Athens, north of Omonoia Square, an area has emerged where multiple deprivation has increased dramatically. Deprivation in that area used to be low or moderate and now is high.
Map 4: The spatial and temporal dynamics of multiple deprivation in Athens (1991-2011)
Note
This article and the relevant publications mentioned in the list of references are the last papers we jointly worked on with our beloved friend and colleague John Sayas who passed away on 15/7/2020.
Entry citation
Arapoglou, V., Karadimitriou, N., Maloutas, T., Sayas, J. (2021) Deprivation areas in Attica, in Maloutas T., Spyrellis S. (eds) Athens Social Atlas. Digital compendium of texts and visual material. URL: https://www.athenssocialatlas.gr/en/article/deprivation-areas/ , DOI: 10.17902/20971.102
Atlas citation
Maloutas T., Spyrellis S. (eds) (2015) Athens Social Atlas. Digital compendium of texts and visual material. URL: https://www.athenssocialatlas.gr/en/ , DOI: 10.17902/20971.9
References
- Arapoglou V, Karadimitriou N, Maloutas T, et al. (2021) Multiple Deprivation in Athens: a legacy of persisting and deepening spatial divisions. GreeSE Paper. Available from: http://eprints.lse.ac.uk/108940/.
- Karadimitriou N, Maloutas T and Arapoglou V (2021) Multiple Deprivation and Urban Development in Athens, Greece: Spatial Trends and the Role of Access to Housing. Land, Multidisciplinary Digital Publishing Institute 10(3): 290. Available from: https://doi.org/10.3390/land10030290.
- Karadimitriou N, Maloutas T, Arapoglou V, et al. (2017) La comprensión y medición de la privación múltiple en Atenas, Grecia. In: Bournazou E (ed.), Gentrificacón. Miradas desde la academia y la ciudadanía, Universidad Nacional Autónoma de México, pp. 219–242.

