Spatial inequalities regarding health in Attica
Dedousis George|Dimitriou Maria (Melina)|Georganos Stefanos|Kalafati Ioanna-Panayota|Kalogirou Stamatis
Health
2015 | Dec
Cardiovascular diseases (CD) have been the main cause of death in Greece and the second cause of death worldwide during the last few years. According to the Hellenic Statistical Authority, in 2012, 42.6% of deaths (i.e. 49,728 people) in Greece were caused by CD. According to a report by the World Health Organization (Mendis et al. 2011), in 2008, deaths caused by CD represented 31% or 17.3 million deaths worldwide, with great inequalities between developing and developed countries. In our country, the prevalence of CD – i.e. its frequency in the general population and the risk factors for CD, were investigated by several studies: the Seven Countries Study, Athens Heart, EPIC-Greek and ATTICA; which showed that Greece’s population has shifted from low to high risk (Panagiotakos et al. 2008).
This paper attempts to highlight the spatial inequalities in health status with regard to the risk of cardiovascular diseases in a sample of Attica’s population, by means of mapping and by calculating relevant indicators. The results presented below come from an exploratory spatial analysis of healthcare levels in the population sample and they cannot be generalised to the whole population of Attica because the sample is not necessarily representative. However, we try to highlight the importance of studying the spatial aspect of the phenomenon so that CDs can be linked to environmental factors that may influence their unequal spatial distribution in the future.
Data
The population sample under examination was selected as part of the THISEAS Study using data of patients with coronary heart disease (CHD) in cardiology clinics of hospitals in Attica. These were outpatients or inpatients without a medical history of CD. Moreover, we also collected data of people with no medical history of CD from Municipalities and Seniors Open Protection Centres (KAPI) in Kallithea, Moschato and Nea Smyrni. The data collected included cardiovascular risk factors. For the purposes of this work, a digital database of geospatial data was created with reference to the geographical location (residence) of respondents and with the help of an open source Geographic Information System.
The THISEAS study
The THISEAS study (The Hellenic study of Interactions between Snps and Eating in Atherosclerosis Susceptibility) is a case-control study which aims to (a) highlight new gene polymorphisms affecting the risk of coronary heart disease (CHD), (b) identify dietary patterns modifying the risk of CHD and c) check the interaction between dietary patterns and genetic composition regarding CHD risk.
Theoretical background
CHD has a multifactorial aetiology, which includes both genetic and environmental factors, such as diet. Identifying CHD risk factors has been one of the most significant achievements of epidemiological investigations. Risk factors are decisive in assessing a person’s risk of suffering from the disease. It is important that these factors be evaluated, as they can form the foundation for prevention or treatment. The most common way of classifying risk factors is by dividing them into modifiable and non-modifiable. Modifiable factors include arterial hypertension, diabetes, dyslipidaemia, obesity, smoking and lack of physical activity. Non-modifiable factors include gender, age, family history of premature coronary heart disease (Jorde et al. 2003) and genetic factors (Chaer et al. 2004). Identifying modifiable factors such as physical exercise and diet helps a lot in preventing and reducing the probability of CHD.
Methodology
The spatial analysis of health data is a relatively new research area for quantitative geography and for health sciences that could broadly be defined as spatial epidemiology. In this subject, we can distinguish two major categories of spatial analysis techniques: spatial point techniques and regional analysis of grouped disease cases.
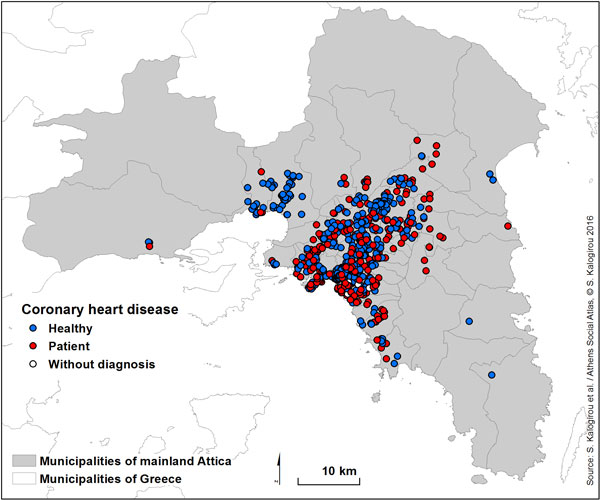
In this paper, the dots refer to individuals who either do not suffer from CHD (controls) or patients with CHD, as shown in Map 1. Both the map and the calculation of the K-function (Ripley 1977) show that patients with CHD are not randomly distributed in space but are spatially concentrated. Given these spatial clusters, it is very interesting to examine whether specific health characteristics of the respondents have spatial similarities or differences. Spatial autocorrelation is a method we can use to determine whether observations of a variable that are spatially close to each other also have similar or dissimilar values. The spatial Gini inequality coefficient combined with the coefficient of Moran’s I spatial autocorrelation (Καλογήρου 2011) help us detect spatial inequalities in health data and possible spatial clusters of respondents with similar health data for the population sample under examination.
The Gini coefficient is widely used in economics for measuring income inequality. It assumes values from 0 to 1, where 0 indicates complete income equality while 1 complete income inequality. The traditional Gini coefficient is calculated based on individual income, regardless of the geographical location of each person. According to Rey and Smith (2013), the spatial separation of the traditional Gini coefficient allows us to calculate inequality between neighbouring and non-neighbouring observations. These coefficients were calculated using Ictools (Kalogirou 2015).
The results of the exploratory spatial analysis
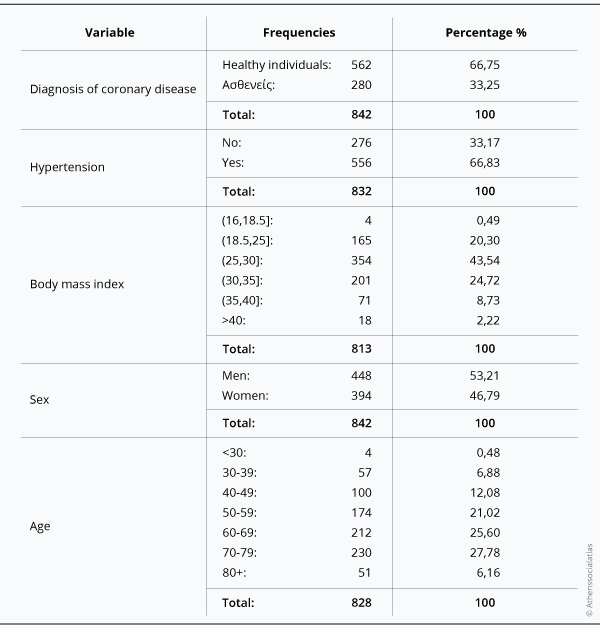
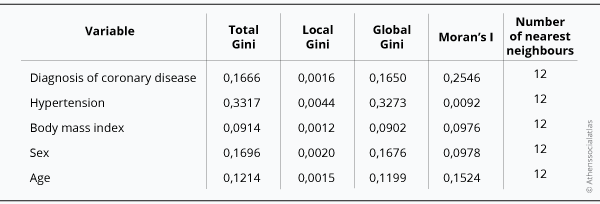
Out of the usual factors associated with the occurrence of CHD, this paper analyses Body Mass Index (BMI), arterial hypertension, age and gender. The analysis includes descriptive statistics and spatial coefficients, presented in Table 1. The frequencies shown in the second column of the table were calculated after the cases for which no data existed were removed. The Gini and Moran’s I coefficients were calculated with weights wij=1 for the 12 closest neighbours and 0 for the rest. The coefficient values in bold are statistically significant at a confidence level greater than 95%.
Graph 1a. Descriptive statistics of the population sample examined for coronary artery disease and the factors associated with it
Graph 1b. Spatial indexes of the population sample examined for coronary artery disease and the factors associated with it
The statistics in Graph 1 show that the sample mainly comprises a middle-aged or older population with BMI greater than normal, most of them suffering from hypertension, but not necessarily CHD. This was to be expected, given the age distribution of respondents, who were mostly over 60 years old. Hypertension is unequally distributed between respondents compared to other health characteristics. However, since Moran’s I coefficient is close to 0 we can conclude that people with hypertension are randomly distributed in space. However, people with CHD, of a similar age and with a similar BMI, tend to neighbour with others with the same characteristics, as shown by the statistically significant value of Moran’s I spatial autocorrelation coefficient and the very low value of the Gini spatial coefficient among neighbours.
Based on the statistical analysis of the data, CHD occurs mainly in men with normal weight or in overweight men who are not necessarily highly obese. In men, it occurs at ages between 50 to 79, with most cases observed at ages 60 to 69, while women are more likely to suffer from the disease in older ages (70-79).
In Map 1, red dots represent patients with CHD, blue dots represent healthy subjects and white dots subjects without a diagnosis. The map clearly shows areas, such as the Elefsina and Aspropyrgos municipalities, with a cluster of healthy people, and other areas, such as the municipalities of Korydallos, Aghia Varvara, and Palaio Faliro, where people diagnosed with CHD cluster. This distribution is largely due to both the comparative data collection method (healthy individuals from the areas of Elefsina and Aspropyrgos were included in the sample) and the composition of the population (age distribution, socioeconomic status).
Map 1: Location of the population sample and of CHD sufferers
Two out of three people in the sample (66.5%) have hypertension. The statistical analysis of the sample’s health data shows that, notwithstanding the apparent increase of hypertension with BMI and age, a significant number of people with normal weight suffer from hypertension. Generally, hypertension appears earlier in men, even with lower BMIs, compared to women in the sample studied and presented herein.
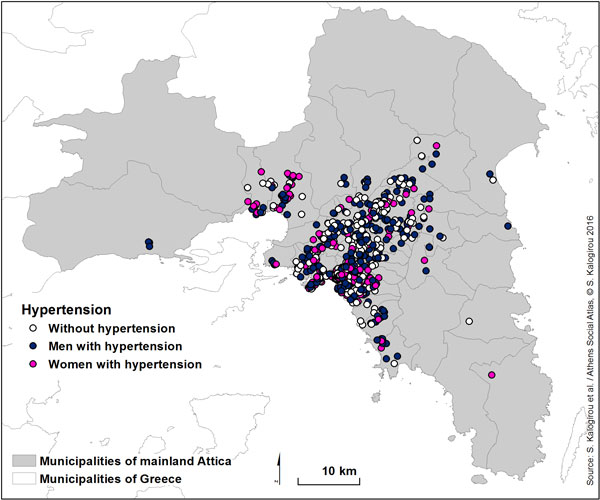
Map 2 is a hypertension map according to gender (men and women with hypertension). This visually confirms spatial inequalities in hypertension, even among people in neighbouring locations, and the relatively random spatial distribution of hypertension sufferers.
Map 2: Hypertension map of the population sample by gender
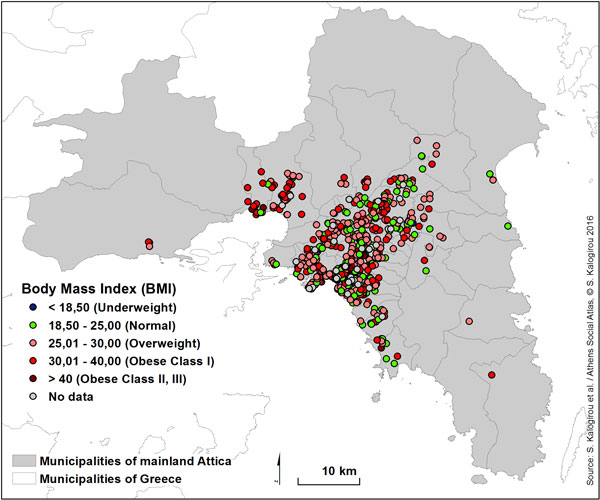
Finally, Map 3 presents BMIs classified into five groups: under 18.5 for underweight subjects, 18.5 to 25 for subjects with normal weight, 25 to 30 for overweight subjects, 30 and 40 for obese people and more than 40 for people with very high obesity. This variable displays small spatial inequalities. However, there are clusters of overweight people in the municipalities of Kallithea, Alimos, Elefsina and Aspropyrgos, while Halandri seems to have more people with normal weight.
Map 3: Body Mass Index (BMI) map
Regression analysis was used to determine whether gender, age, BMI and hypertension affect CHD in this population sample. The initial results of this analysis show that men are six times more likely than women to develop CHD and subjects with hypertension are more than seven times more likely to develop the disease than those without hypertension. Age and BMI do not seem to significantly alter the risk of developing the disease in the presence of other variables. Since the appearance of a disease may be influenced by many factors, these results come with a caveat that further investigation may be required due to the small number of factors and observations included.
The study on the health status of a random population sample of people residing in Attica has shown spatial inequalities in BMI and in the occurrence of CHD. Some municipalities, such as the municipality of Palaio Faliro, exhibit both a high BMI and high rates of people with CHD, which may be due not only to individual but also to environmental factors.
These findings raise important research questions for future investigation. One of these is the effect of environmental factors in CHD, which shall be the next step in this research.
Although CHD and CDs have been the main cause of death in Greece in the past few years, the effect of space on their prevalence and the spatial distribution of populations at high risk for these diseases had not been previously studied. The present study sought to highlight the spatial inequalities of health characteristics associated with CDs, such as hypertension and body mass index, in the population of Attica. The data analysis demonstrated that a large number of patients with CHD is concentrated in the municipalities of Western Attica. This may be associated with the chronically lower standard of living in these municipalities. The increase in income inequalities due to the economic crisis of recent years will inevitably lead to an increase in health inequalities. The state (both central and local government) should follow an appropriate policy, providing better services to those who need them most, both to manage CDs and to raise awareness in order to prevent them.
Entry citation
Dimitriou, M., Georganos, S., Kalafati, I. P., Kalogirou, S. (2015) Spatial inequalities regarding health in Attica, in Maloutas T., Spyrellis S. (eds) Athens Social Atlas. Digital compendium of texts and visual material. URL: https://www.athenssocialatlas.gr/en/article/inequalities-in-health/ , DOI: 10.17902/20971.22
Atlas citation
Maloutas T., Spyrellis S. (eds) (2015) Athens Social Atlas. Digital compendium of texts and visual material. URL: https://www.athenssocialatlas.gr/en/ , DOI: 10.17902/20971.9
References
- Καλογήρου Σ (2011) Χωρικές ανισότητες και ερµηνευτικοί παράγοντες της γεωγραφικής κατανομής του δηλωθέντος εισοδήματος στην Ελλάδα. Αειχώρος 15: 68–101. Available from: http://www.aeihoros.gr/article/el/xorikes-anisotites-kai-ermineutikoi-paragontes-tis-geografikis-katanomis-tou-dilothentos-eisodimatos-stin-ellada.
- Chaer RA, Billeh R and Massad MG (2004) Genetics and gene manipulation therapy of premature coronary artery disease. Cardiology, Karger Publishers 101(1–3): 122–130.
- Jorde LB, Carey JC and Bamshad MJ (2003) Medical genetics. 3rd ed. St. Louis: Elsevier Health Sciences.
- Kalogirou S (2015) Local Correlation, Spatial Inequalities, Spatial Regression and Other Tools. Available from: https://cran.r-project.org/web/packages/lctools/lctools.pdf.
- Mendis S, Puska P and Norrving B (2011) Global atlas on cardiovascular disease prevention and control. Geneva: World Health Organization.
- Panagiotakos DB, Pitsavos C, Chrysohoou C, et al. (2008) Five-year incidence of cardiovascular disease and its predictors in Greece: the ATTICA study. Vascular Medicine, Sage Publications 13(2): 113–121.
- Rey SJ and Smith RJ (2013) A spatial decomposition of the Gini coefficient. Letters in Spatial and Resource Sciences, Springer 6(2): 55–70.
- Ripley BD (1977) Modelling spatial patterns. Journal of the Royal Statistical Society. Series B (Methodological), JSTOR 39(2): 172–212.

