Inequality and segregation in Athens: Maps and data
Maloutas Thomas|Spyrellis Stavros Nikiforos
Built Environment, Economy, Education, Ethnic Groups, Housing, Quartiers, Social Structure
2019 | Dec
Introduction
Our aim in this chapter is to illustrate inequalities and segregation across several fields, like employment, education and housing.
These inequalities and segregation are mainly revealed through the following 180 maps. These were organised in 17 dynamic groupings of maps, each one comprising a distribution of hierarchical categories within a specific field in order to increase the visibility of the spatial structure of inequalities and segregation. For example, one of these dynamic groupings depicts the areas of residence of the population according to their education level (2.1 Educational level), based on an ordinal scale.
Apart from the thematic sections in this chapter, an additional section comprise maps resulting from synthesis of data from different fields and following different statistical and mapping techniques. It is the section on the social typology of residential areas.
The following list comprises the themes of the chapter that the reader can directly access by clicking on the active link in each title.
1. Demography
1.1 Age groups
1.2 Family status
1.3 Household type
1.4 Ethic groups
2. Education
2.1 Education level
2.2 Youth not in education
2.3 Country of studies
3. Employment
3.1 Main activity
3.2 Occupations
3.3 Sectors of economic activity
3.4 Branches of economic activity
4. Housing and living standards
4.1 Main sources of income
4.2 House tenure
4.3 Housing units size
4.4 Housing surface per capita
4.5 Age of housing stock
4.6 Heating system
4.7 Access to the internet
4.8 Private cars
5. Composite themes
5.1 Social typology of residential areas
All the data used to produce the maps in this chapter originate from the 2011 Census of the Greek Statistical Authority (ELSTAT) and some additional data originate from previous censuses (1991, 2001). They were all accessed through the online application “Panorama of Greek Census Data 1991-2011” (https://panorama.statistics.gr/en), which is the outcome of a long cooperation between the National Centre for Social Research (EKKE) and ELSTAT.
Users can access directly the data used to produce the maps in this entry. They can be used to map the same phenomena in alternative ways through the mapping options provided by the application “Panorama of Greek Census Data 1991-2011” (menu: toolsimport custom data). Further information is provided in a separate file.
This online application provides data for spatially detailed analyses for all Greek cities with a population over 50.000 in 2011. The spatial units of analysis are small units called URANUs (Urban Analysis Units) and correspond more or less to ELSTAT’s census tracts. Metropolitan Athens comprises 3.000 URANUs with an average population of 1.200, which shows that the following analysis is much more detailed than the usual analysis on the local authority level (59 local authorities or, at best, their 117 municipal and local community subdivisions, which moreover are very uneven in size).
The area covered by the maps is not the entire urbanised area, but the broader central part of the metropolitan area. It comprises the most populous areas and extends from the coast of Eastern Attiki to Elefsina. Areas like Lavreotiki, part of Kalyvia, Megara, Nea Peramos, part of Salamina and Grammatiko were left outside the map. All these areas excluded from the map may have some interest, but their inclusion would reduce the visibility of differences among spatial units in the smaller but much more populated and densely built parts of the city.
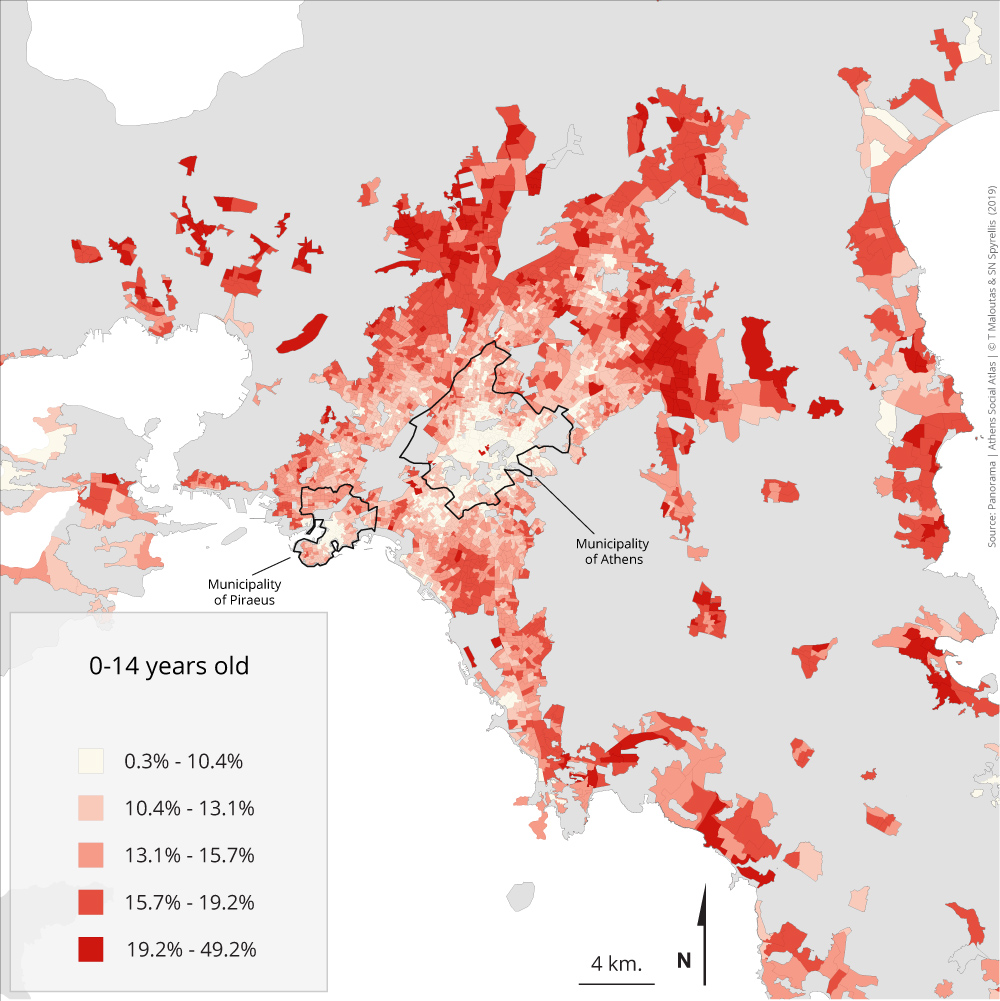
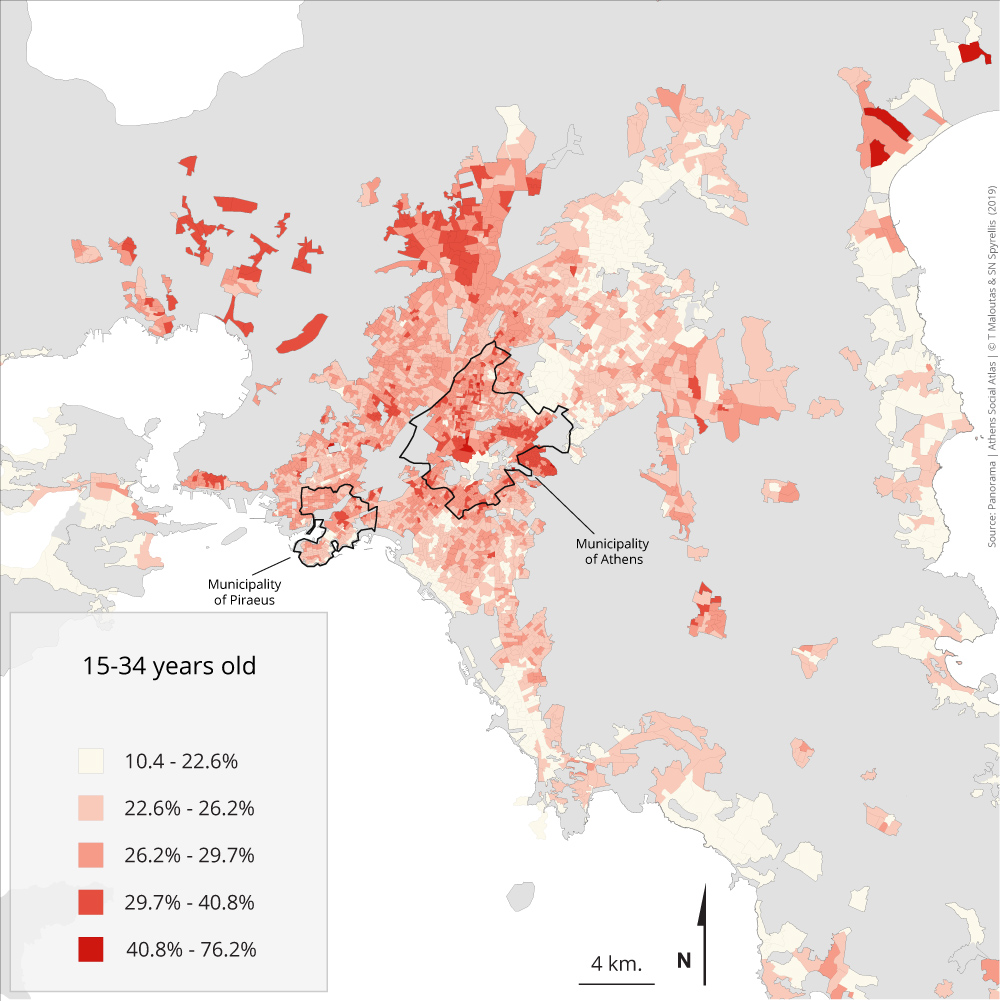
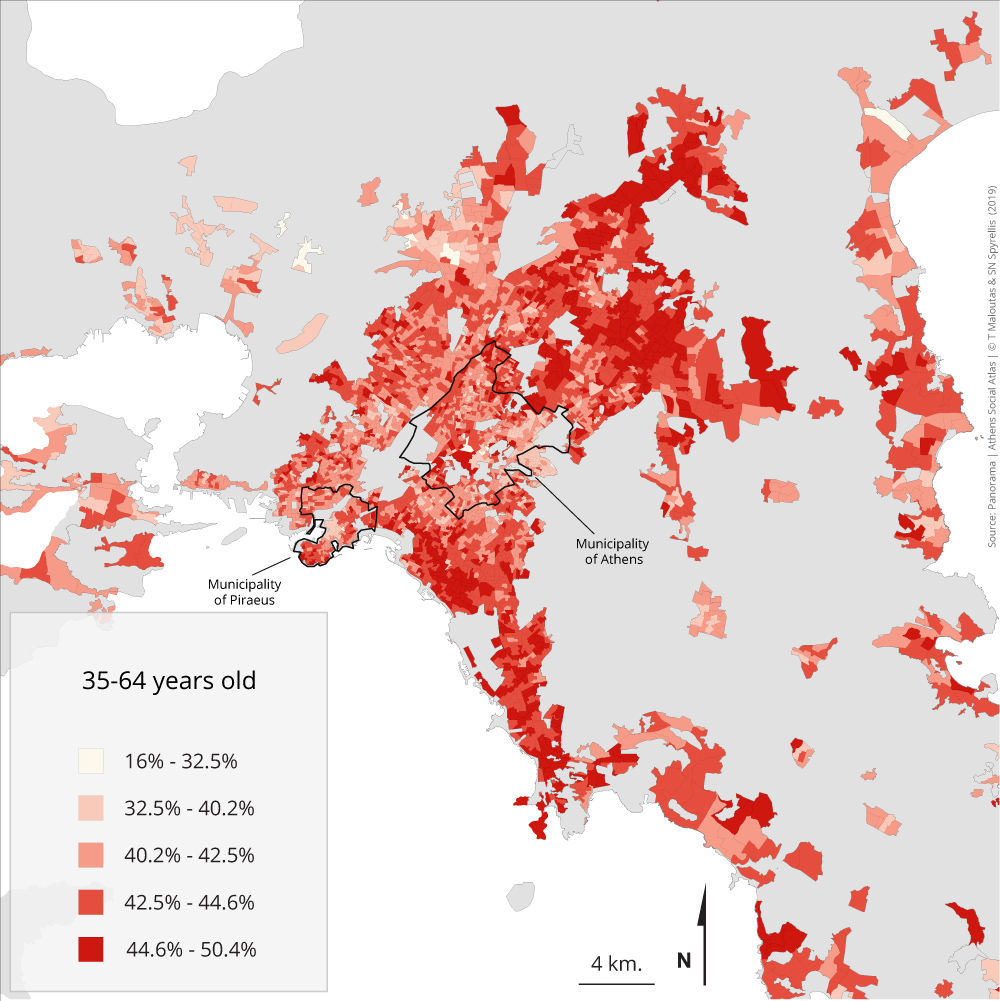
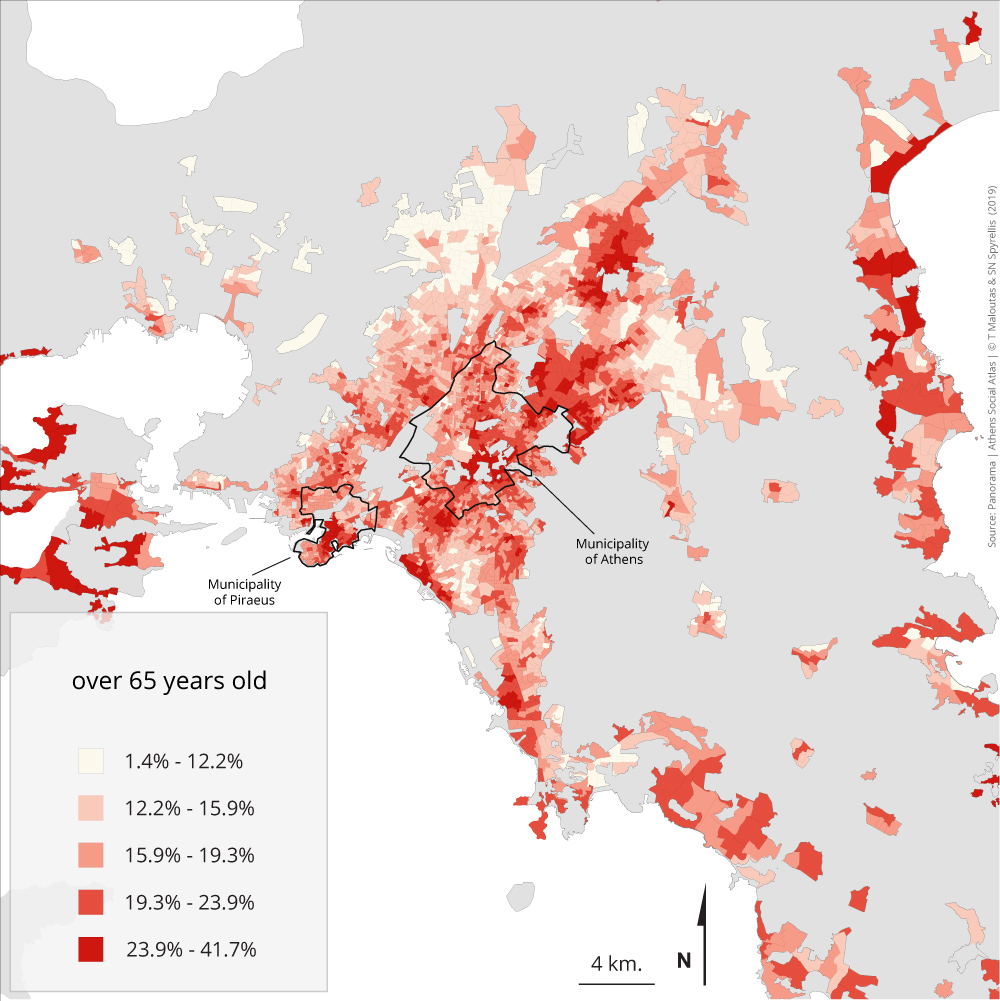
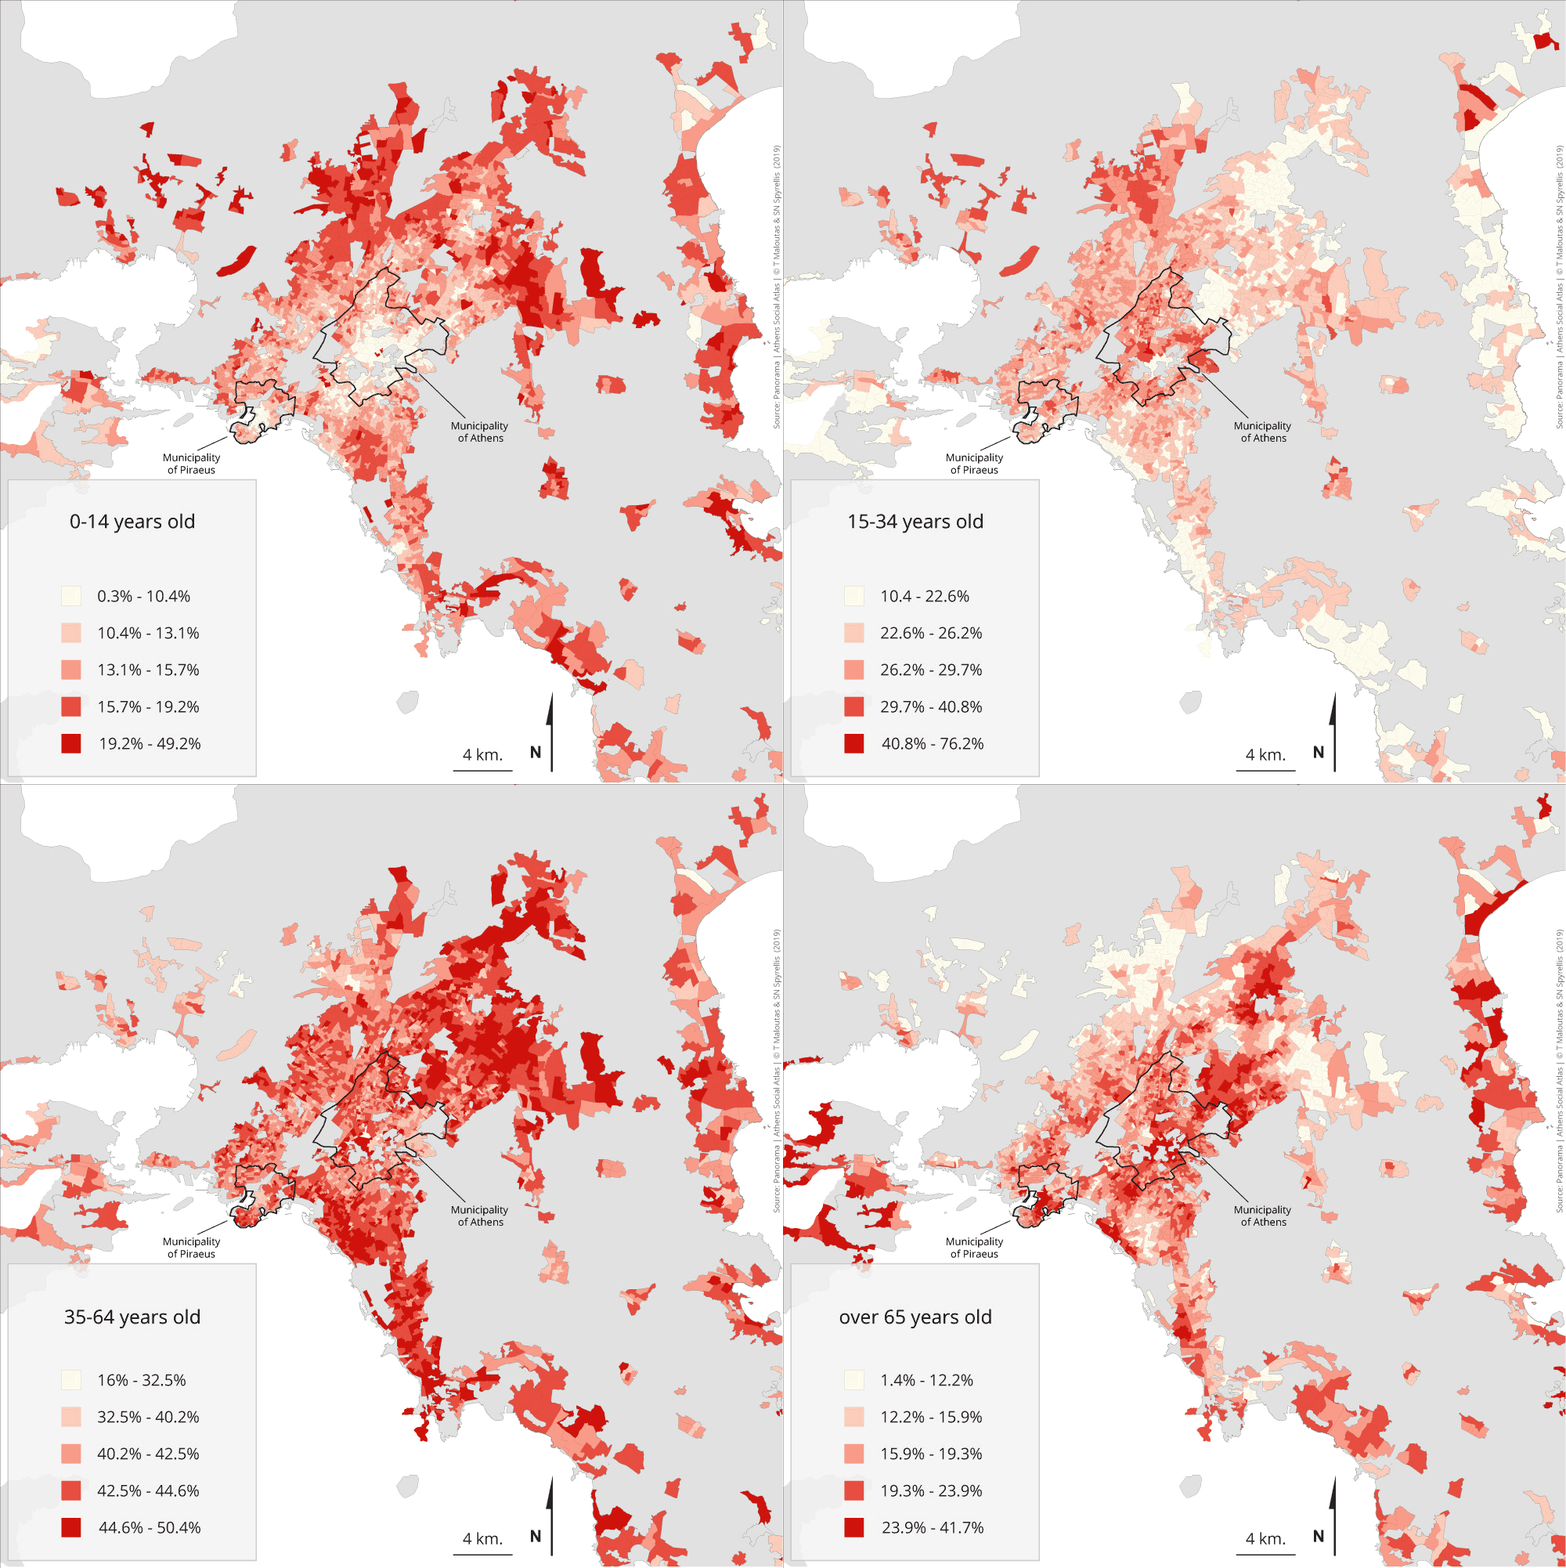
Maps 1.1.1 – 1.1.4: Population distribution by age group and area of residence (2011)
The age of the population is a parameter that substantially differentiates the neighbourhoods of Athens. Younger ages (childhood and early adolescence) are more concentrated in the new expansions of the metropolis—in Mesoghia at the eastern part of the metropolis, at the western part around the bay of Elefsis, at the coastal zone in the east and in a few municipalities in the northwest, northeast and the south of the central part of the metropolis.
The elderly, on the contrary, are concentrated in older neighbourhoods of the city and in areas where higher occupational strata are also concentrated. The central municipality (Municipality of Athens) is more complex, even though it is the oldest part of the city. The relocation of a large part of older households belonging to higher and intermediate income groups to the suburbs and the arrival of much younger and much poorer households have limited the concentration of elderly population, especially in the western part of the central municipality.
The relative concentration of older adolescents and young adults and, even more so, of the middle aged is more evenly distributed in space. The former are more present in areas of student concentration or areas of deprivation in the western periphery, while the latter—who are relatively missing from these areas—are more present in the first suburban ring and especially in the rather wealthy northeastern and coastal suburbs.
Table 1.1 shows the specific weight of each broad age group and the way it has evolved from 1991 to 2011. It also depicts the ageing of the city’s population.
Table 1.1: Age groups in Attiki (except the islands) and changes between 1991-2011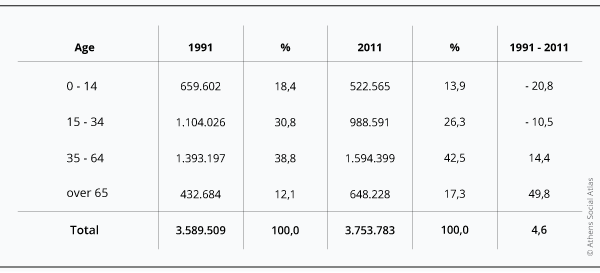
Data source: EKKE-ELSTAT (2015)
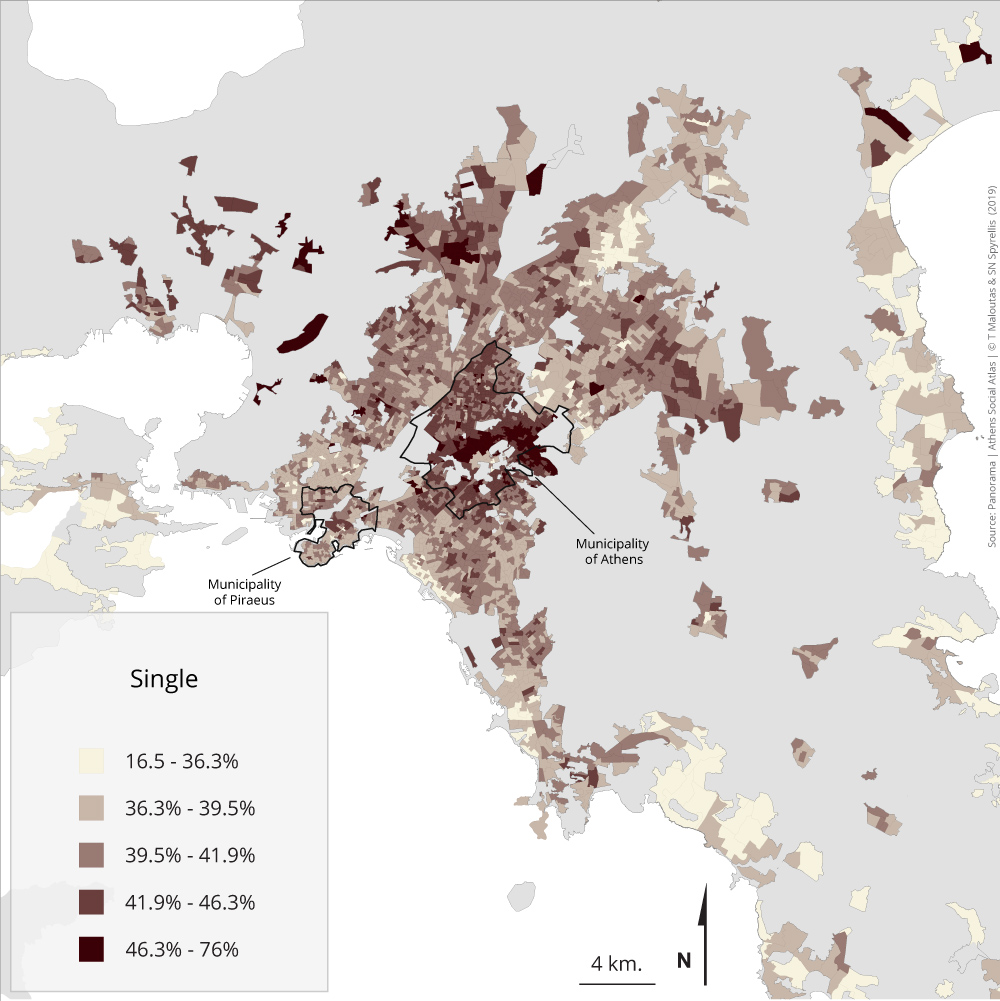
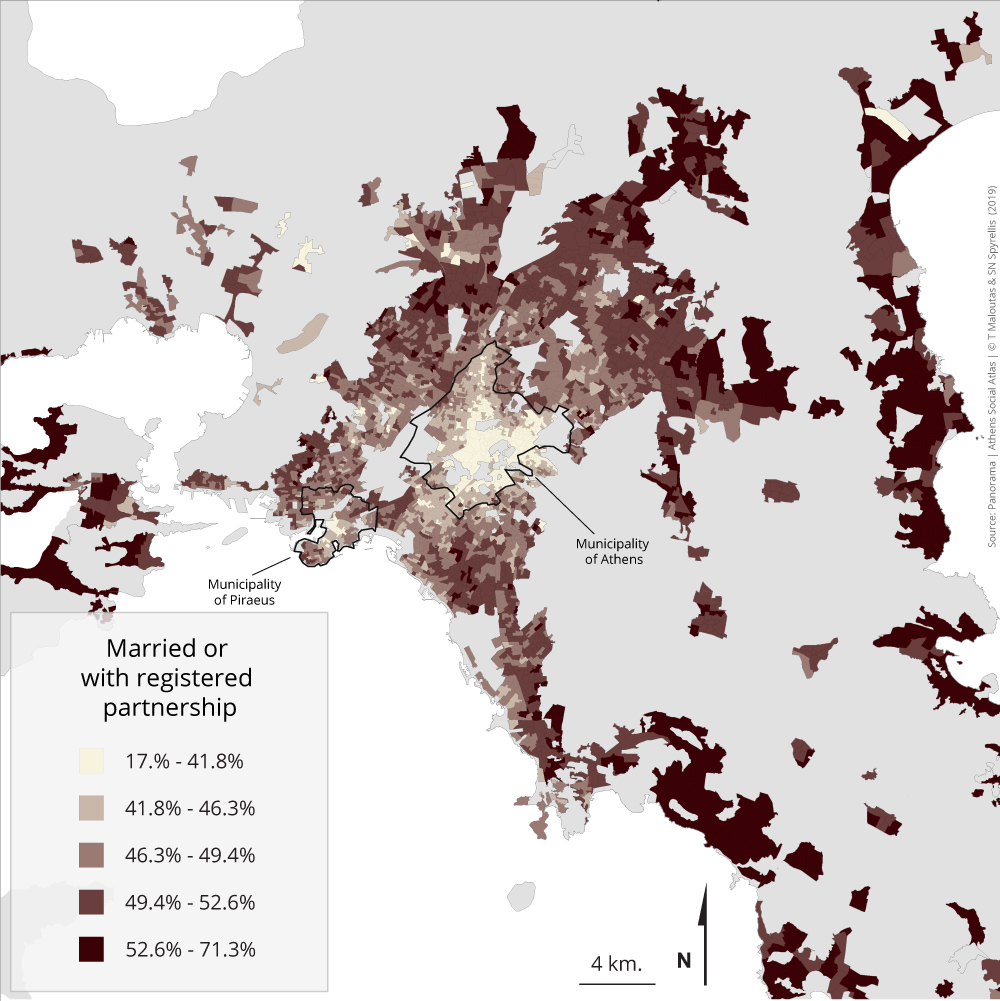
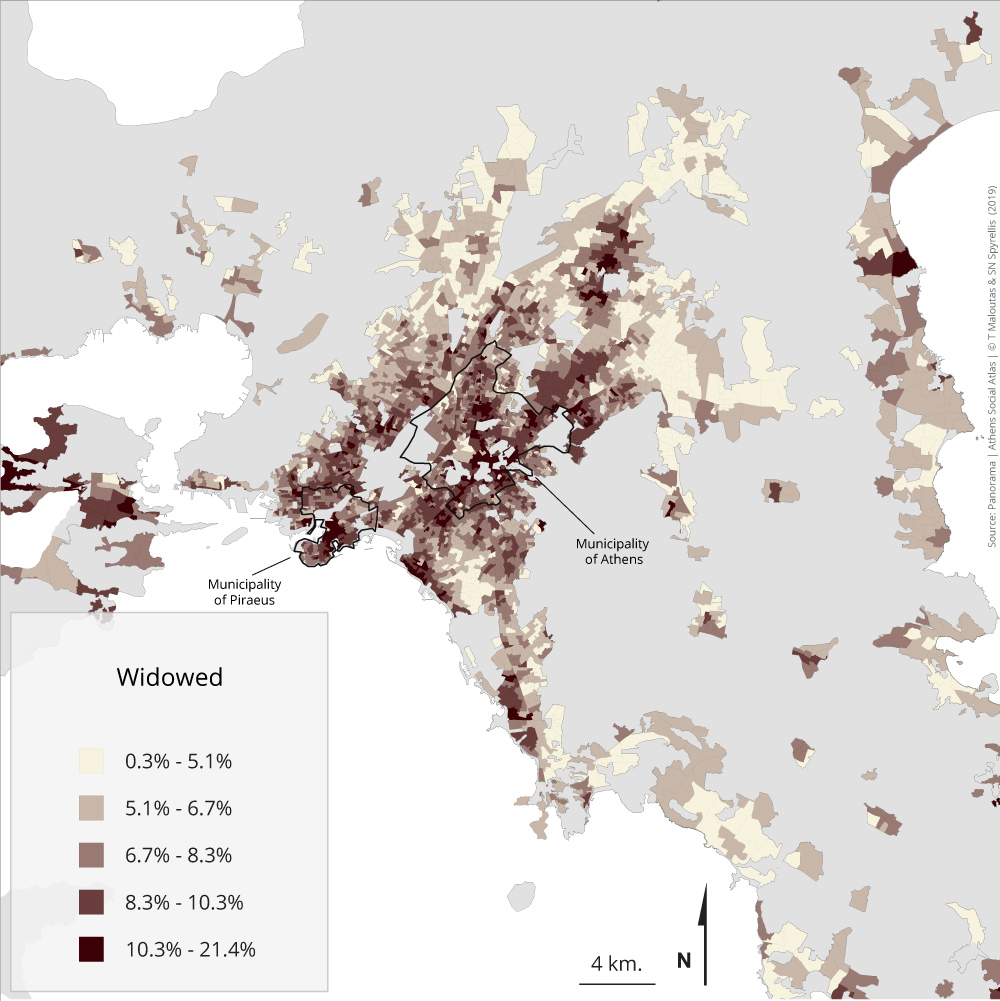
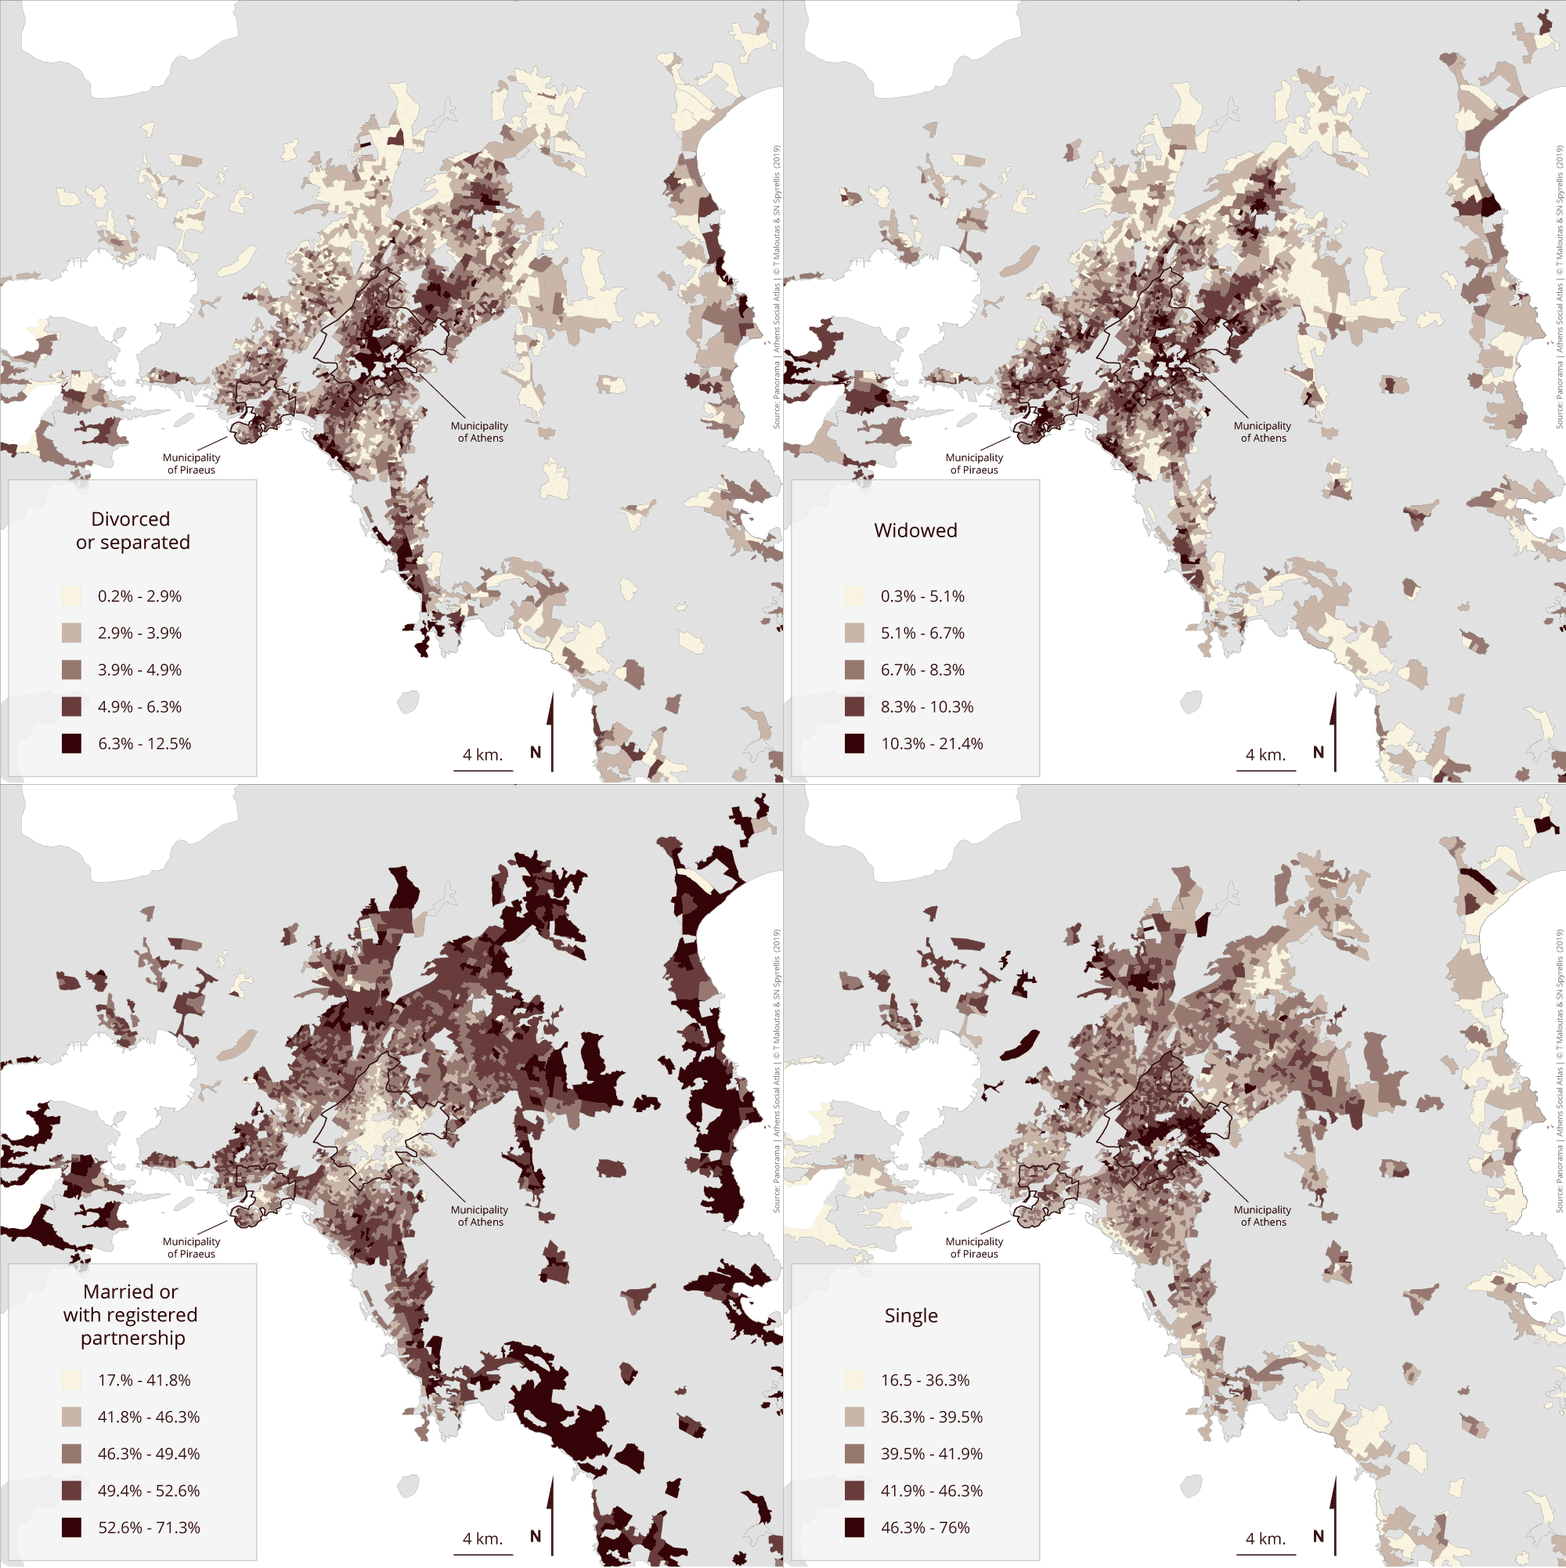
Maps 1.2.1 – 1.2.4: Population distribution by family status and area of residence (2011)
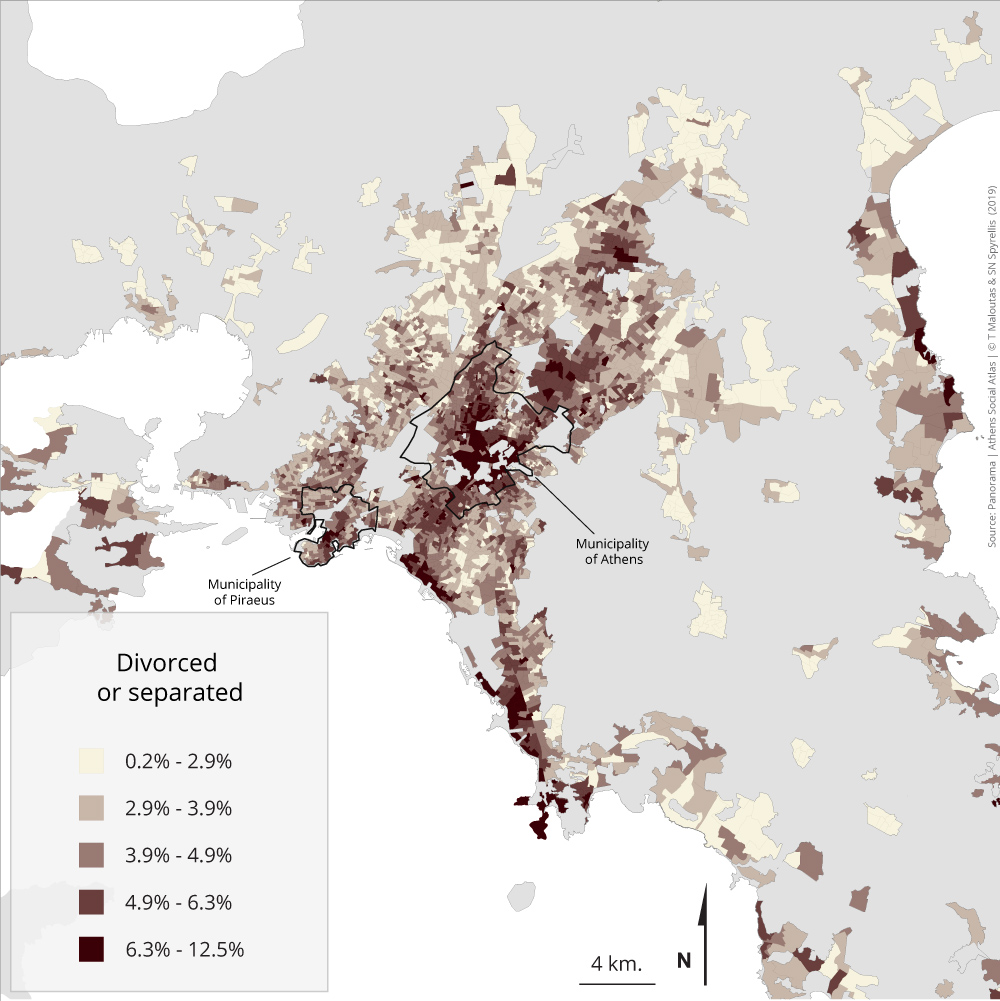
Family status differentiates city space substantially. The single are more present in the city centre—partly related to the increased presence of students—and in some parts of the periphery (municipalities of Aspropyrgos, Zafyri, Marathonas, Kato Souli) where large concentrations of young males from specific ethnic groups are observed (Pakistan, India). Married and cohabiting couples, on the contrary, are more concentrated in areas outside the centre and in increasing rate as the distance from the centre increases. Widows and widowers are situated closer to the centre, something compatible with their older age. Those separated live also closer to the centre due to better conditions provided by central neighbourhoods to those living alone. Finally, the divorced are located closer to the residential areas of higher and intermediate social groups because divorce—a practice much more limited in Greece than in most other Europeans countries—is unevenly practiced by different social groups. Higher socio-economic categories follow much less traditional practices and behaviours.
Table 1.2 shows that the percentage of the single, widows and widowers and the divorced is increasing, while that of the married or partners is decreasing. This trend is compatible with population ageing , the belated formation of new nuclear family households (decrease of married/partners) and the easier termination of marriages (increased of divorcees) due to the greater financial autonomy of both parts and the gradual decline of traditional values and practices.
Table 1.2: Distribution of the 20+ year olds in the region of Attiki (except the islands) by family status and area of residence 1991-2011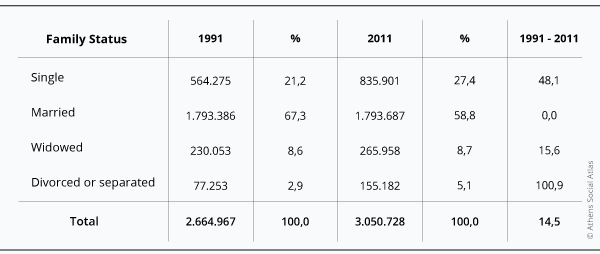
* those in temporary separation included
Data source: EKKE-ELSTAT (2015)
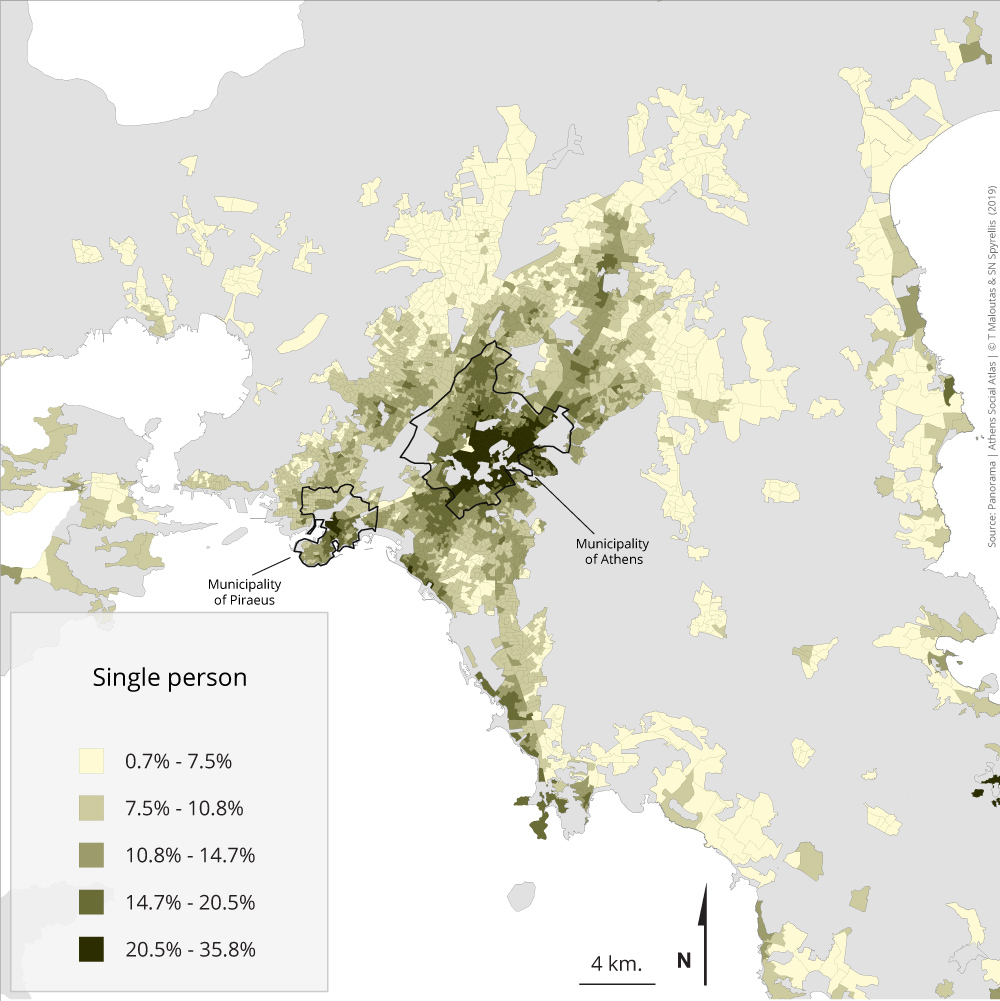
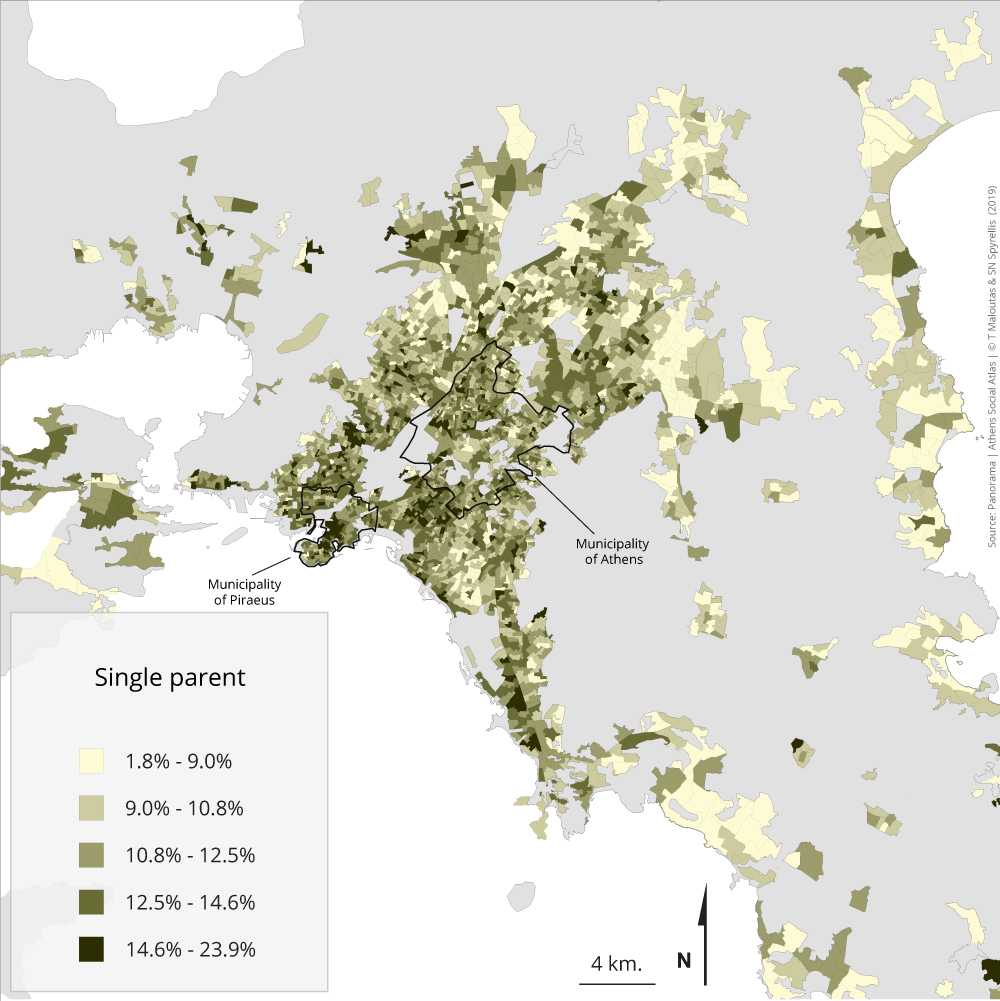
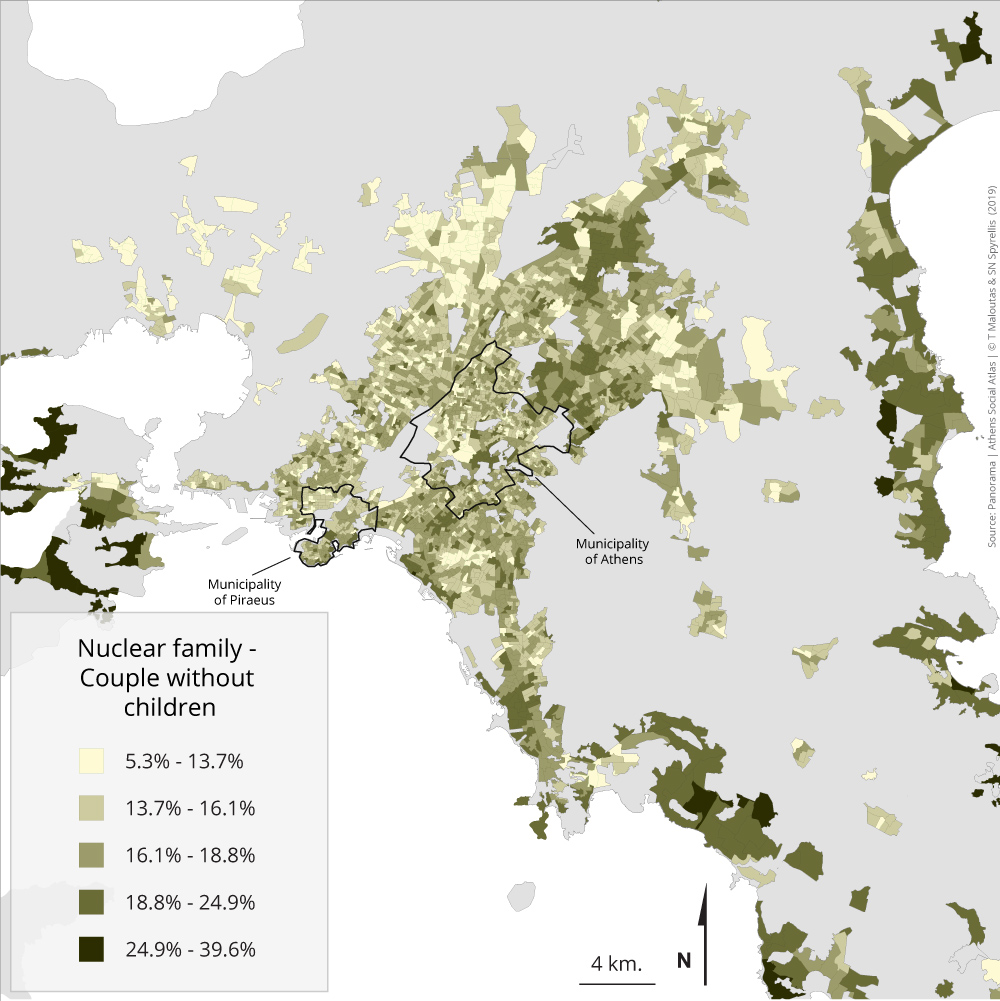
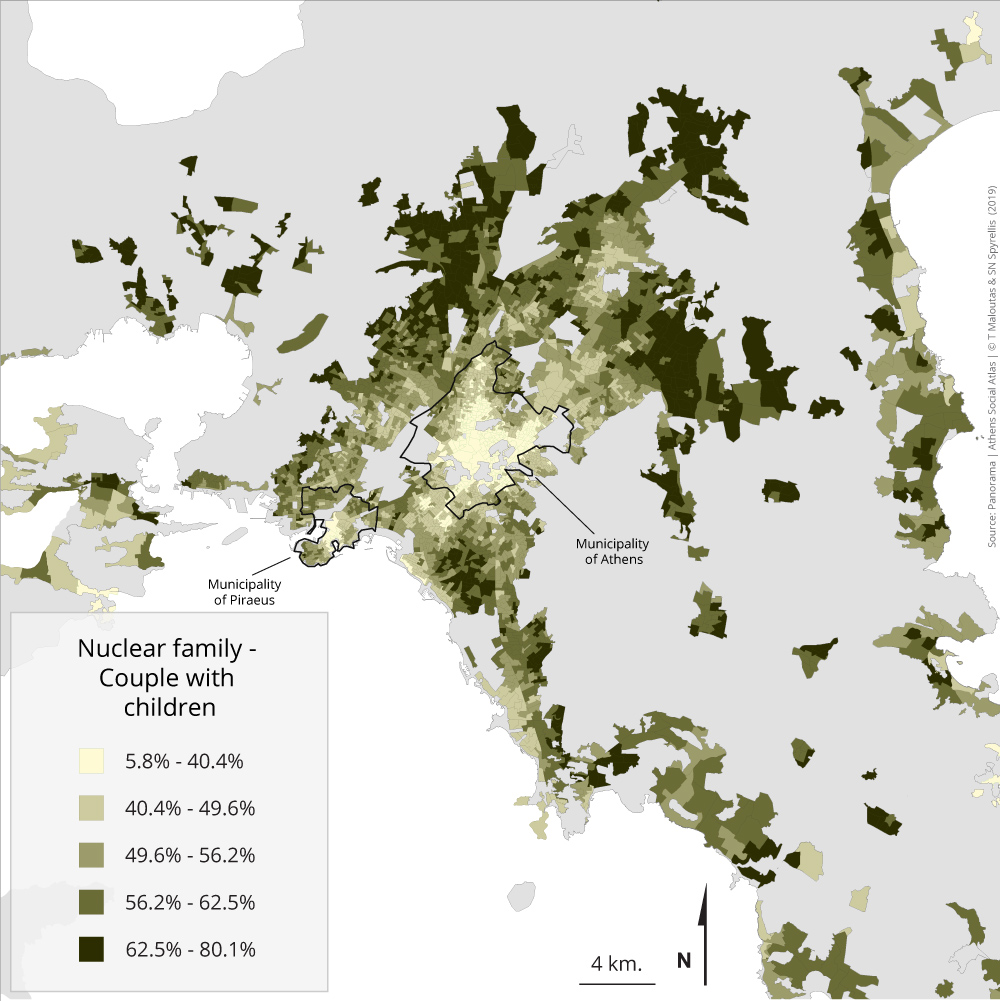
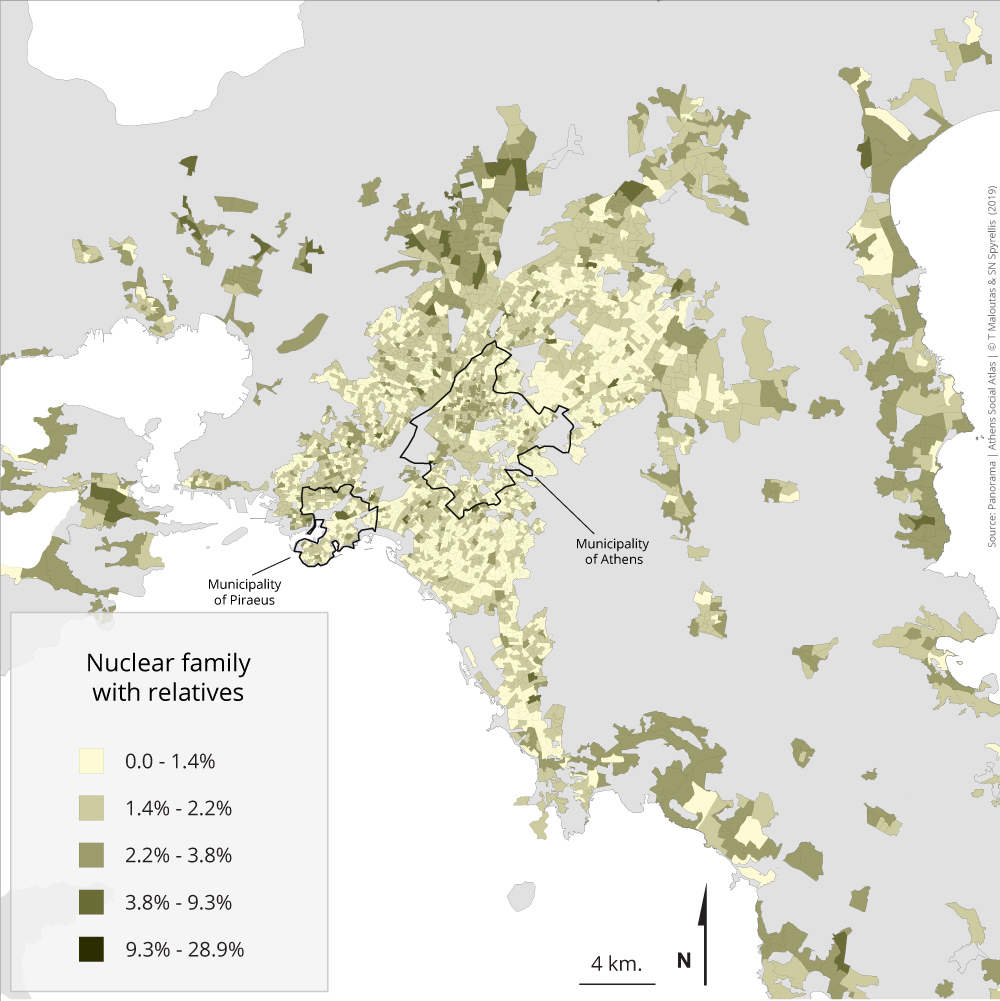
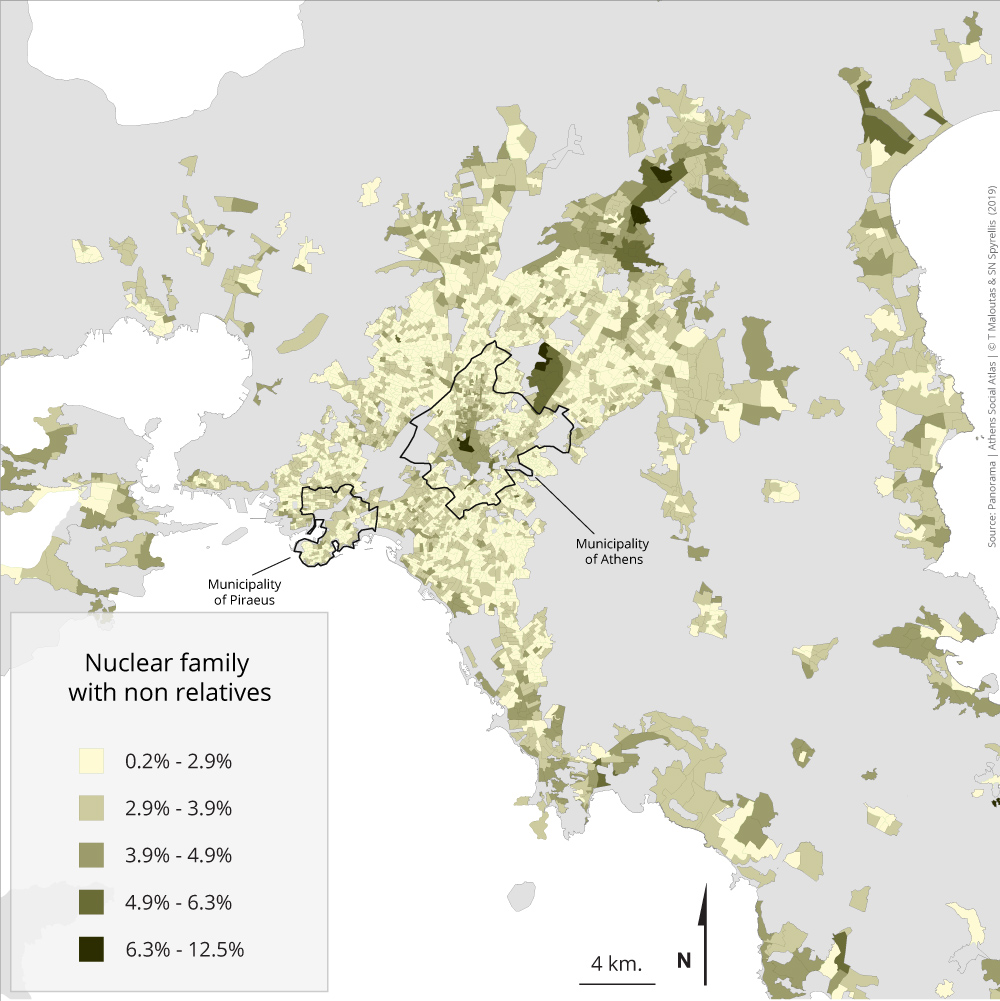
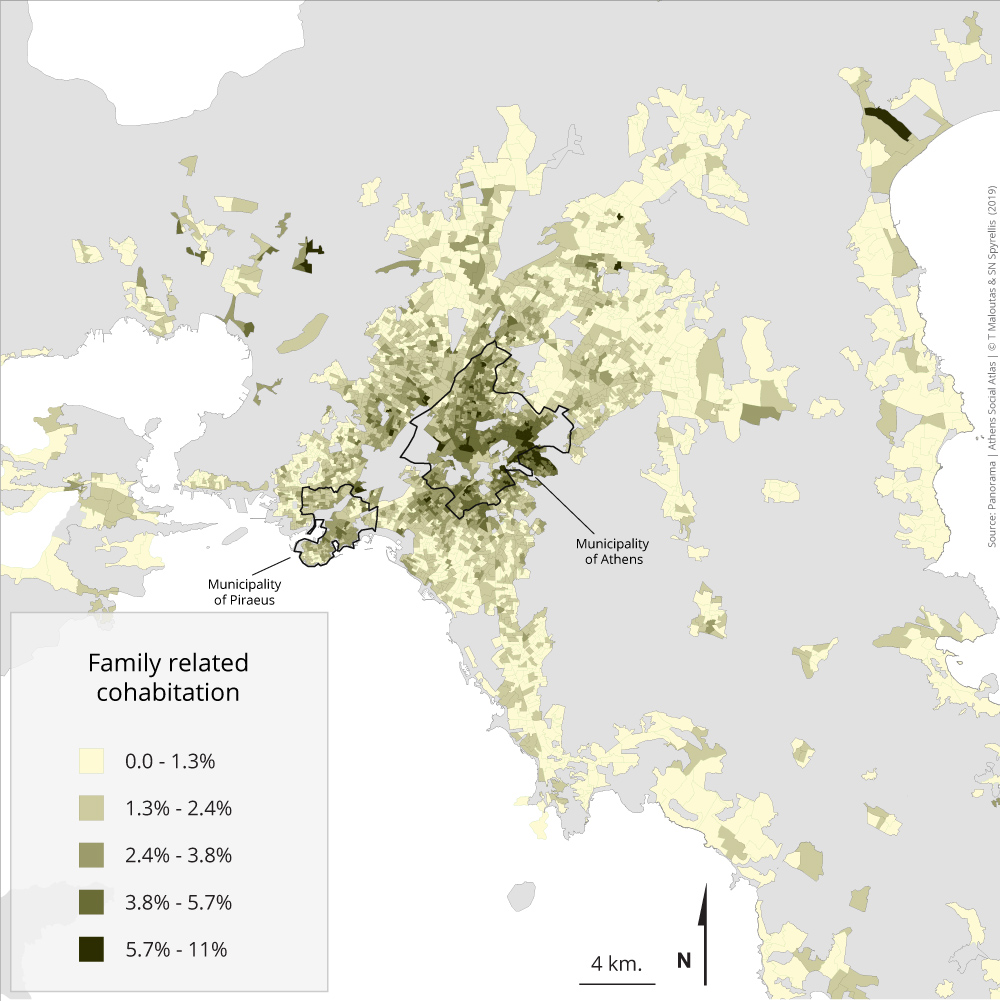
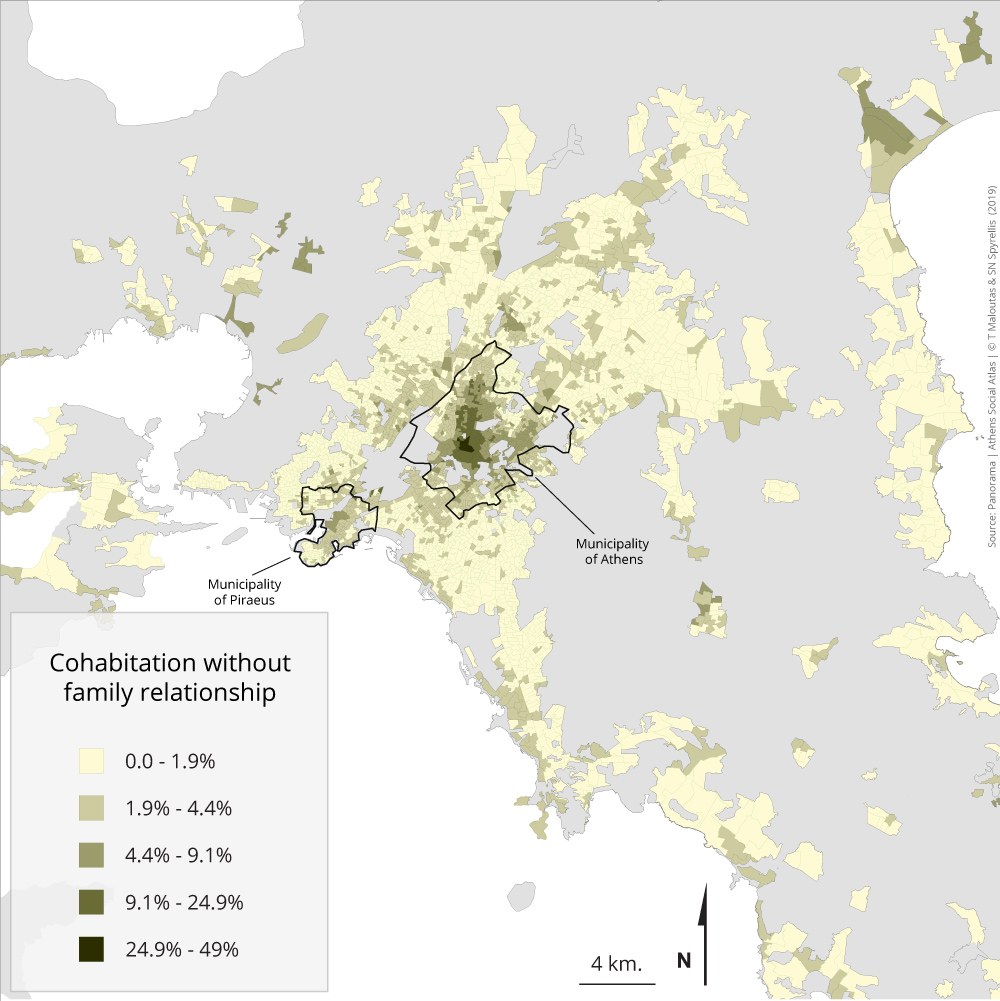
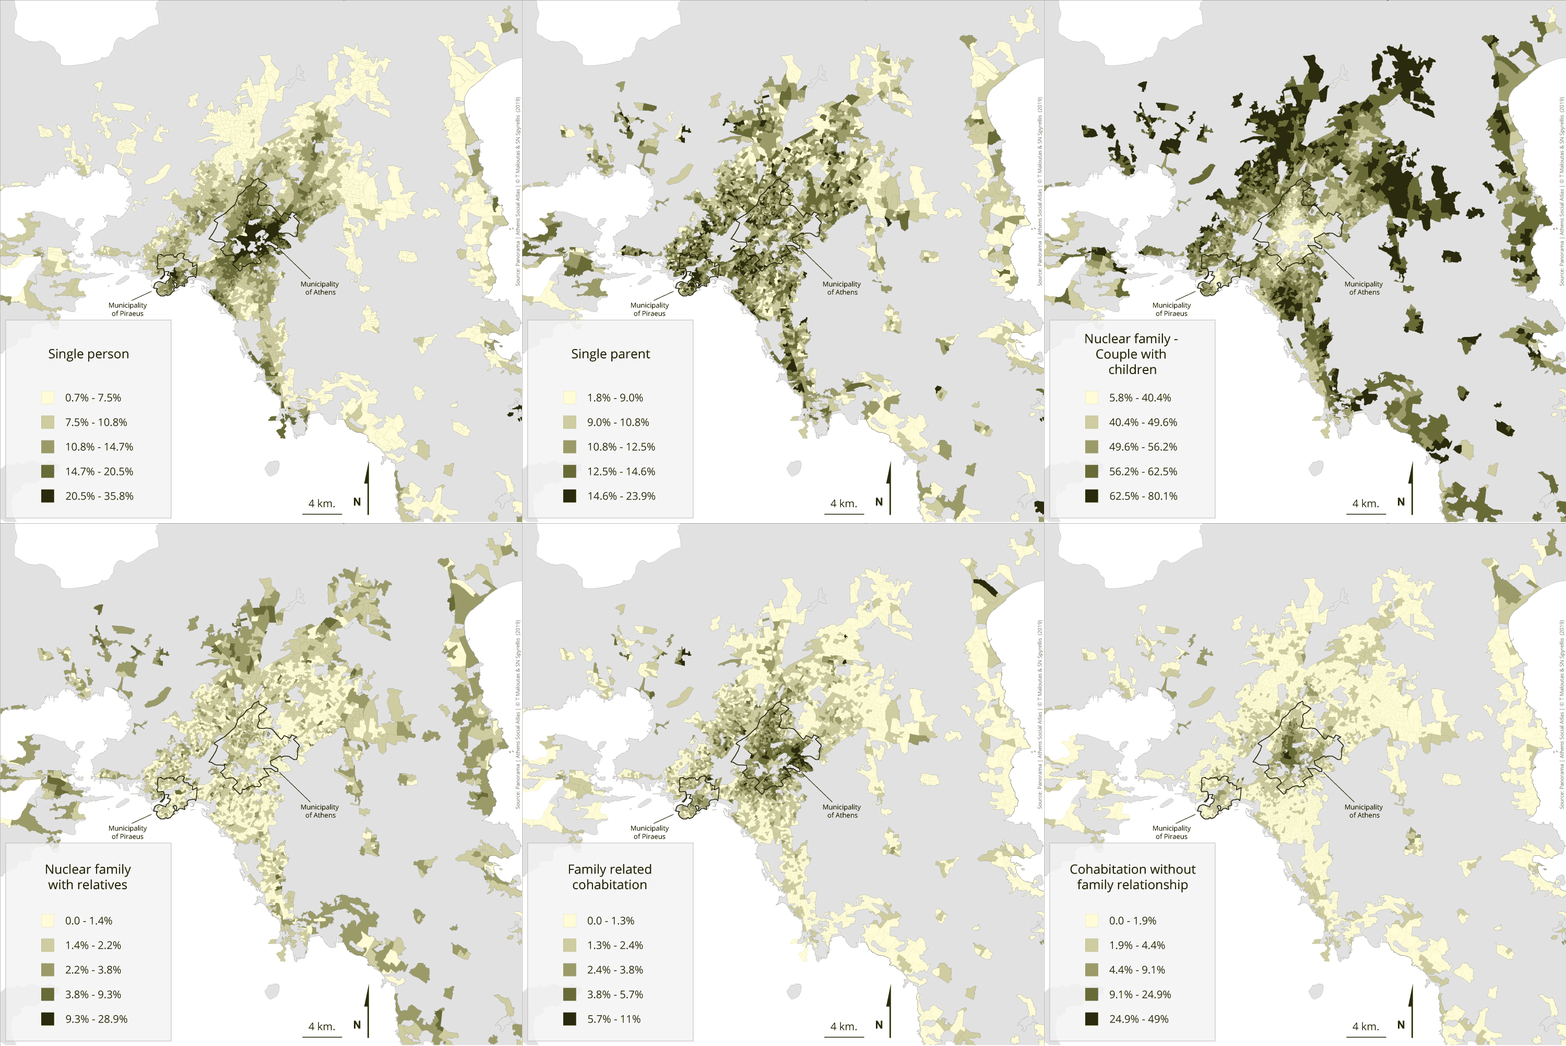
Maps 1.3.1 – 1.3.8: Distribution of population by type of household and area of residence (2011)
The different types of household that structure urban society are unevenly distributed throughout the space of the city, as shown by the maps comprising this section. Single person households have a clear spatial pattern with an intense concentration in the centres of Athens and Piraeus; nuclear families are more concentrated in new and distant suburbs; those who live together without being partners or related by kin are more present close to the centre and nuclear families who cohabit with someone not kin-related (usually live-in help) are mainly located in the areas where higher social groups are concentrated.
Table 1.3 reveals the specific population weight of the different types of household.
Table 1.3: Distribution of the population of region of Attiki (except the islands) by type of household and area of residence 2011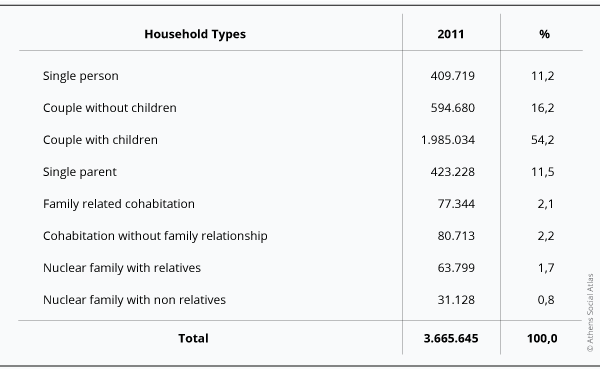
Data source: EKKE-ELSTAT (2015)
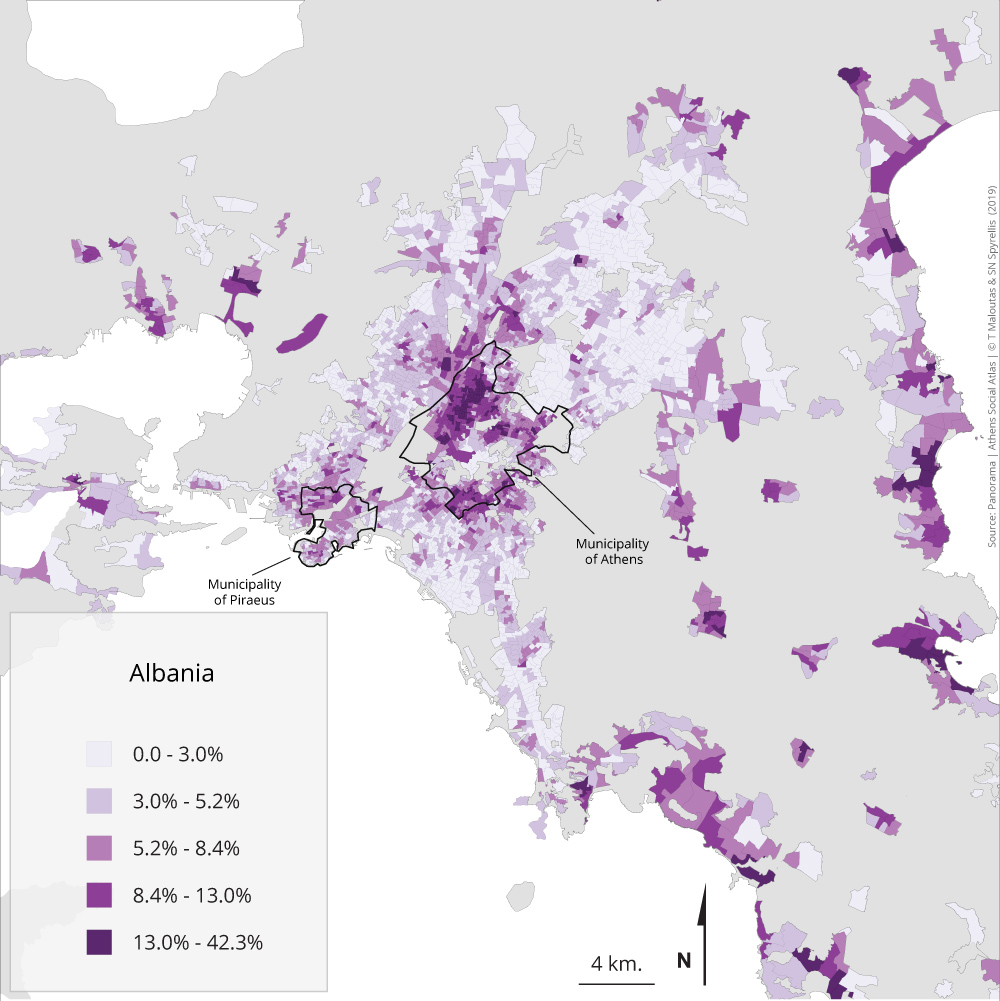
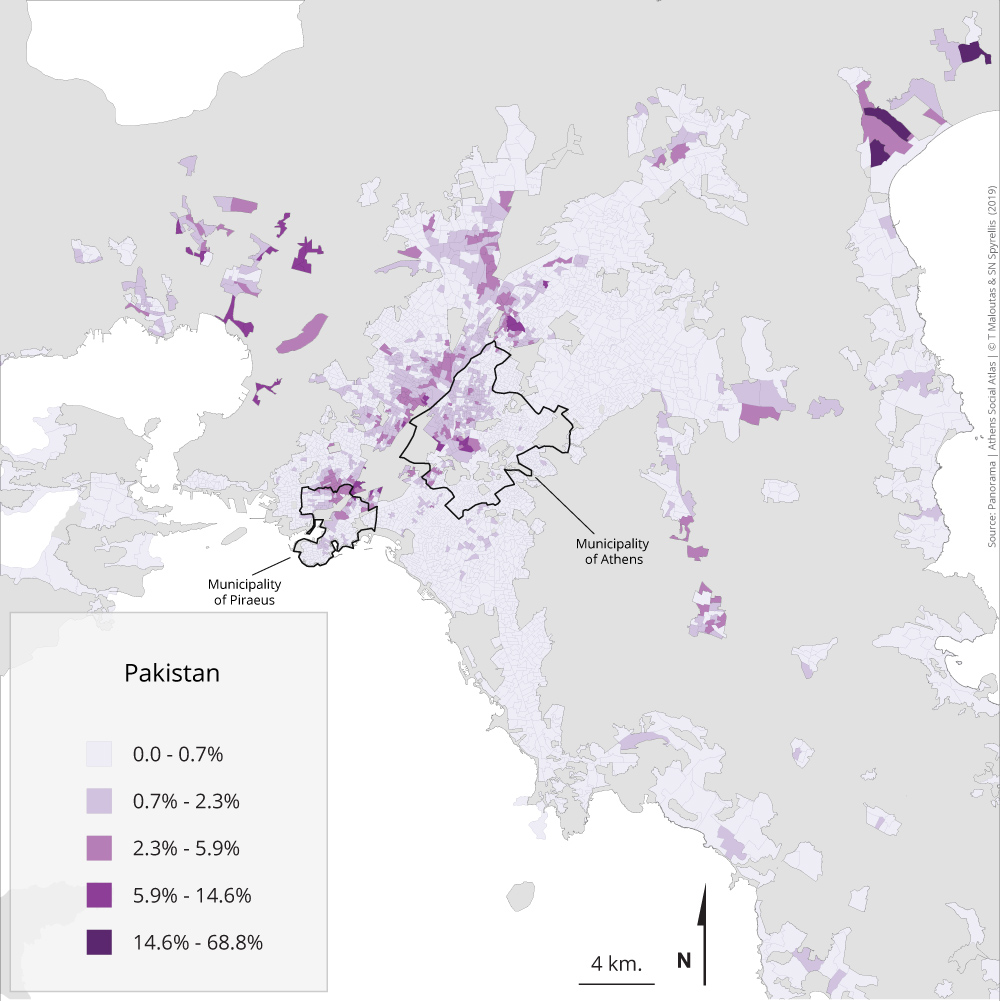
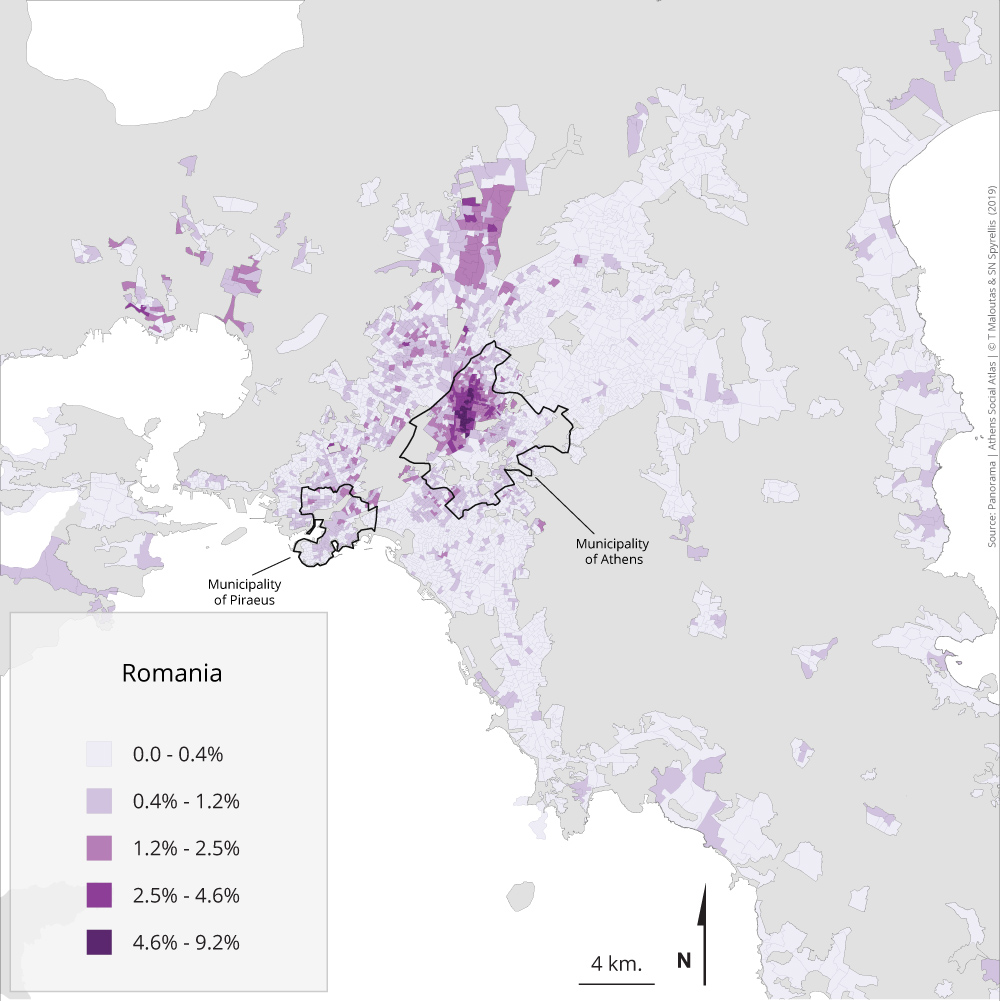
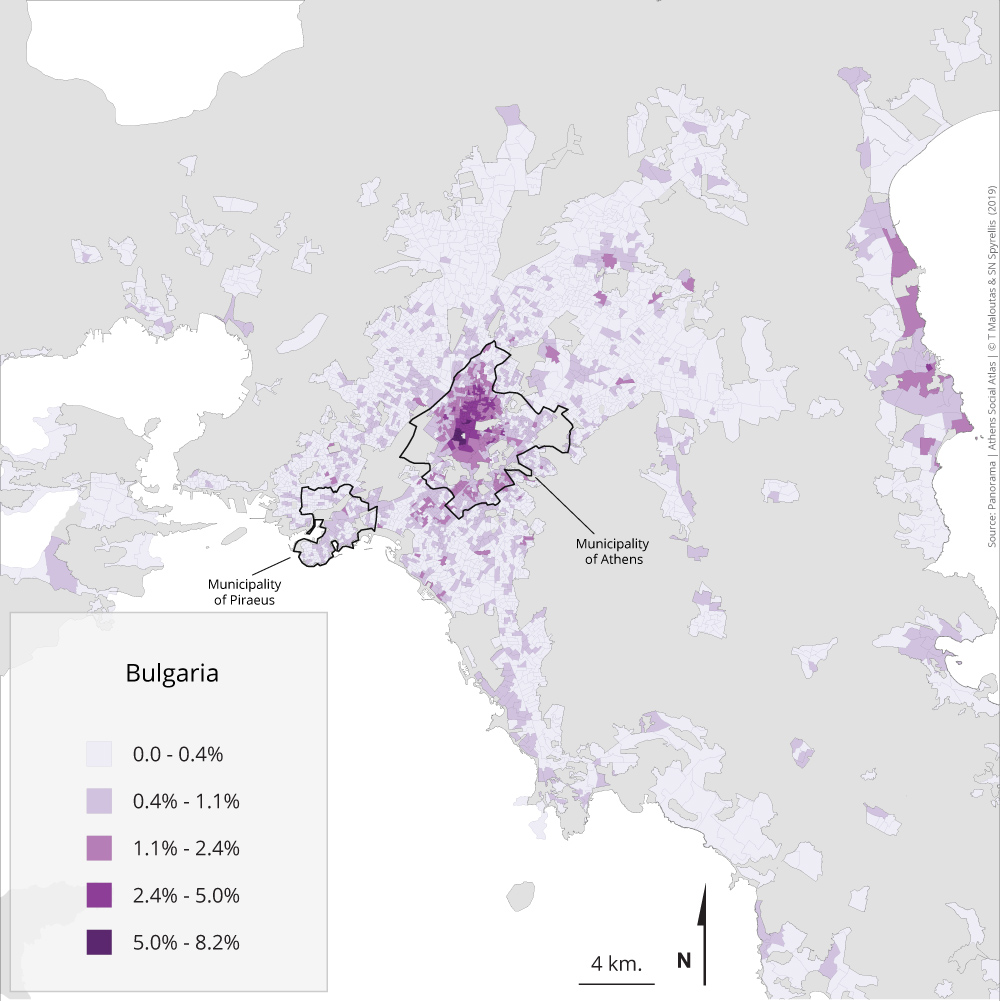
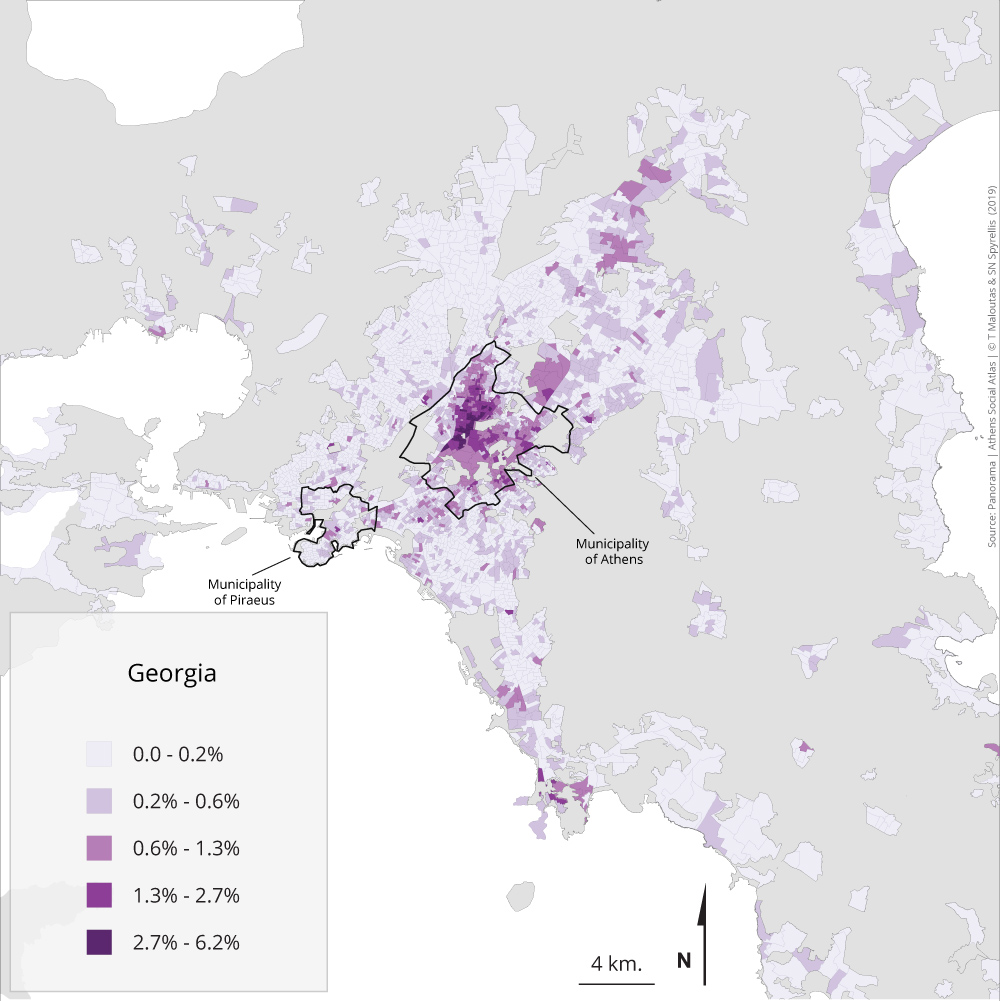
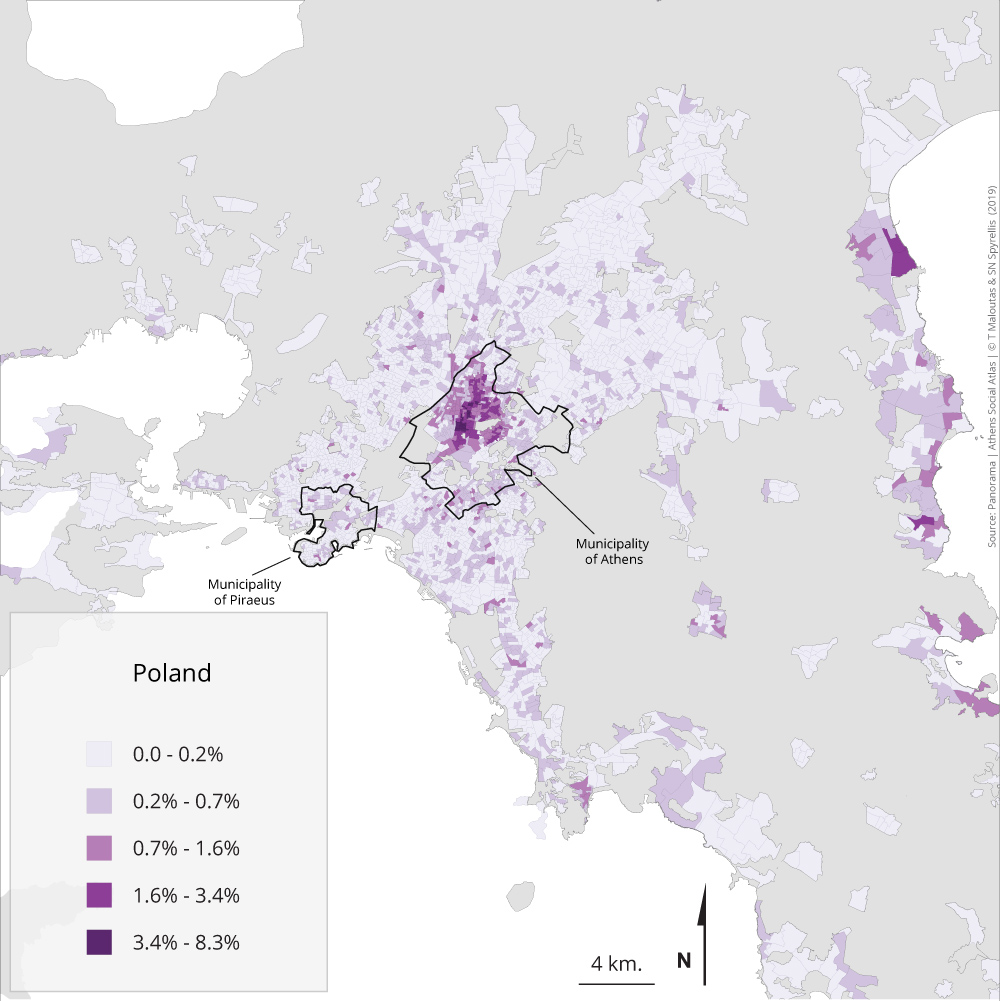
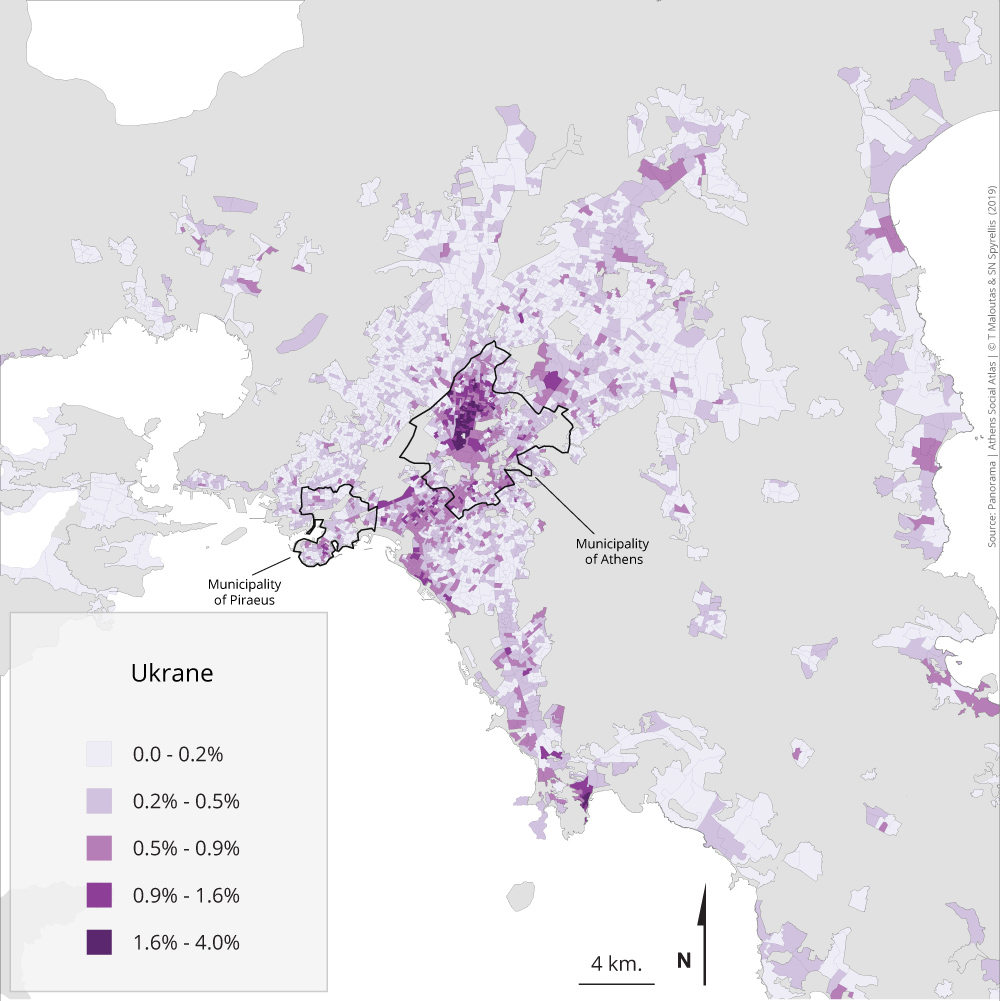
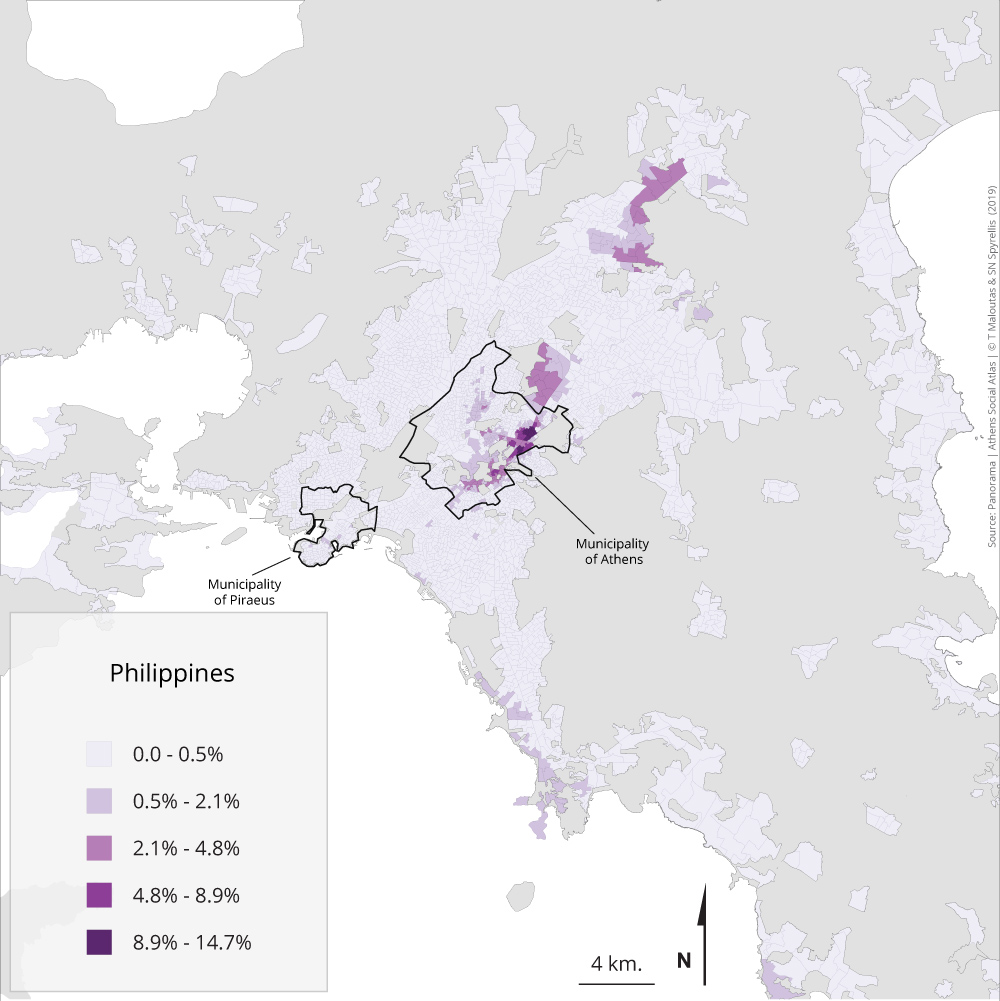
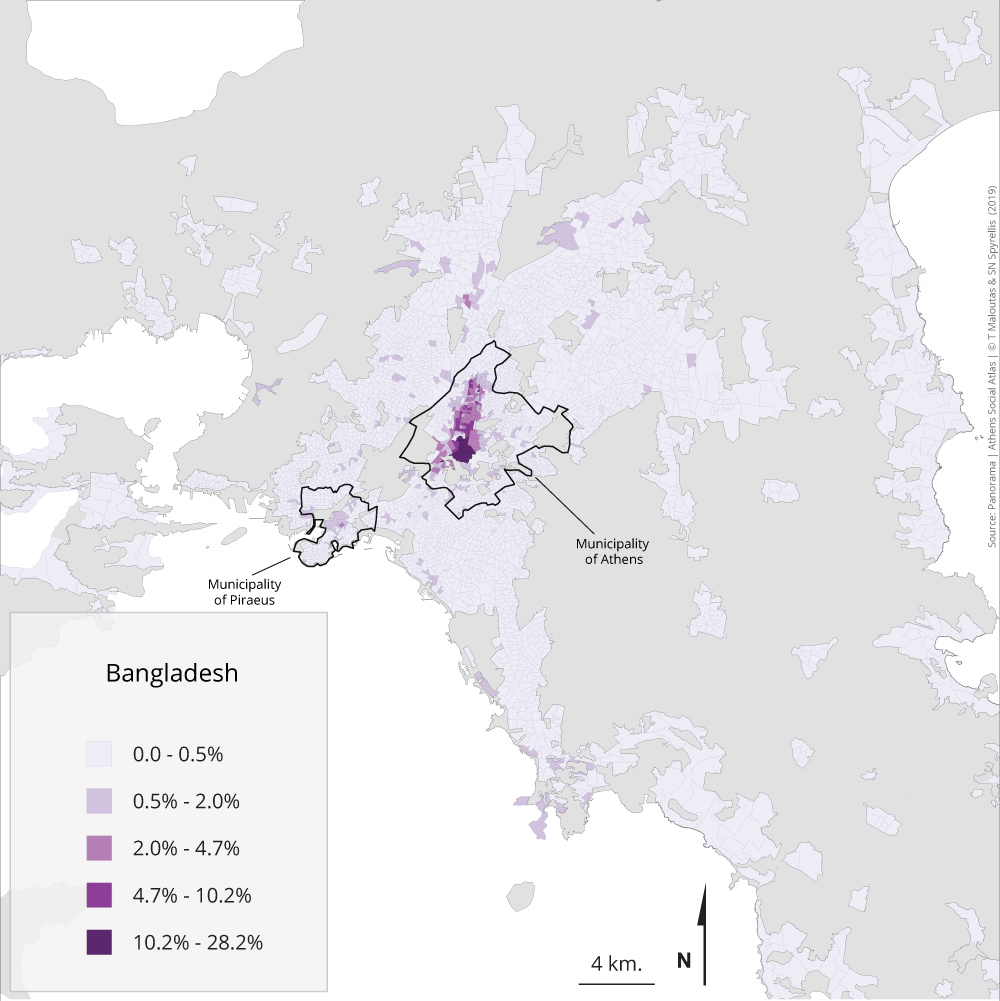
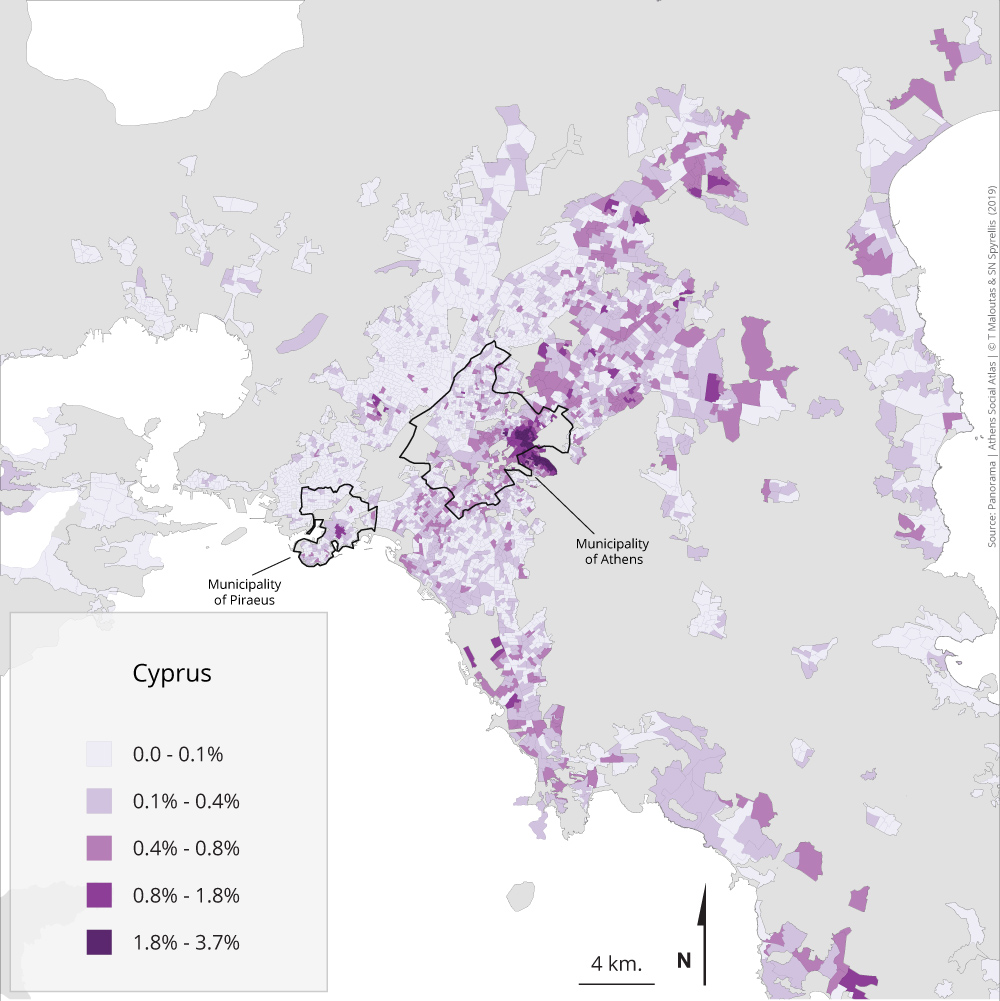
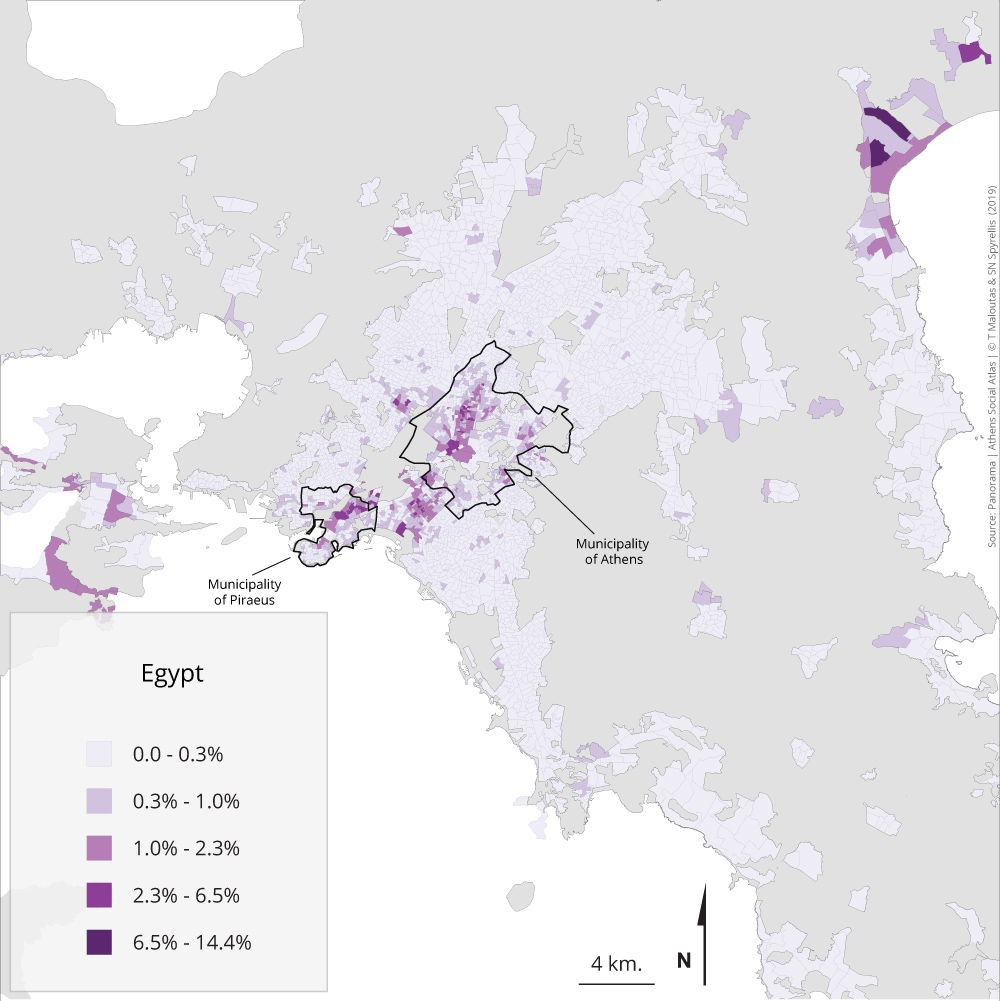
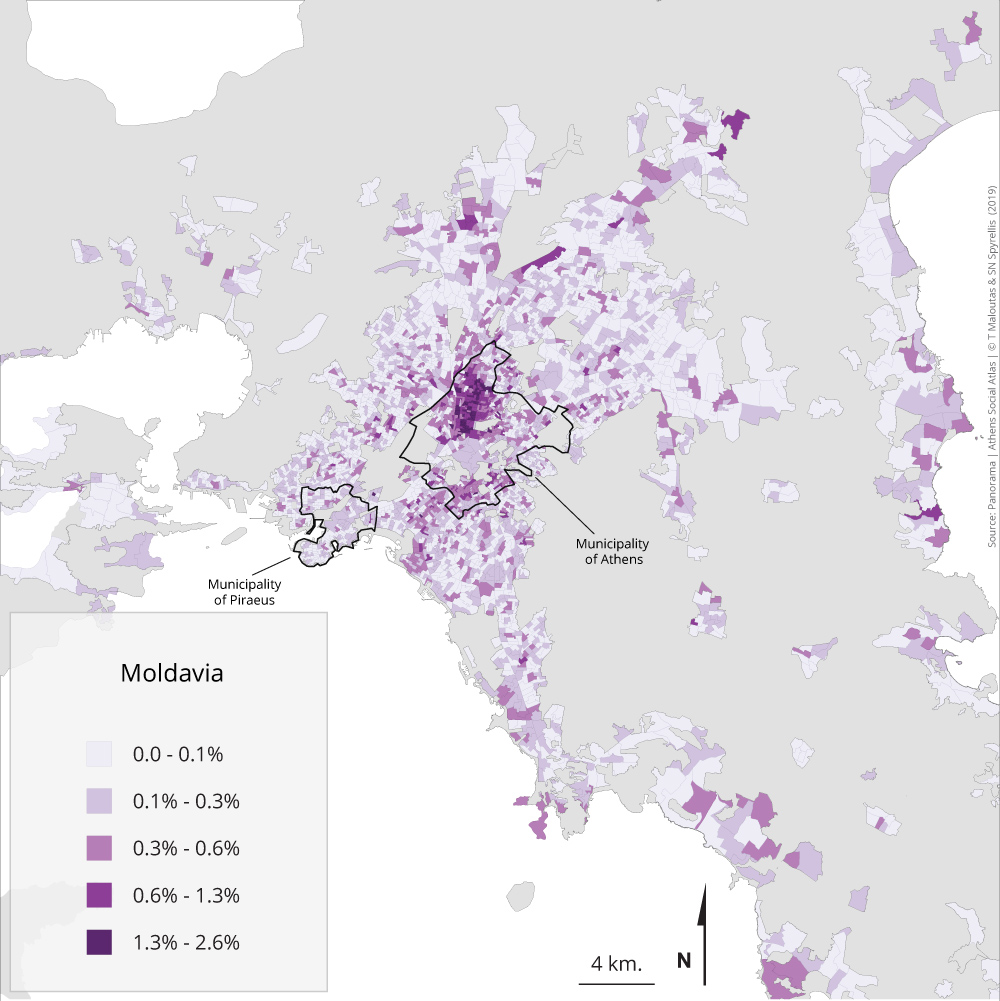
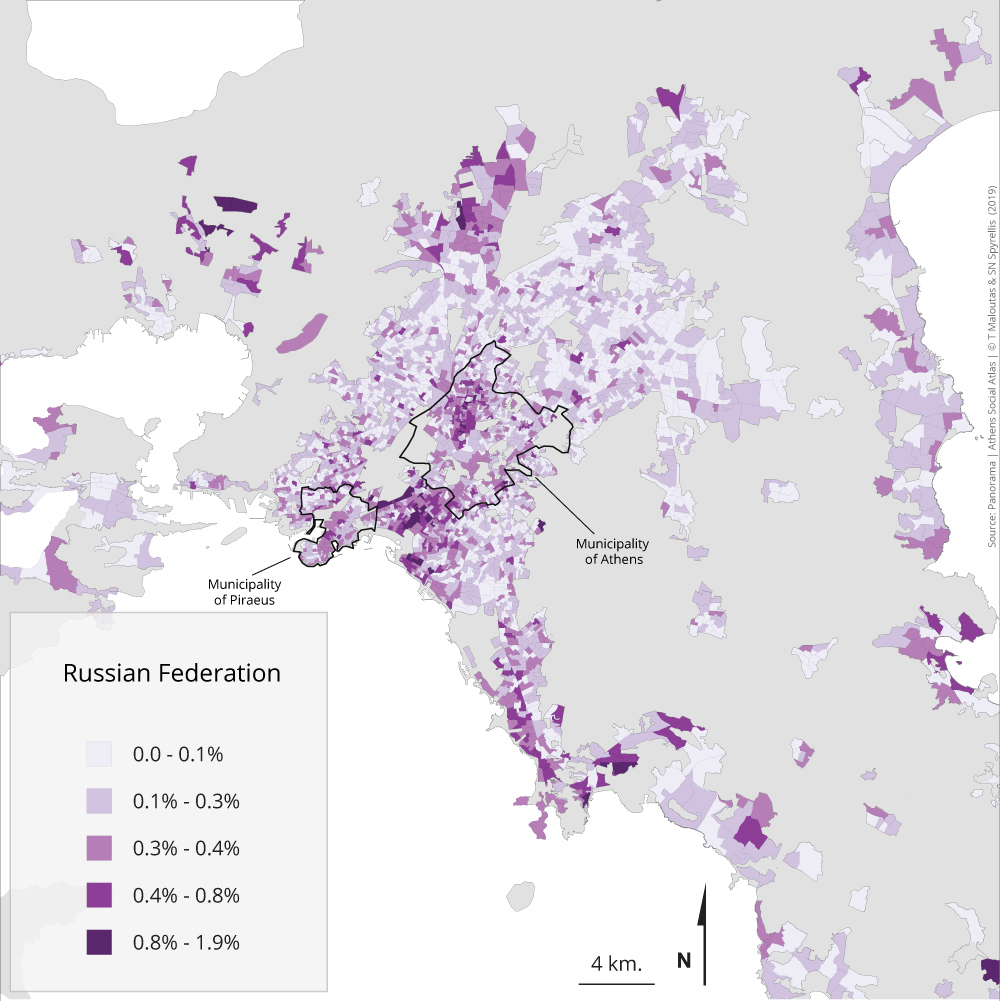
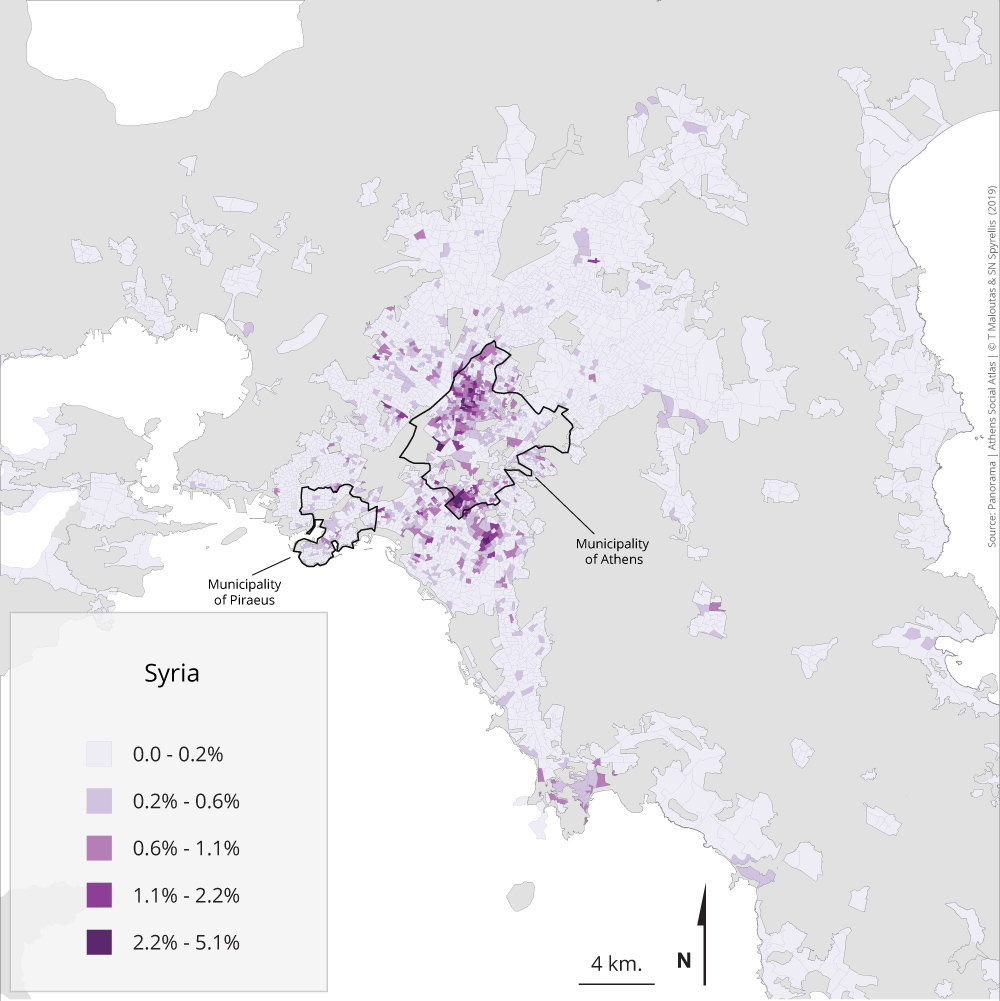
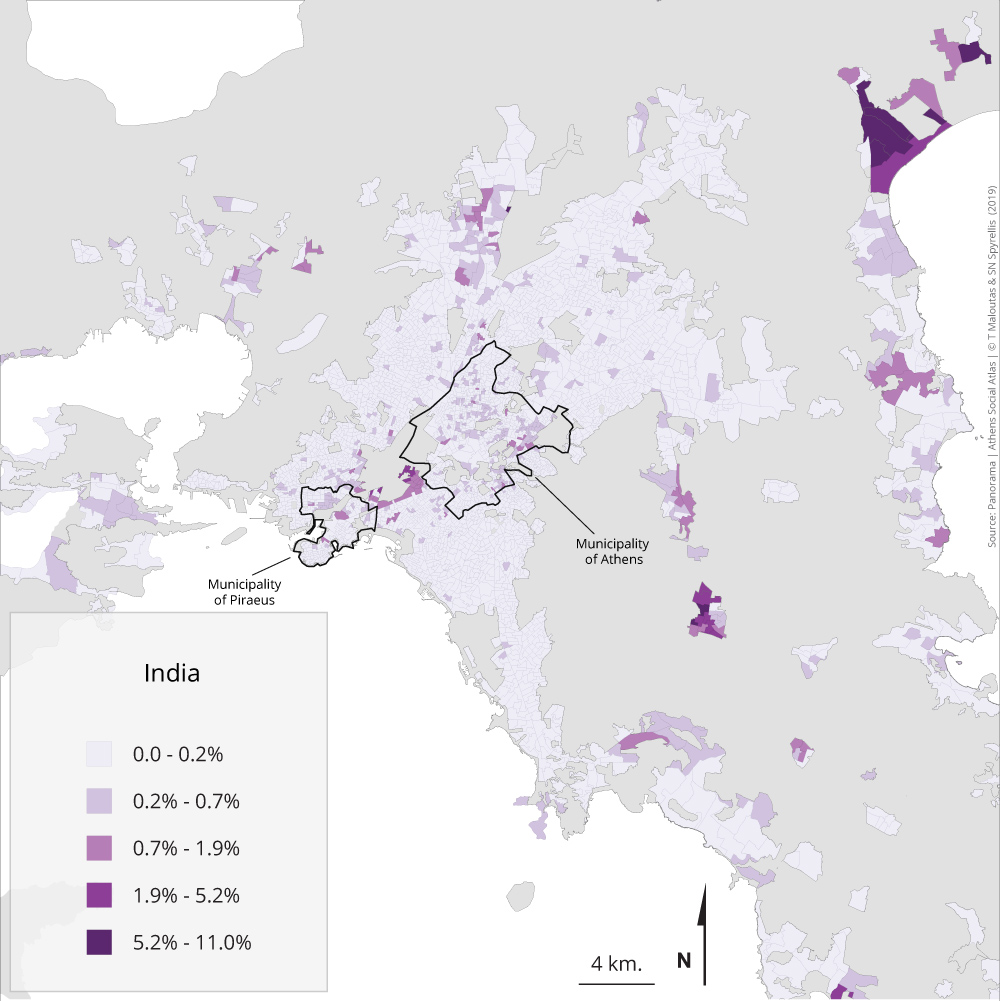
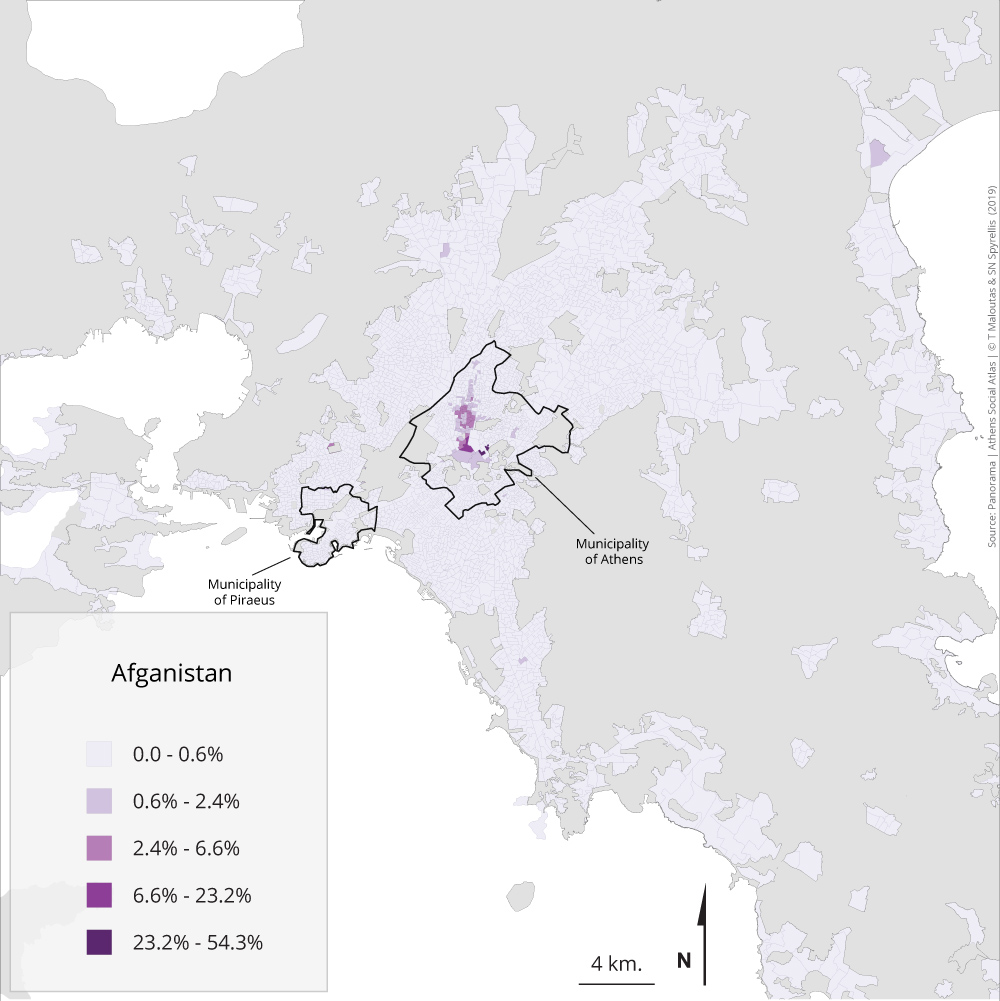
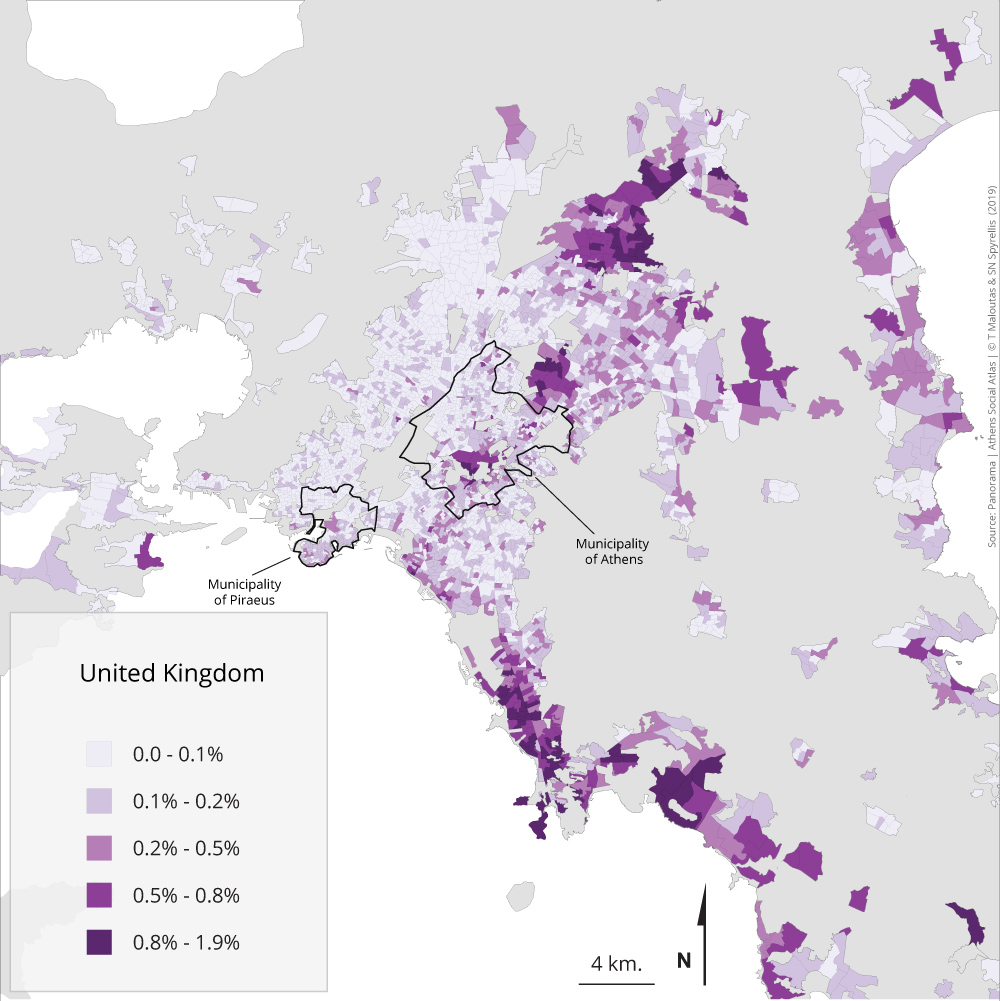
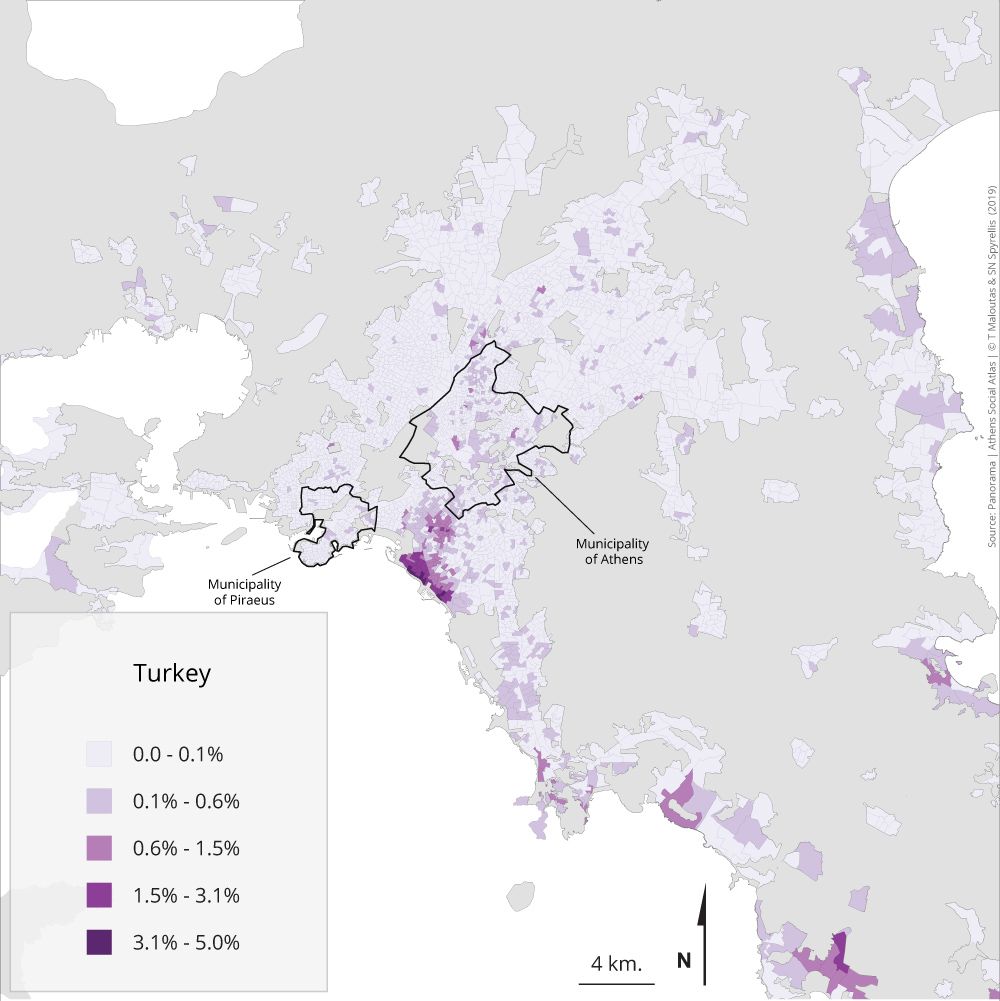
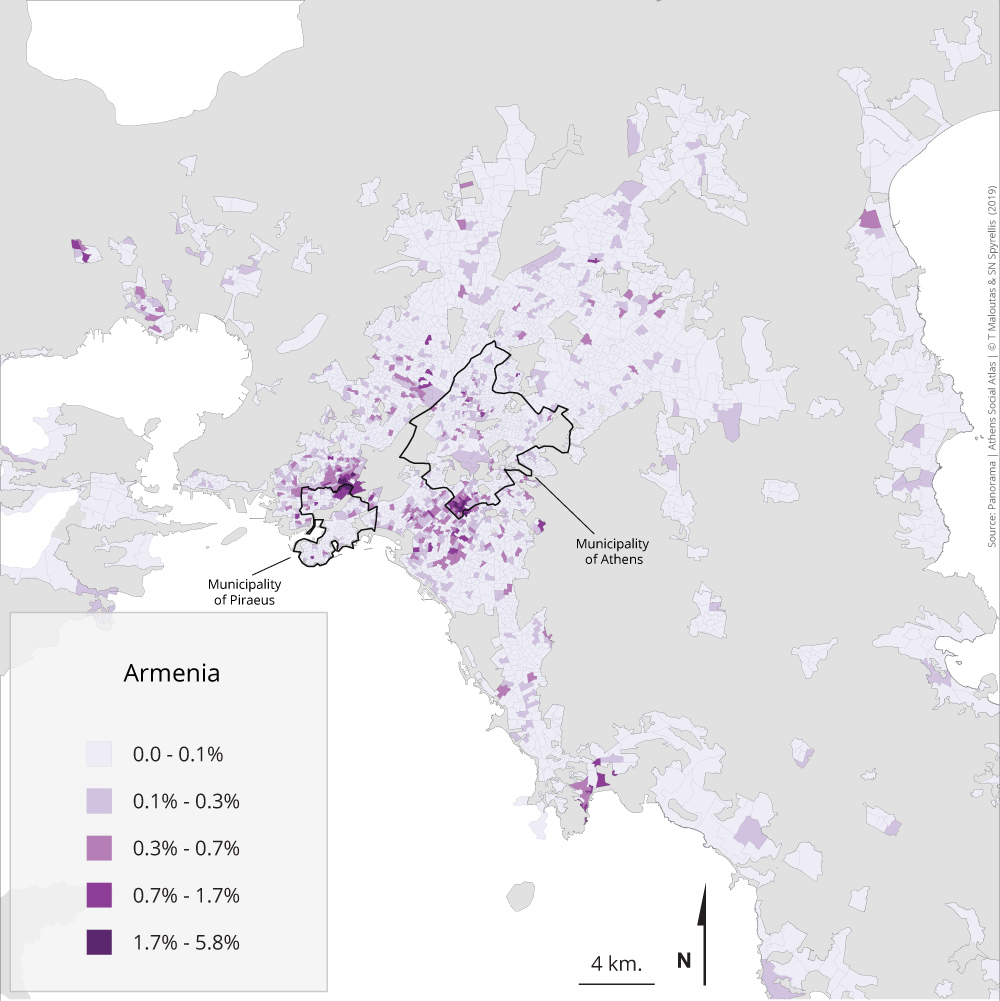
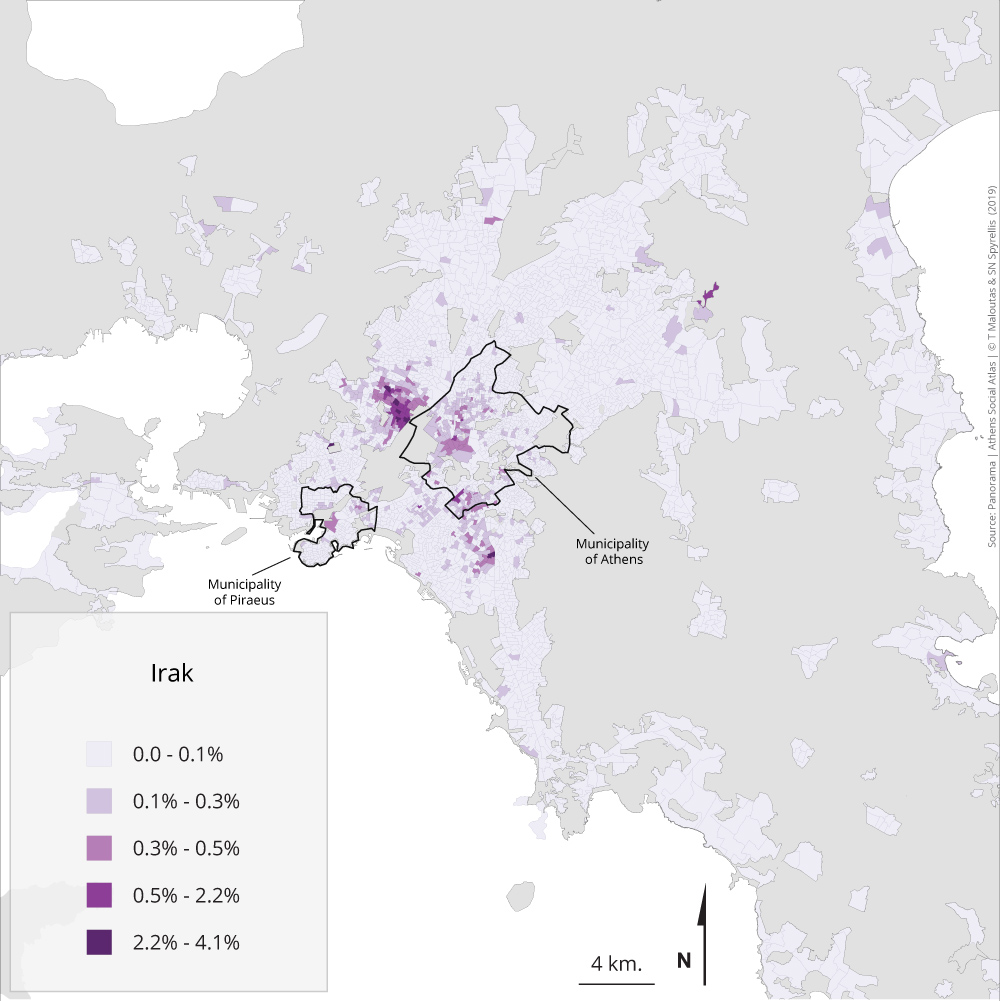
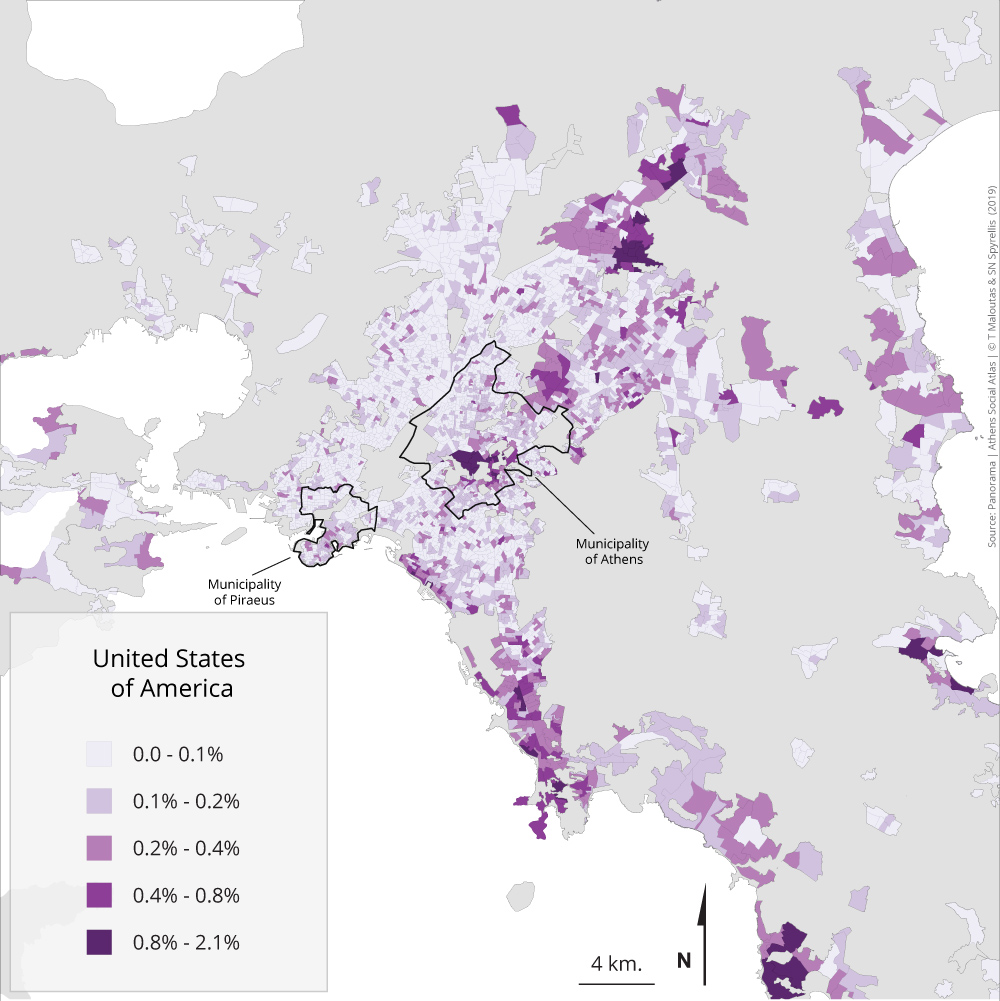
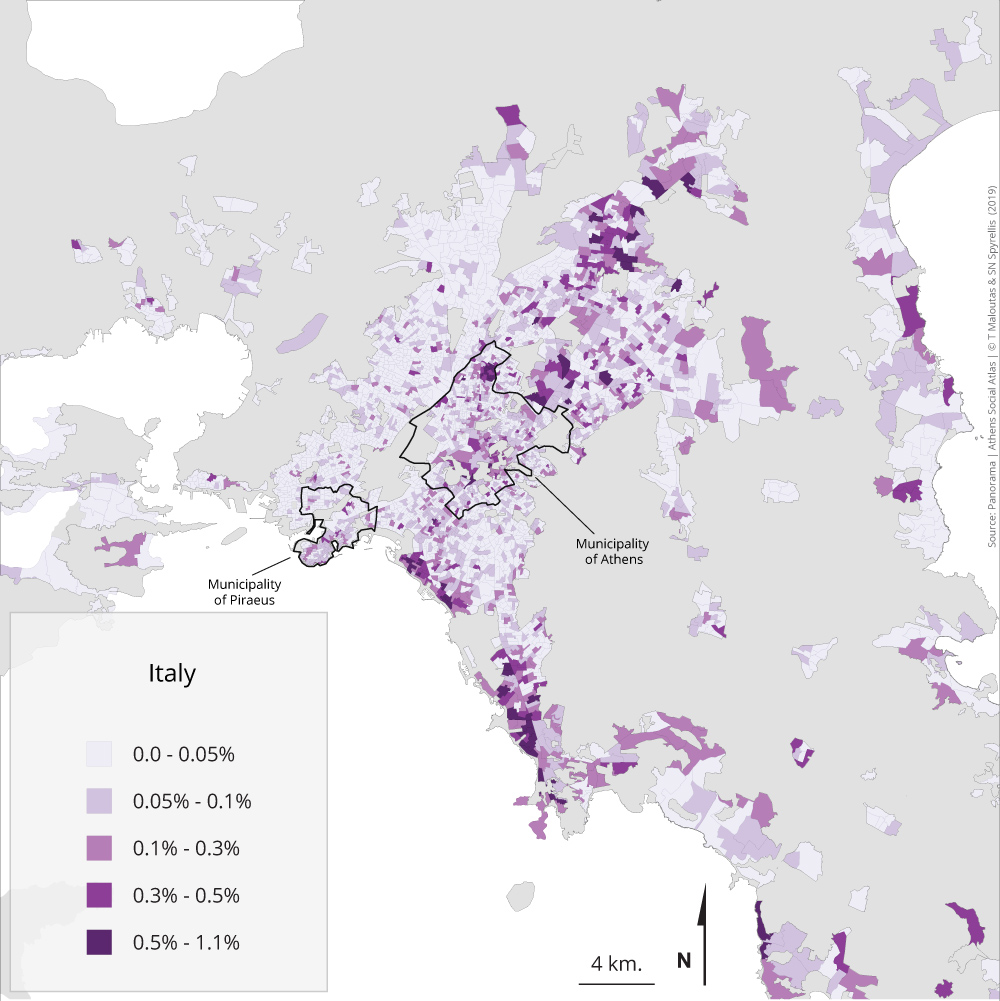
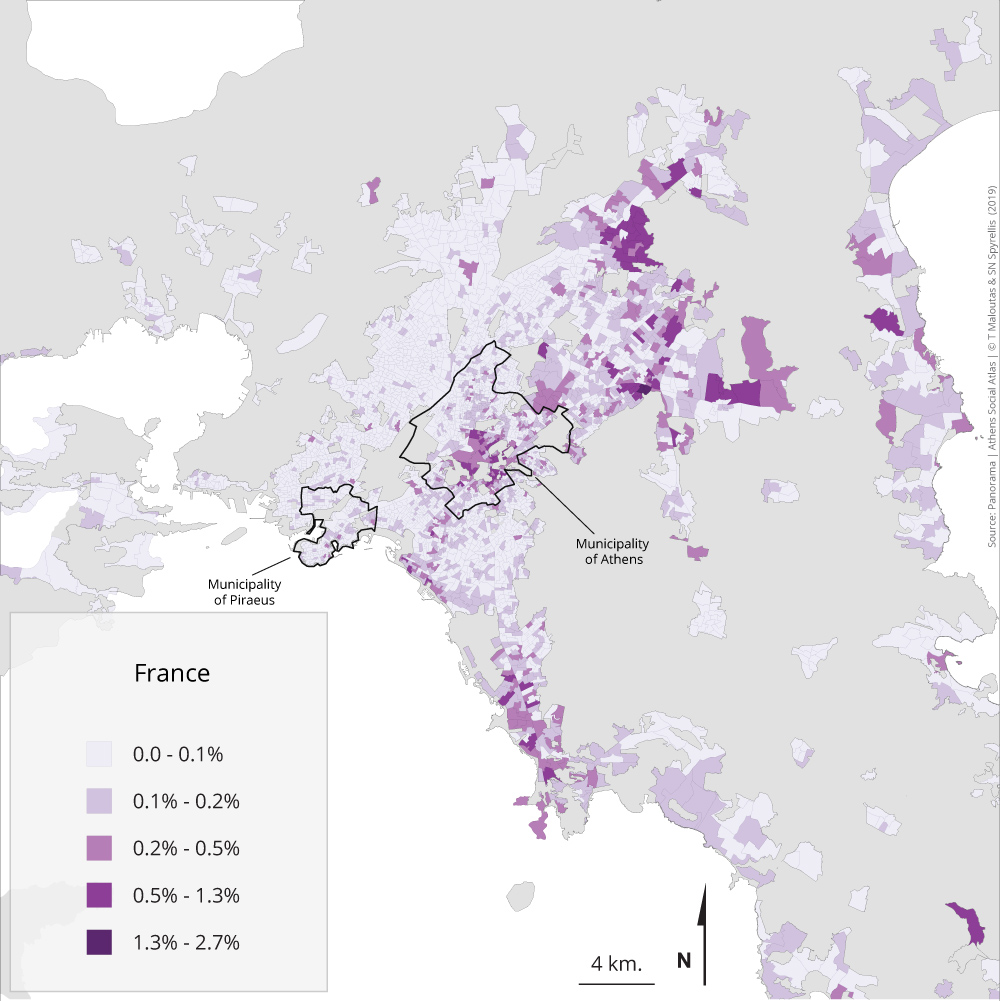
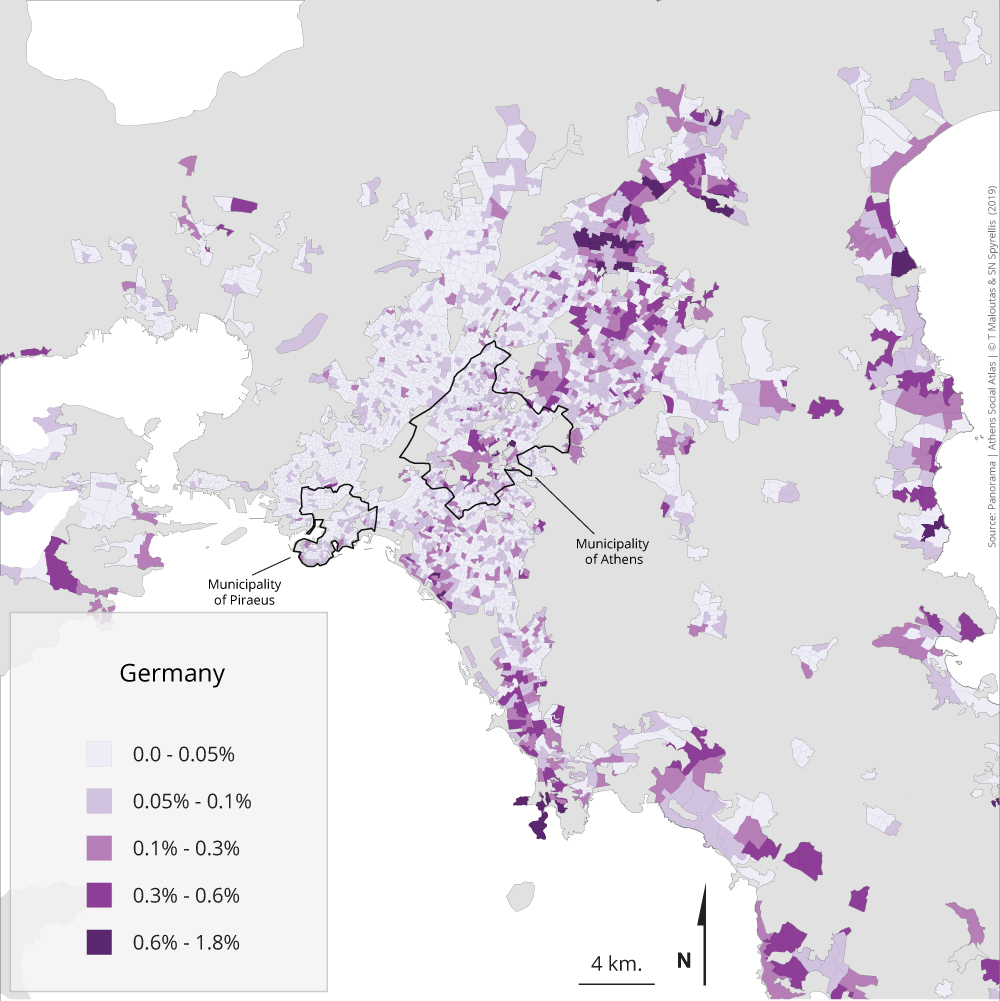
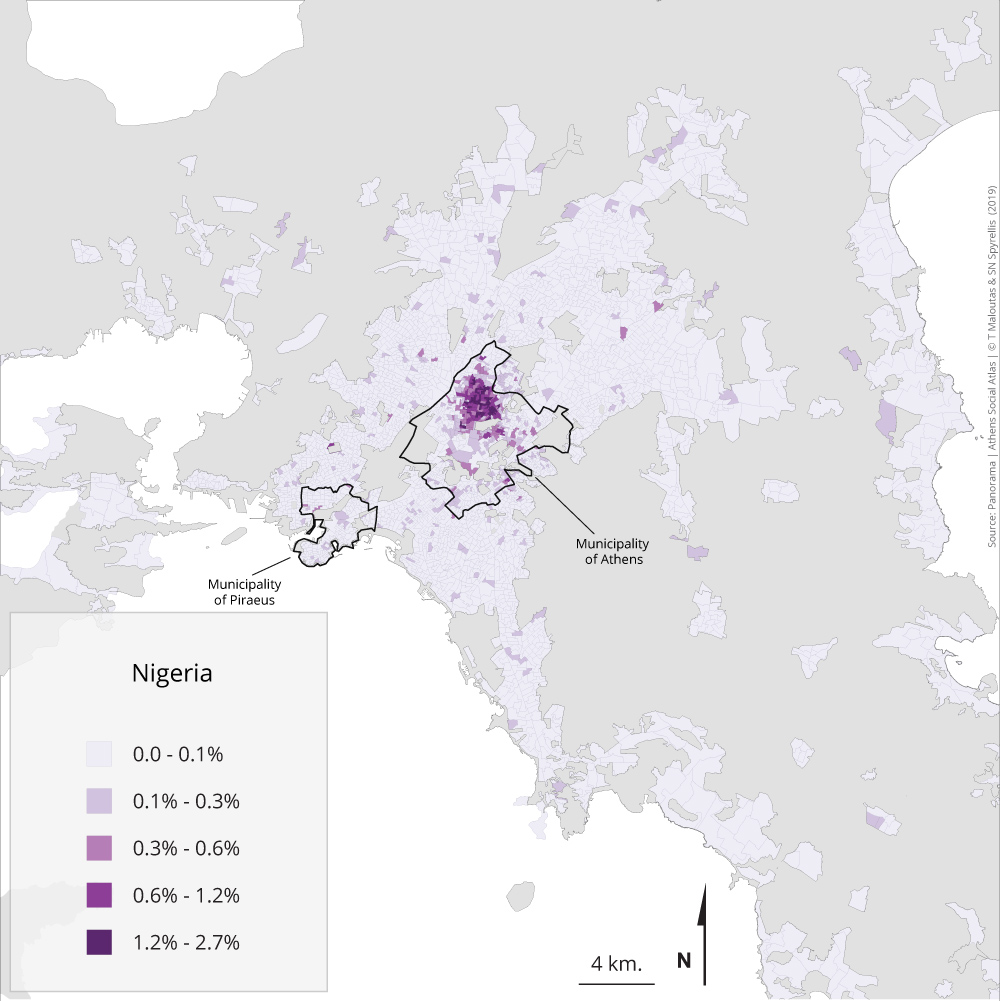
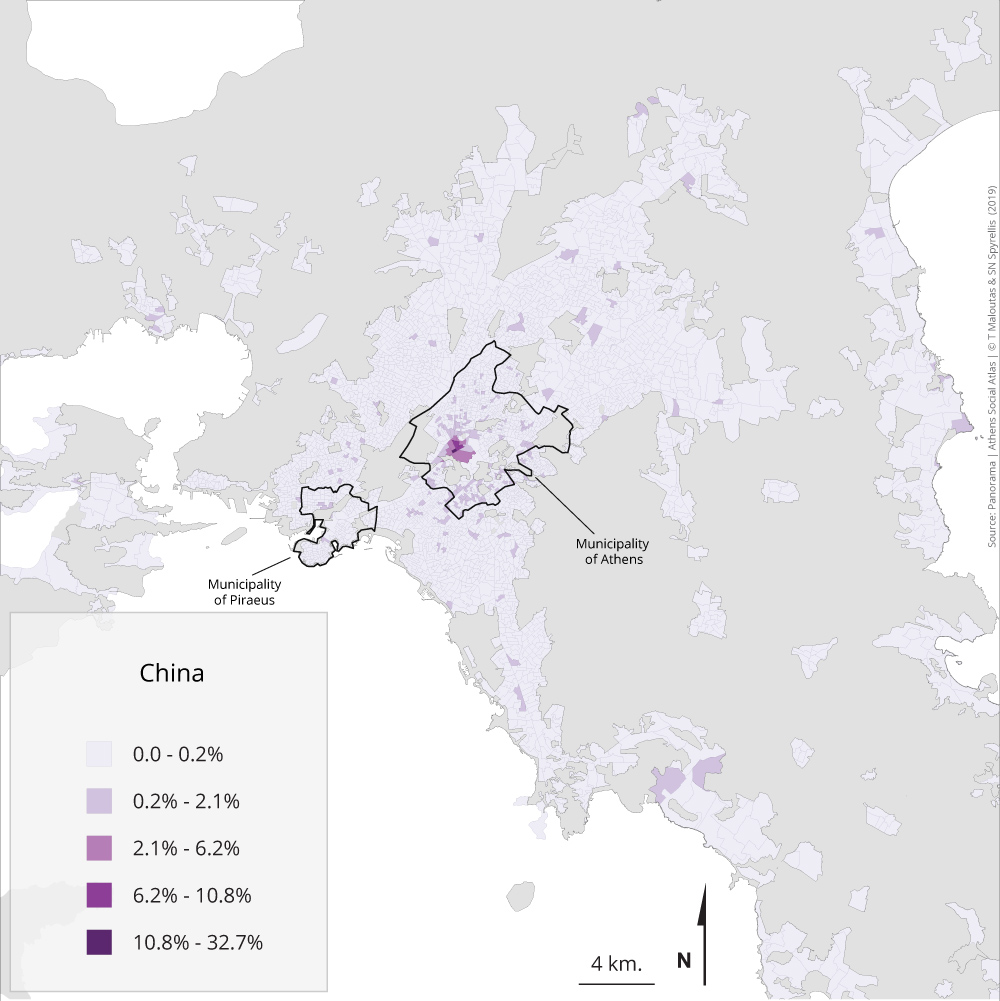
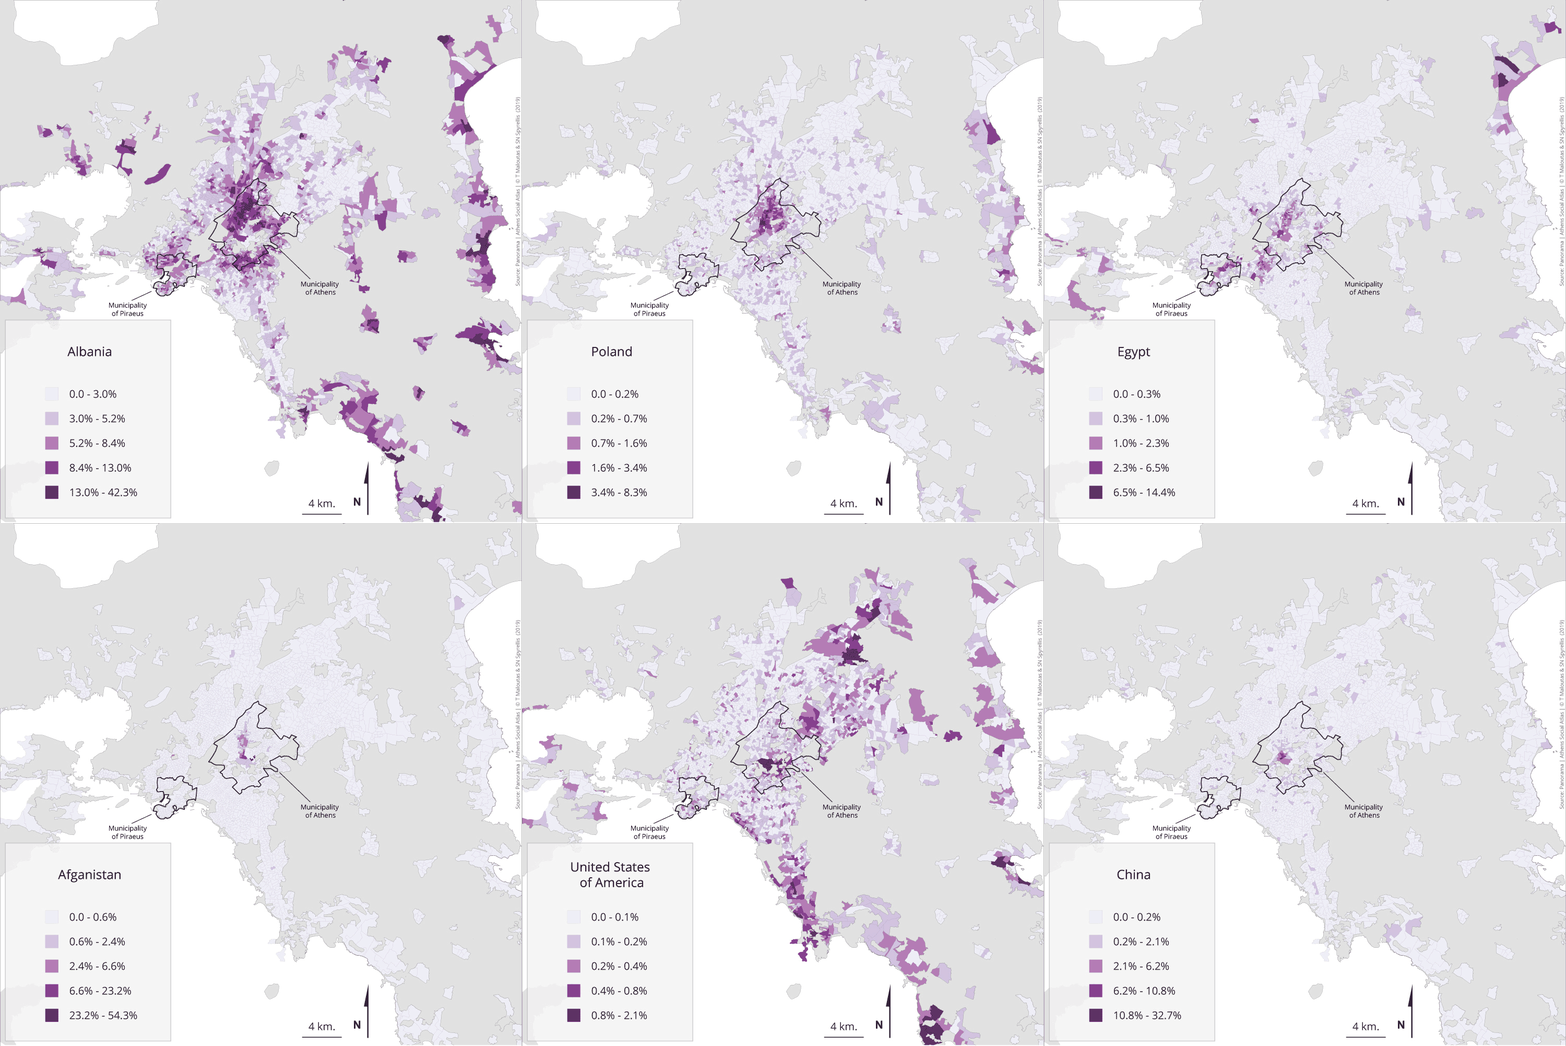
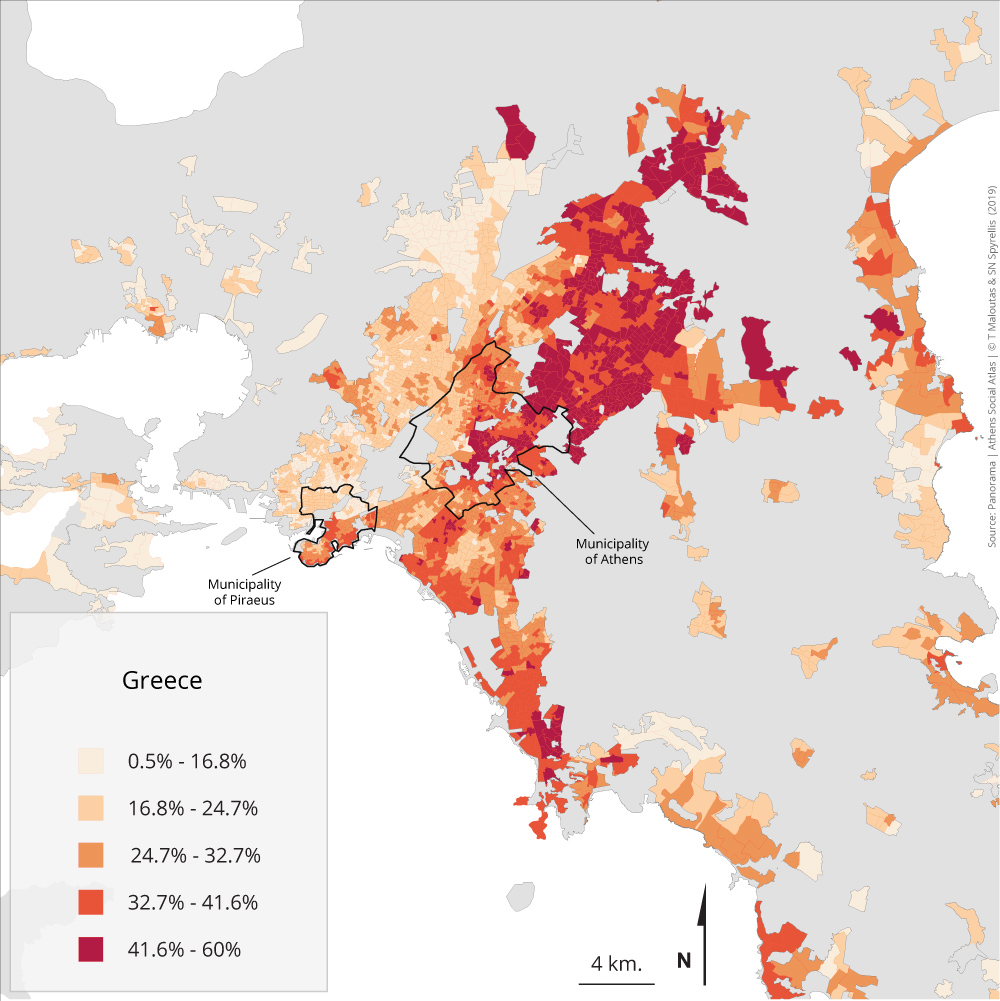
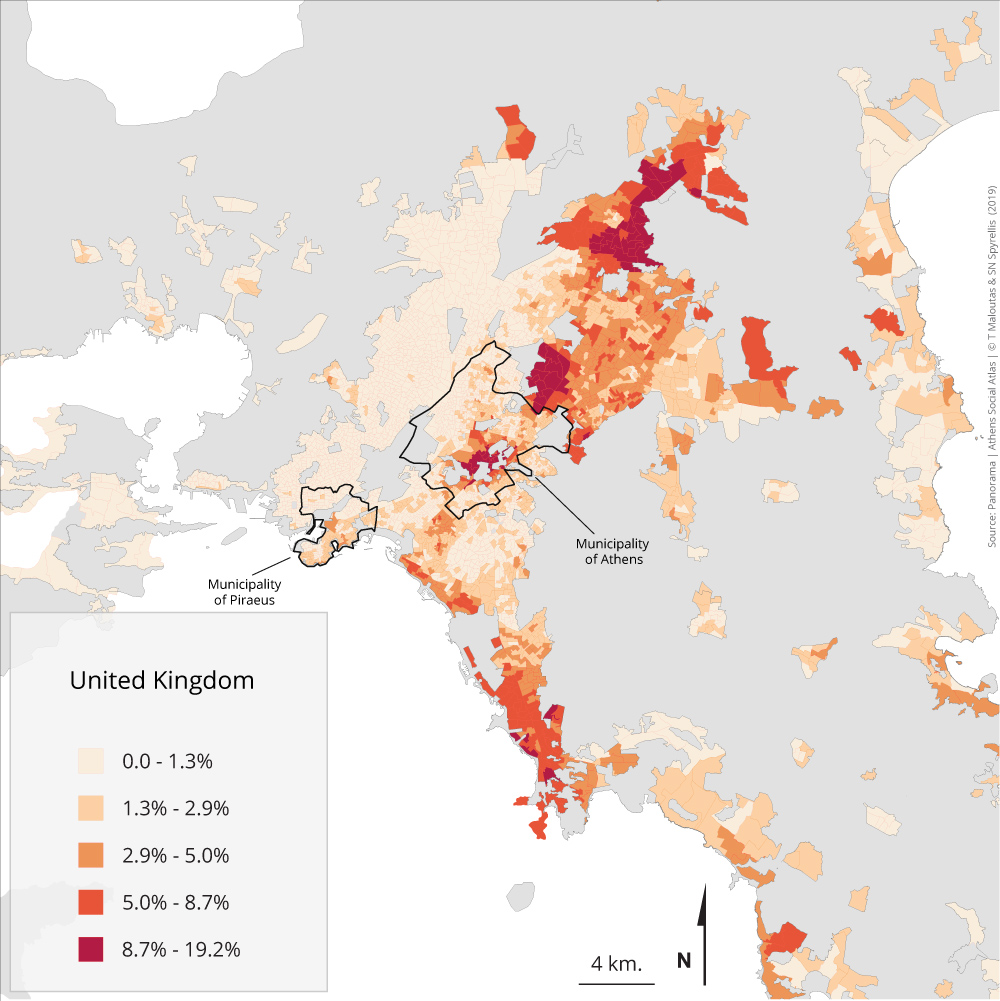
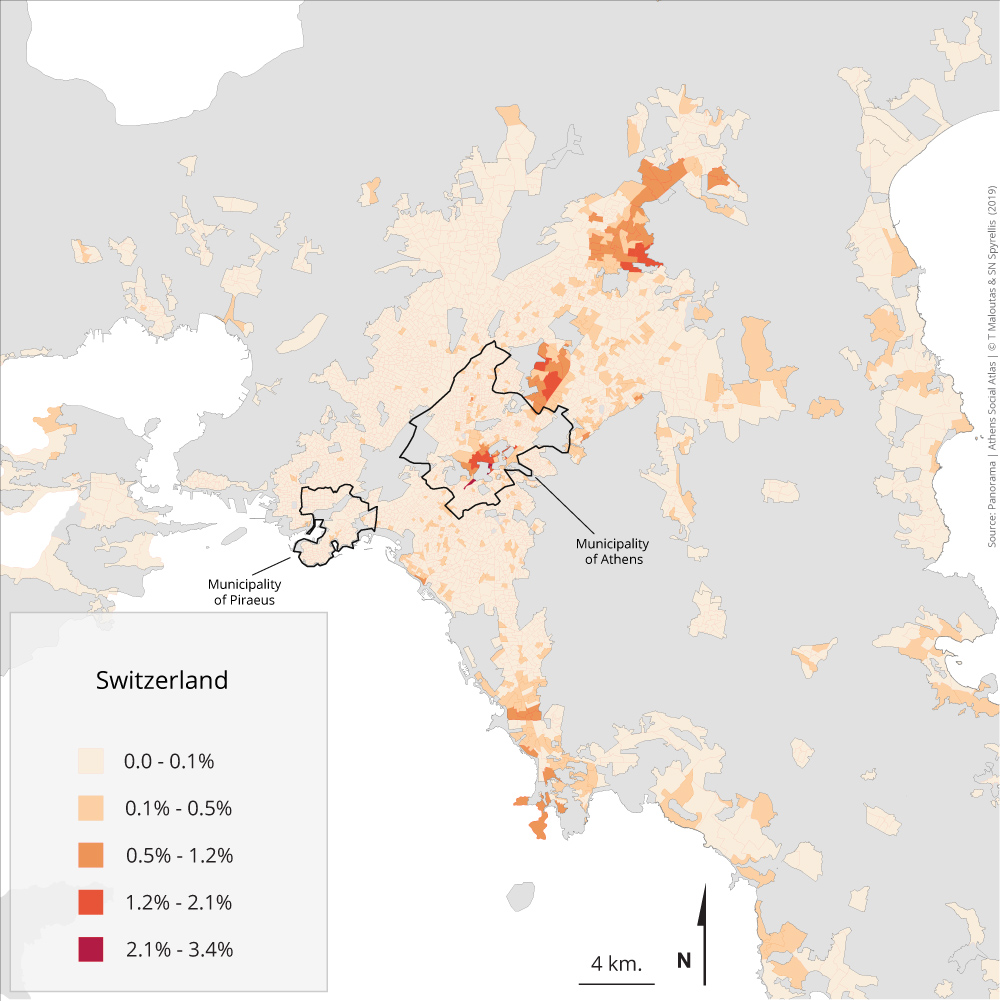
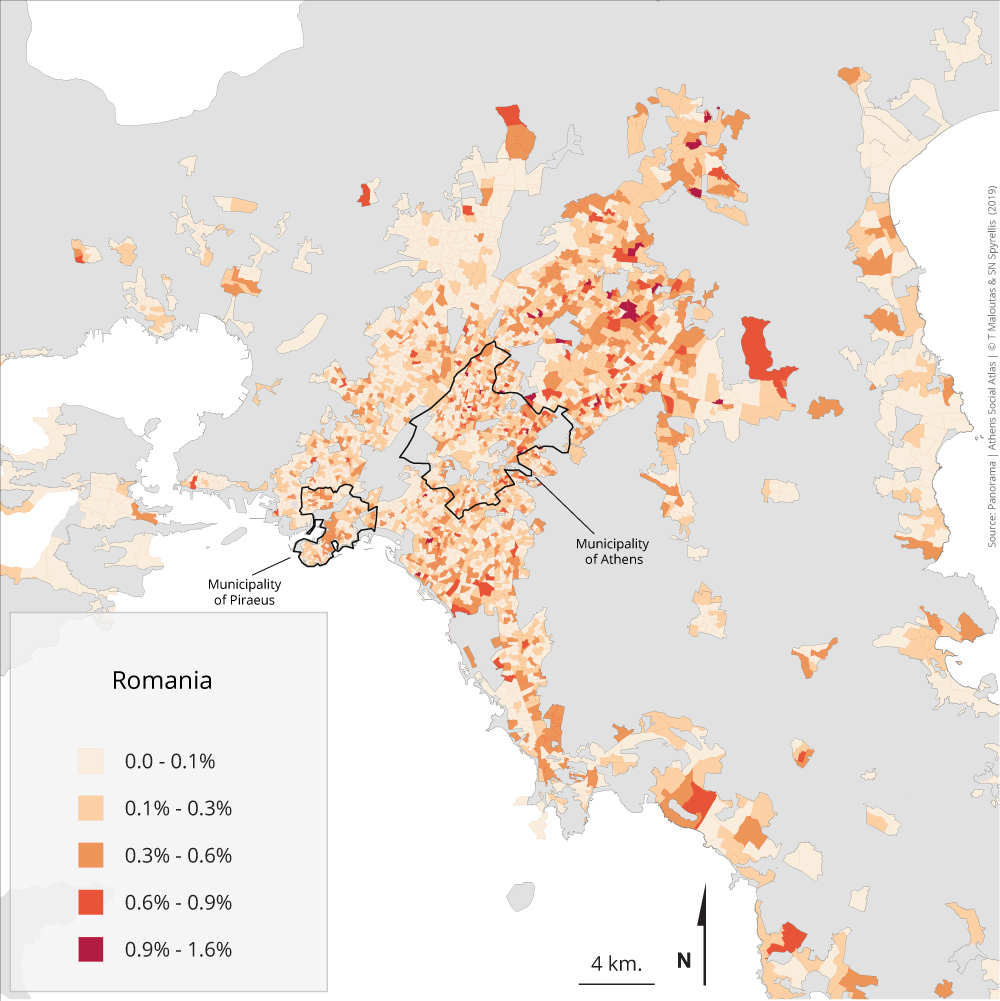
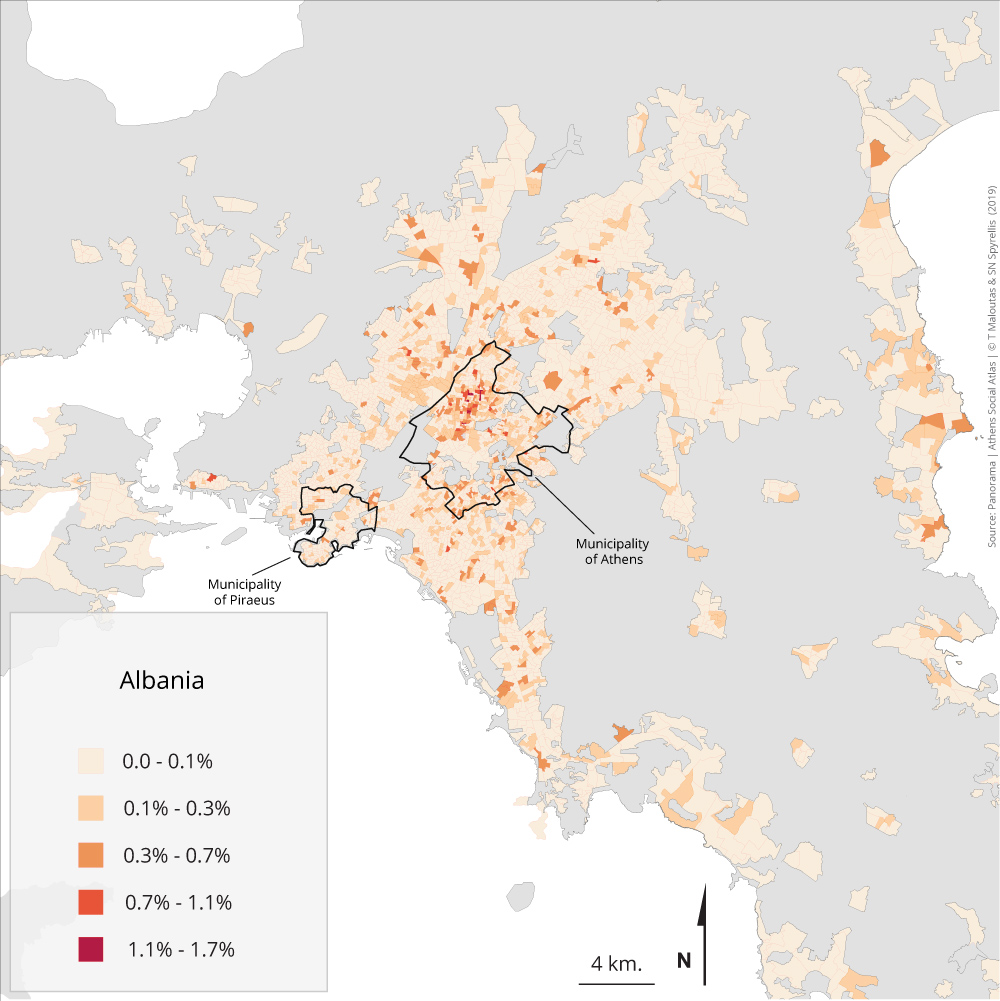
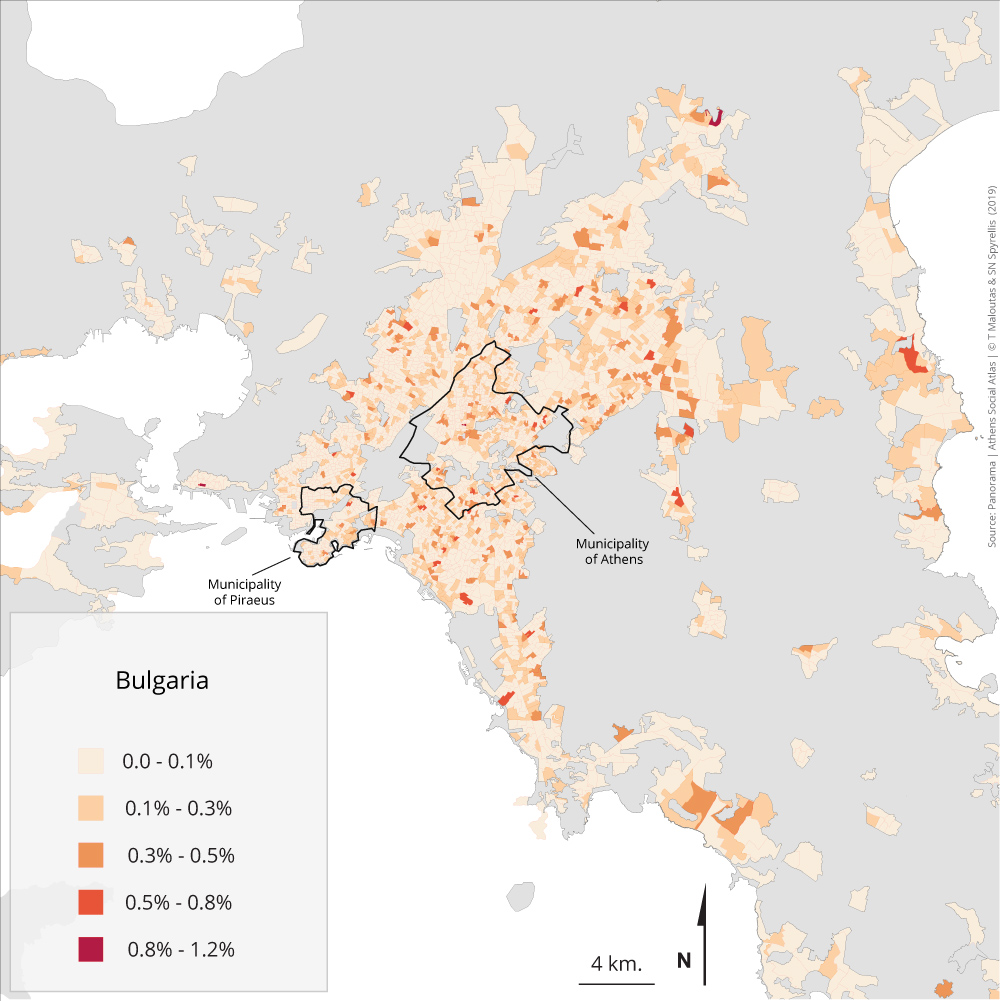
Maps 1.4.1 – 1.4.26: Population distribution by citizenship and area of residence (2011)
The number of immigrants increased significantly in metropolitan Athens during the 1990s and stabilized during the following decade. According to census data, 82.000 immigrants lived in the region in 1991. By 2001 they had increased to 368.000 and by 2011 to 399.000 (Μαλούτας 2018).
Foreign citizens accounted for 10,5% of the population of Athens according to the census of 2011. 9,5% originated from developing countries and the remaining 1% from developed ones [1]. The 26 largest ethnic groups—each comprising more than 2.000 members—accounted for more than 94% of foreign citizens in Athens. These groups and their population are presented in table 1.4.
Table 1.4: Immigrant groups in Athens by country of origin and size (2011)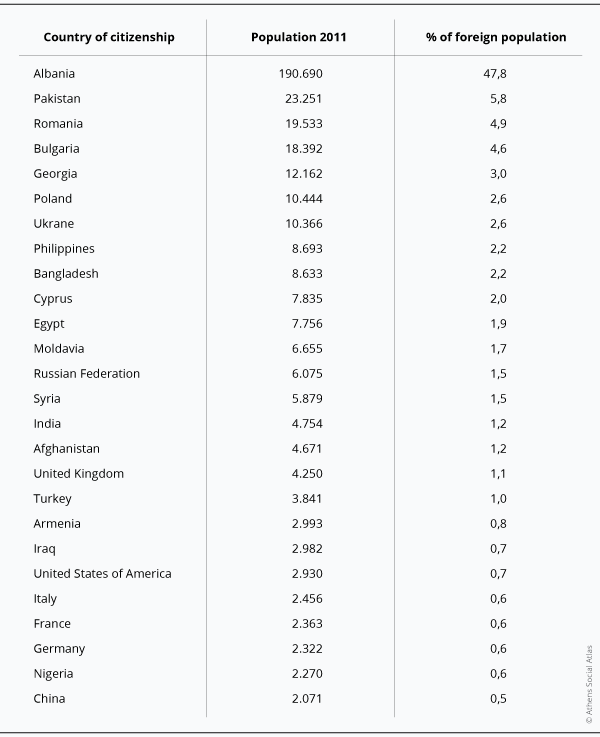
Data source: EKKE-ELSTAT (2015)
The spatial distribution of the various ethnic groups in Athens shows that each one follows a different pattern. However, there are often similarities among groups due to their common demographic features—for example, groups where young women significantly prevail—or/and to their common geographical origin—for example, groups originating from Eastern European countries.
Albanian immigrants—by far the largest immigrant group in Athens and in the whole of Greece—are mainly concentrated in the densely populated neighbourhoods of the centre (Patissia, Kypseli, Pangrati, Ampelokipi) but also in parts of the distant periphery, like the coast of Eastern Attiki, Mesoghia, Elefsina and Aspropyrgos. Most other groups from Eastern Europe are concentrated in the densely populated central neighbourhoods, andless in the distant periphery, due to their significantly smaller engagement with rural activities.
Among those originating from Eastern Europe, Bulgarians and Polish are the most concentrated in central neighbourhoods. Concentration in central neighbourhoods is even higher for a number of groups originating from countries outside Europe, especially Nigeria, Bangladesh, China and Afghanistan.
Immigrants from several countries follow unique patterns of spatial distribution, often due to their particular composition. Turkish citizens, for example, are highly concentrated in the municipalities of Palaio Faliro, Alimos and Nea Smyrni. They are mostly former residents of Istanbul of Greek origin, who settled in these areas close to the coast when they were forced to leave Turkey in the 1950s and 1960s. A smaller concentration of Turkish citizens is observed in Lavrio (outside the map), a host region for Kurdish refugees.
Immigrants from the Philippines—mostly women—are mainly gathered in Ampelokipi, where the Filipino community has settled since the 1990s. On the other hand, an important presence of Filipinos is observed in wealthy suburbs, where many Filipino women work as live-in domestic help. Most groups from developed economy countries are also concentrated in wealthy suburbs and central neighbourhoods due to their higher income.
Several other groups are also mainly present outside the city centre. The Armenians, established in Greece since the early 20th Century, are mostly present in areas of their traditional concentration at the outskirts of the Municipalities of Athens and Piraeus. Iraqis in Peristeri and Egaleo. Indians and Pakistanis in rural areas of the distant periphery—like Mesoghia and Marathonas—and, Pakistanis in particular, along the axes of the two highways due to their employment in low grade positions in logistics.
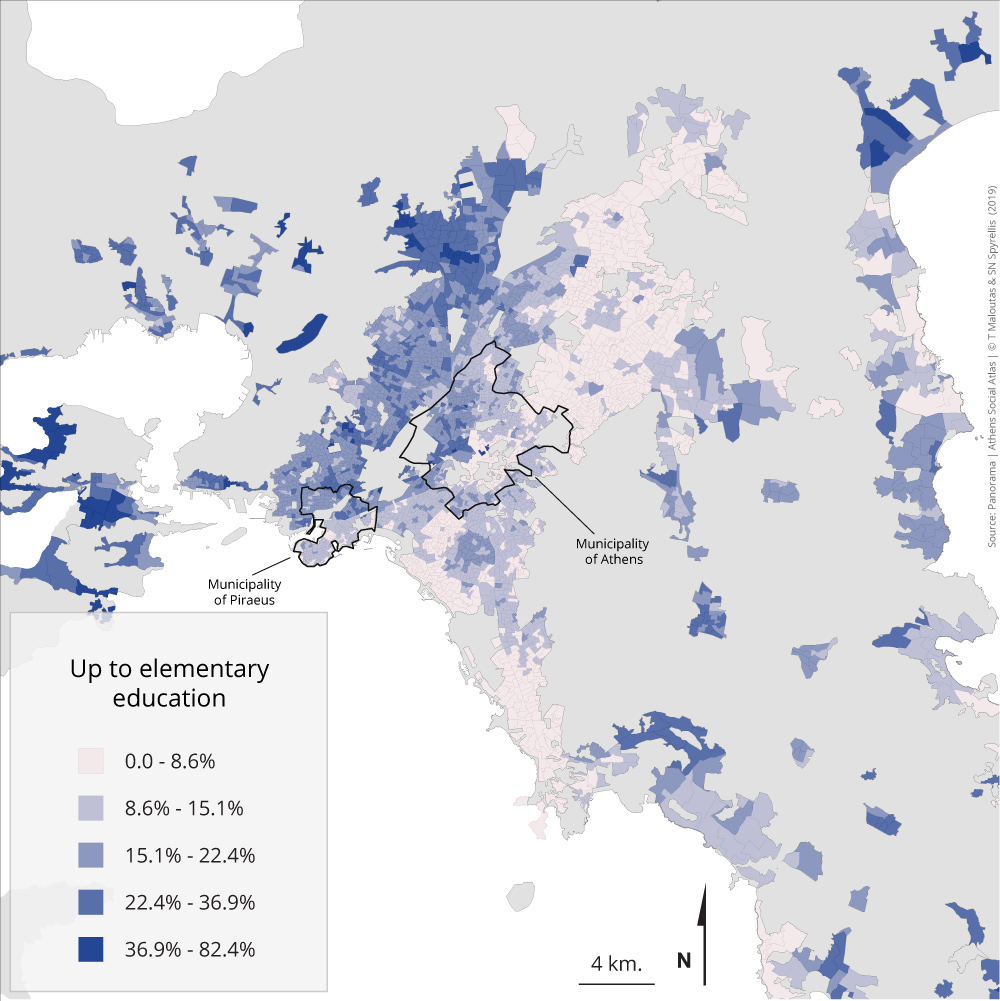
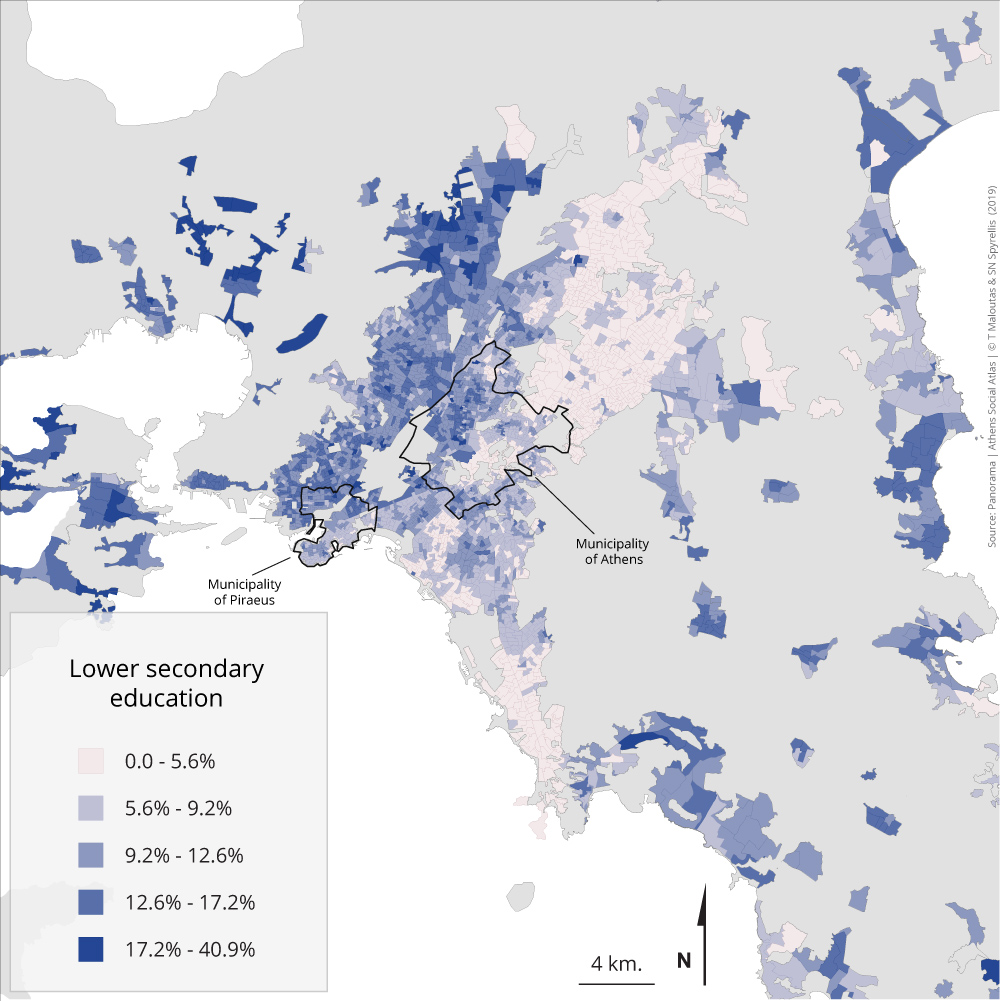
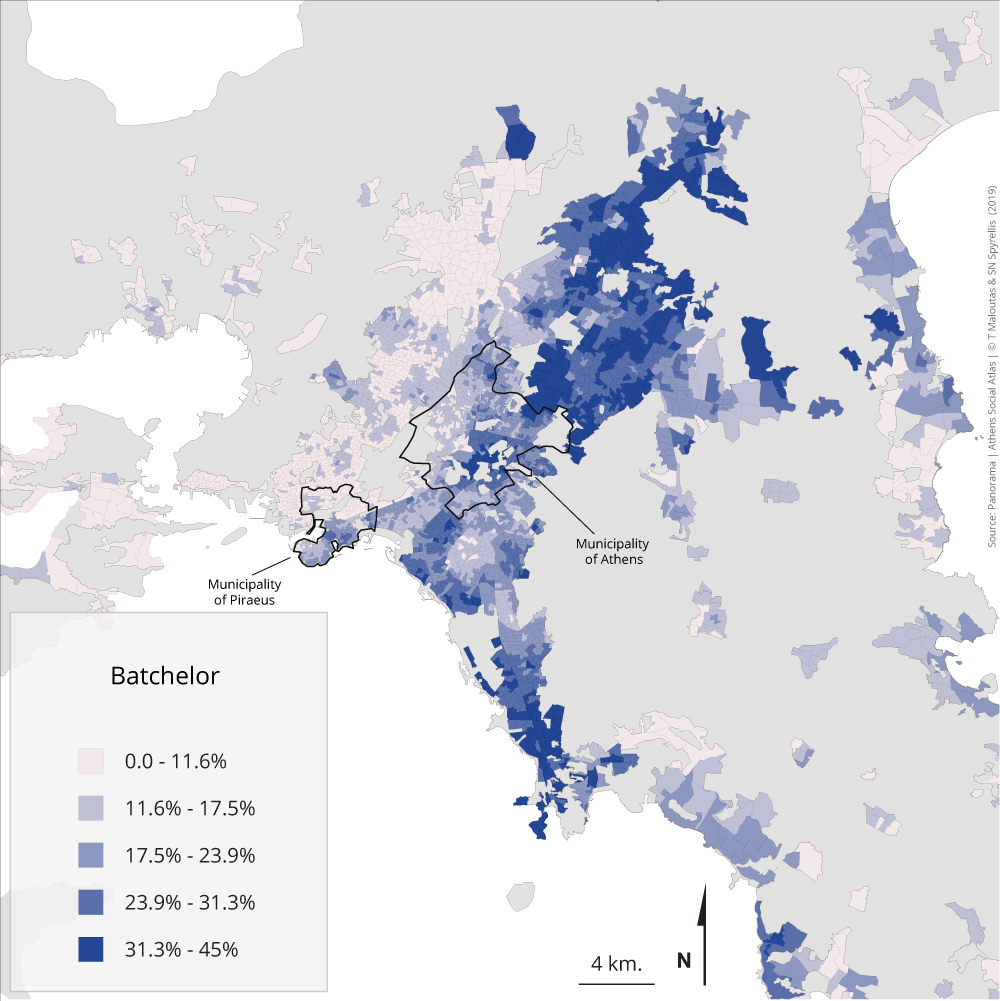
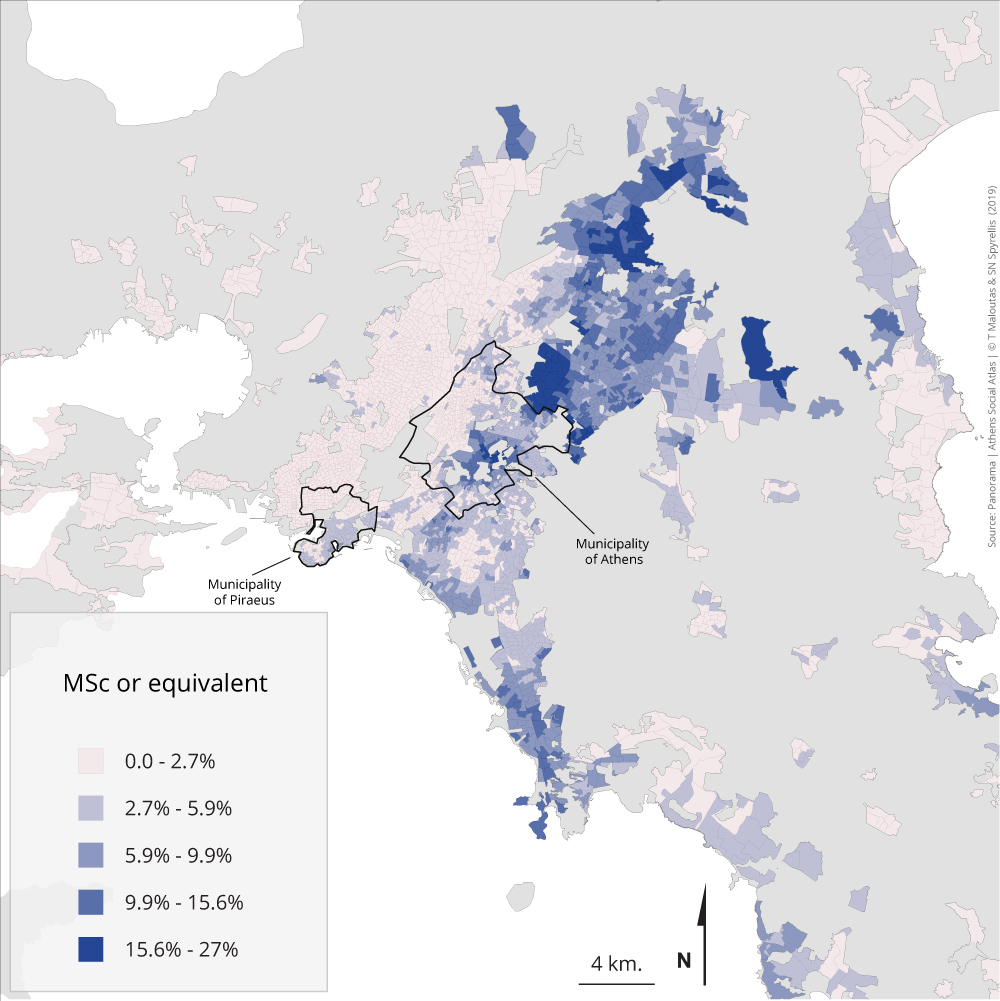
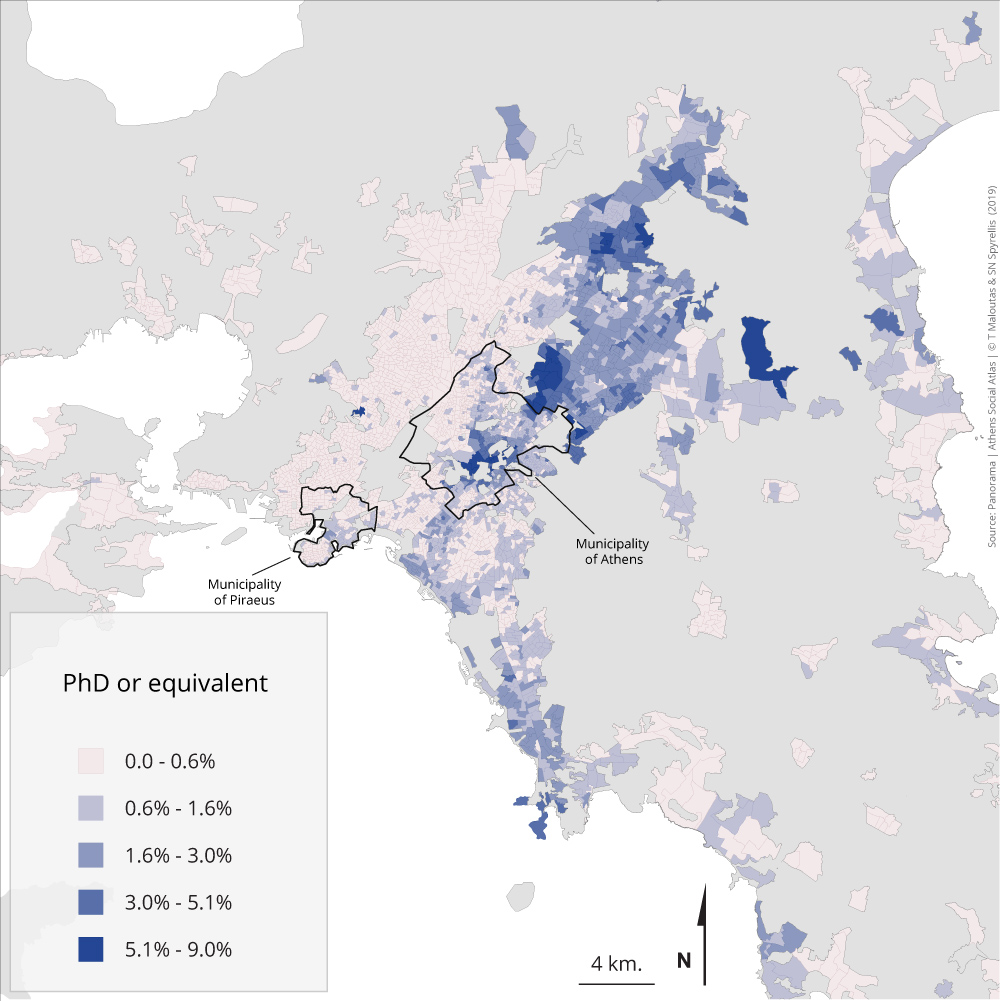
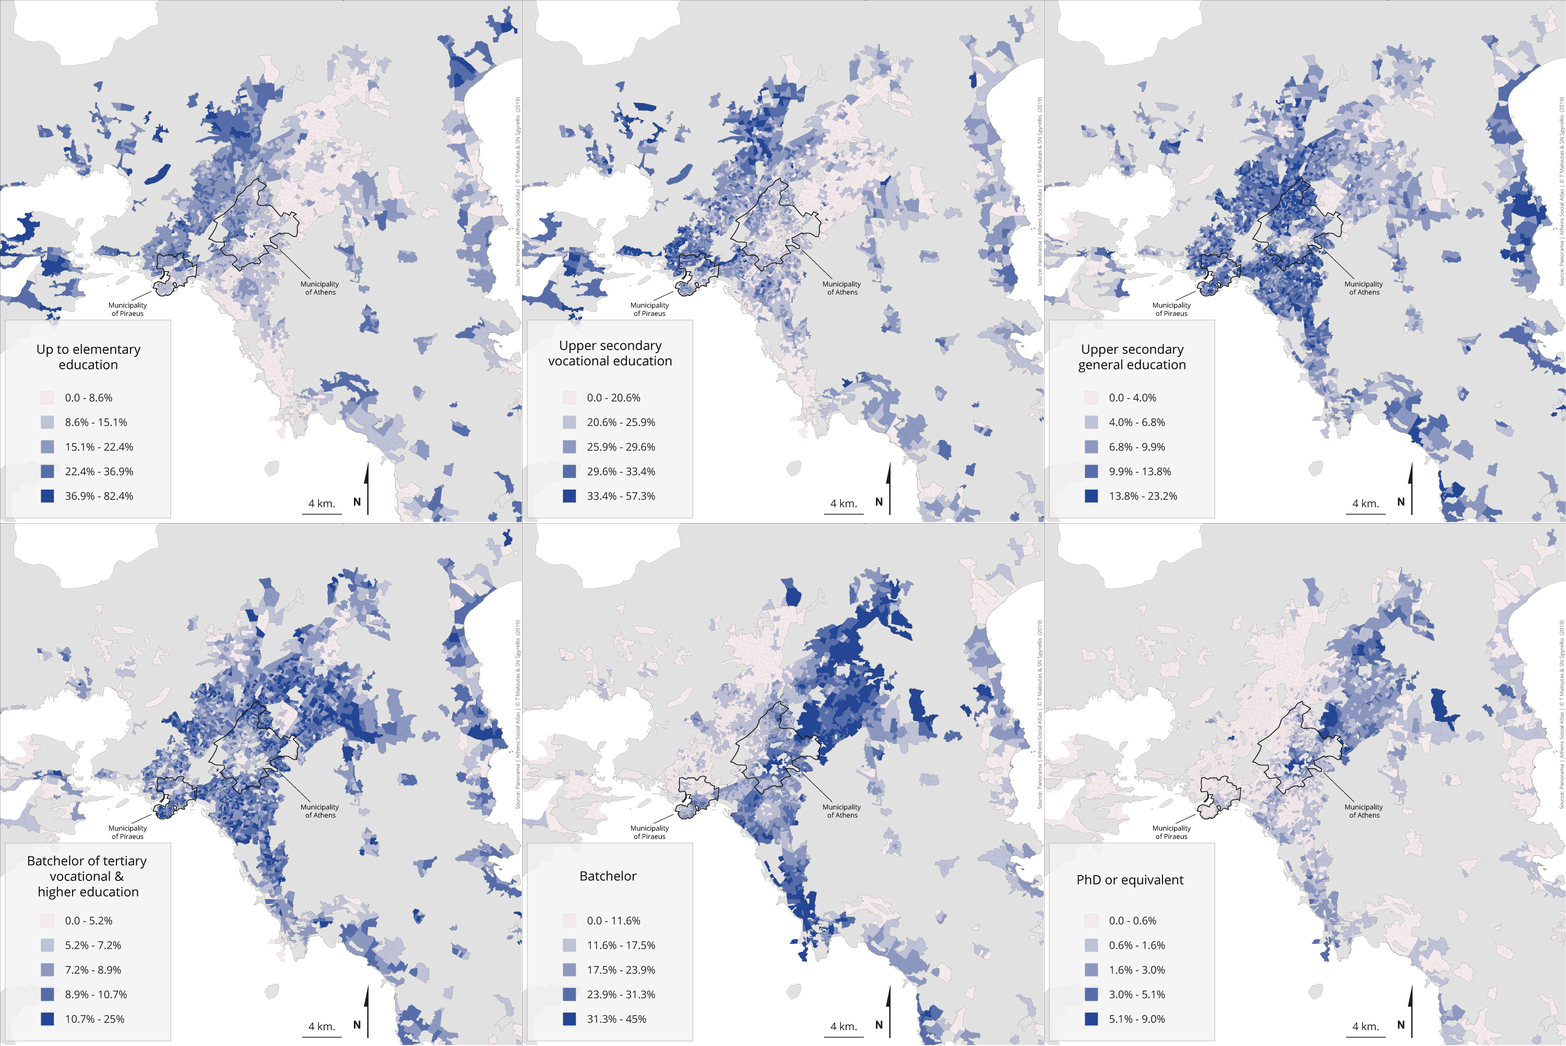
Maps 2.1.1 – 2.1.9: 23-67 year olds by education level and area of residence (2011)
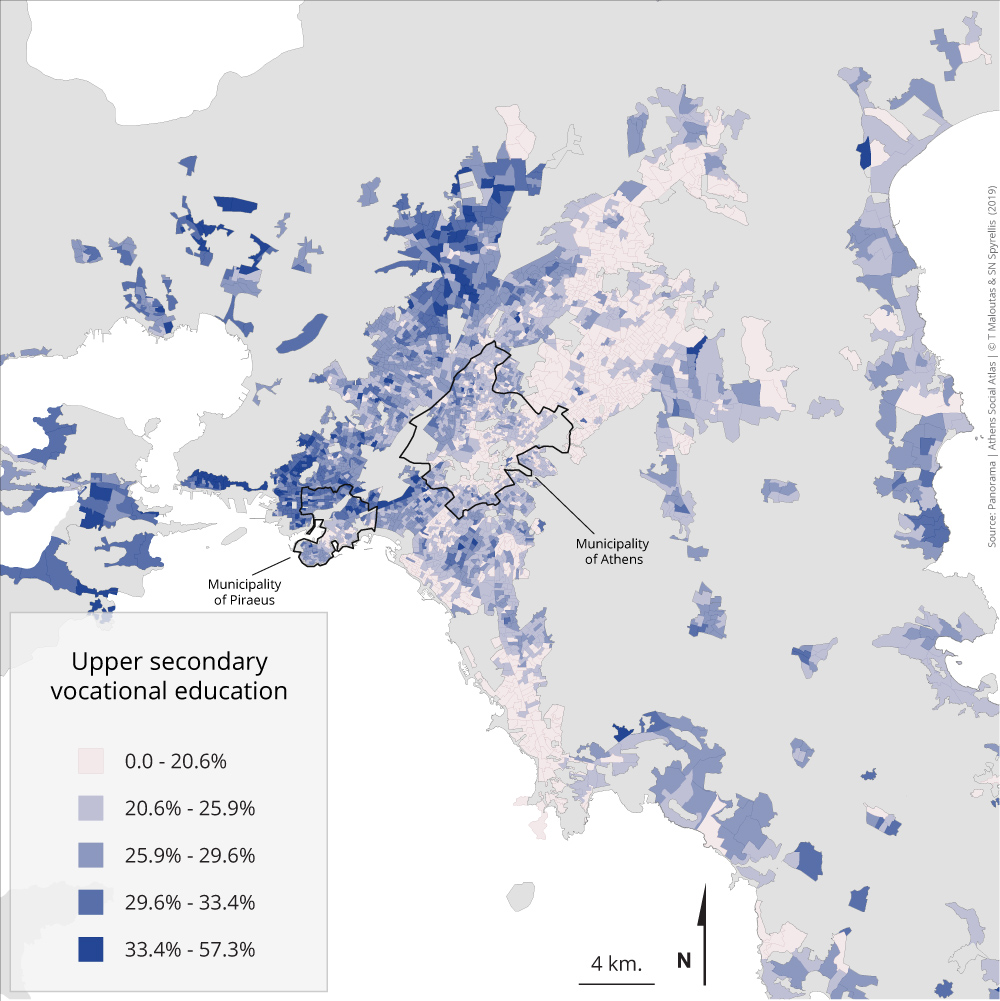
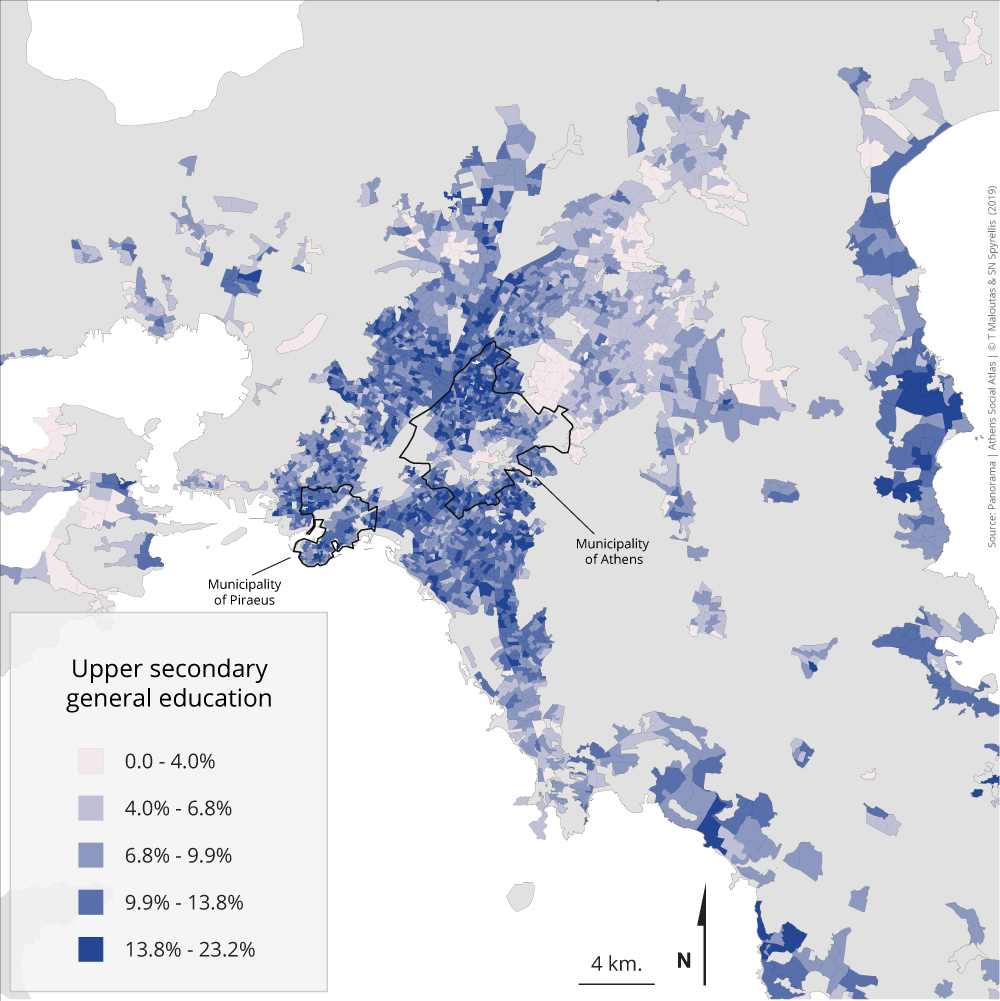
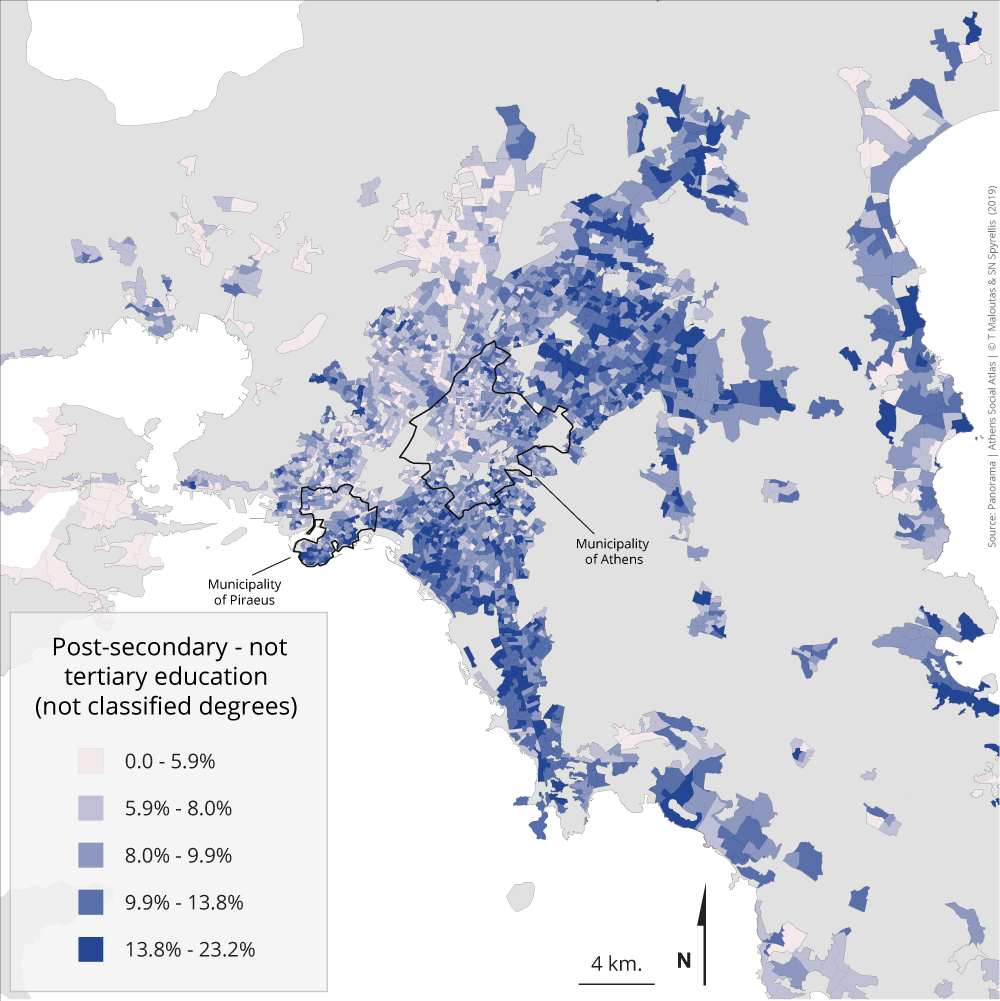
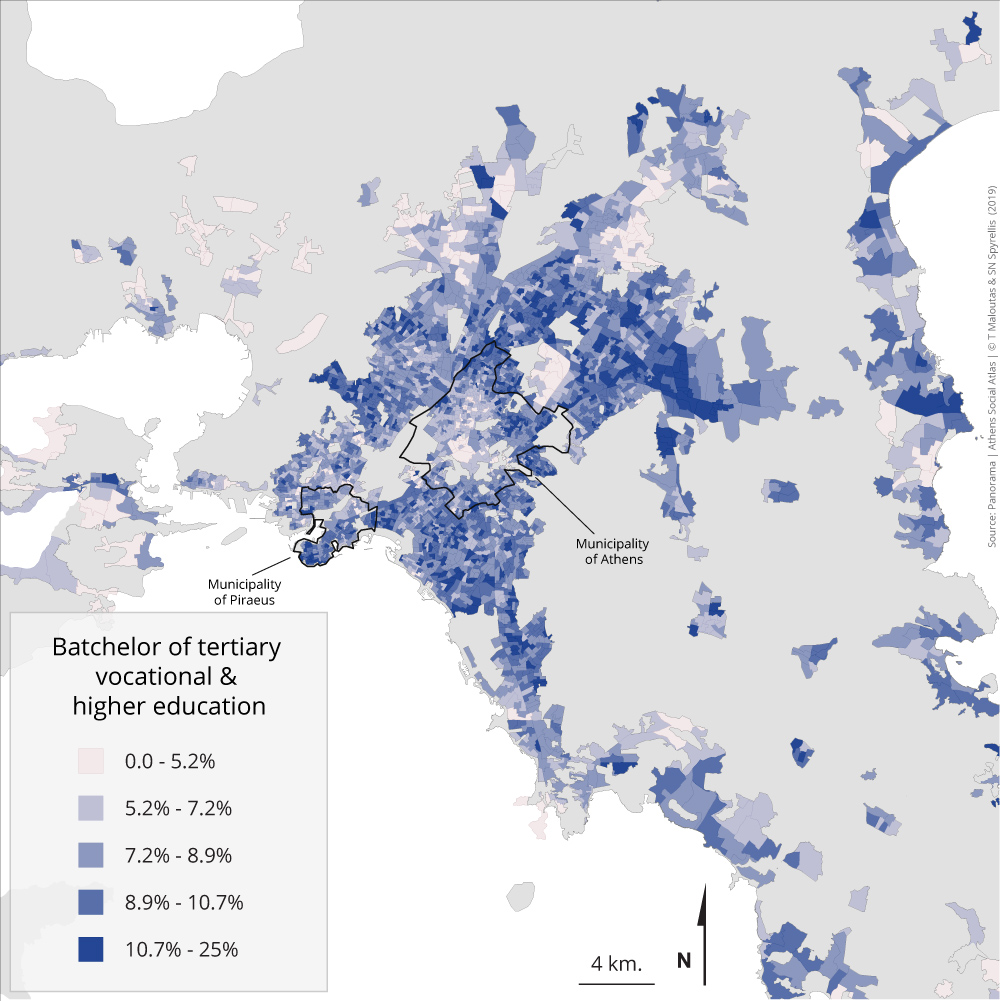
The education level of the city’s residents is probably the variable that reveals the social geography of Athens in the clearest way. The relative concentration of residents aged 23-67 by educational credentials shows that as their level of education rises their concentration in the western part of the metropolis drops while their concentration of the eastern part of the metropolis rises.
The western part of the metropolis and the distant periphery display important concentrations of those with lower educational credentials (up to elementary school). These areas comprise traditional working class suburbs and the western part of the Municipality of Athens, but the highest percentages are found in new working class areas and in the outskirts, in municipalities like Salamina, Aspropyrgos and Marathonas.
For those who finished the 9-year compulsory education (Gymnasium), as well as for those with secondary level vocational training, the differences with the previous group in terms of spatial distribution are rather small. These groups are overrepresented in working class areas and, more generally, in areas where thos who occupy positions of manual labour are over-represented.
The distribution pattern changes considerably for those having completed general secondary education (Apolyterion). The areas where they are overrepresented comprise the traditional working class suburbs, but also all the neighbourhoods of intermediate strata in the outskirts of the Municipalities of Athens and Piraeus. They are underrepresented in new working class areas.
Those who completed a post-secondary (not tertiary) education program are located further to the east. It is worth mentioning that their location is closer to the pattern of upper and upper-middle groups, compared to the pattern of those who graduated from tertiary vocational education, even though the status of the educational titles of the latter is higher. This is due to the traditional link of vocational training with the working class and the broader lower strata, and this link has not been broken despite the official upgradings of vocational education during the last 20 years.
University graduates and those with equivalent titles are overrepresented in the eastern part of the city and are relatively absent in the rest. The separation axis in this case between east and west is similar to this axis emerging through the opposite location pattern of those with low educational credentials.
Finally, those with the highest degrees (Masters and PhDs) are not generally overrepresented in the eastern part of the city. Their overrepresentation is particularly notable in the strongholds of the upper occupational categories (Municipalities of Psychico, Filothei, Ekali and the central neighbourhood of Kolonaki).
Table 2.1 shows the distribution of the 23-67 year old population in the broad categories of educational level that can be found in both the censuses of 1991 and 2011. The change within these 20 years shows the important increase of those with tertiary education degrees and the precipitous decrease of those with an education up to elementary school only.
Table 2.1: Distribution of the 23-67 year old population of Attiki (except islands) by education level 1991-2011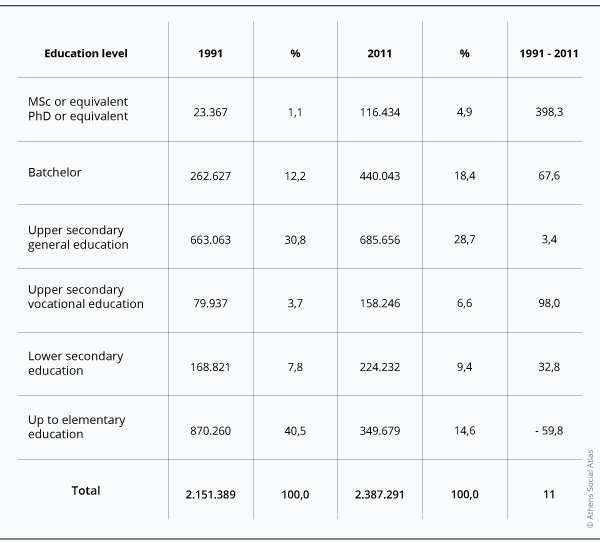
Data source: EKKE-ELSTAT (2015)
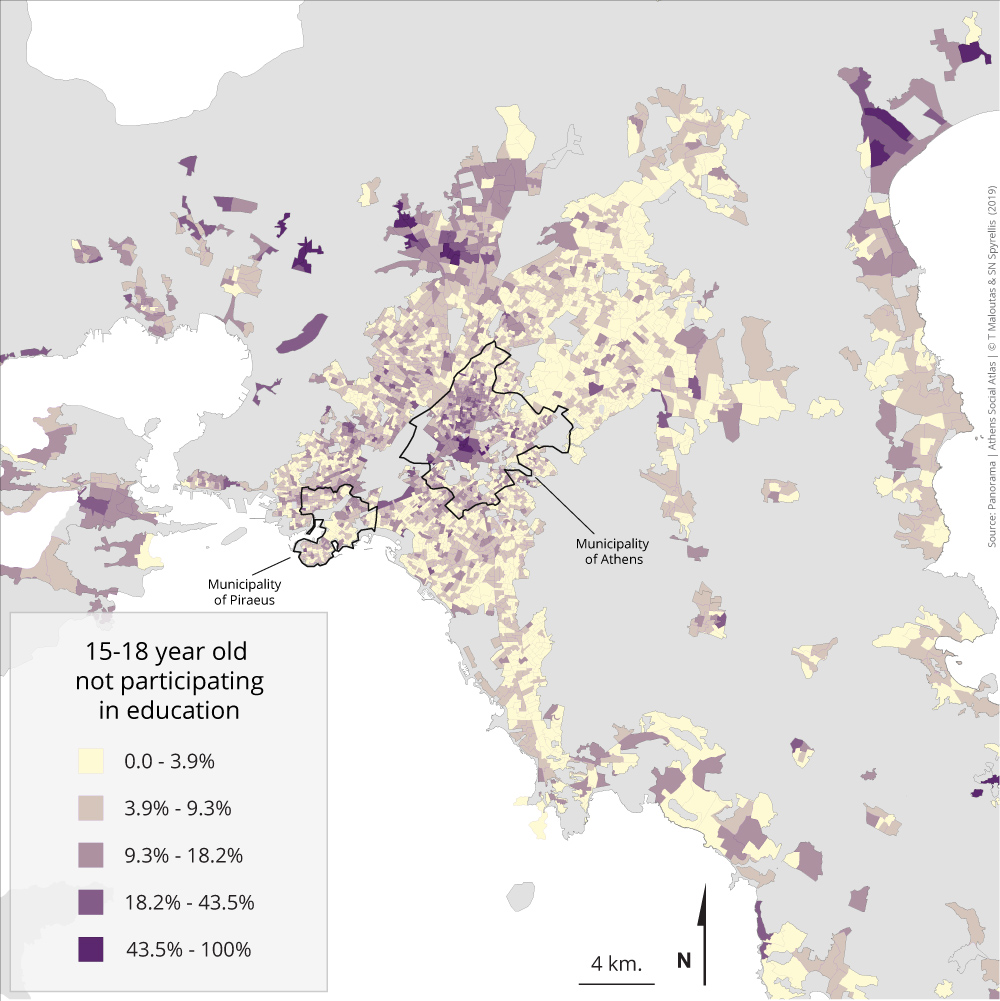
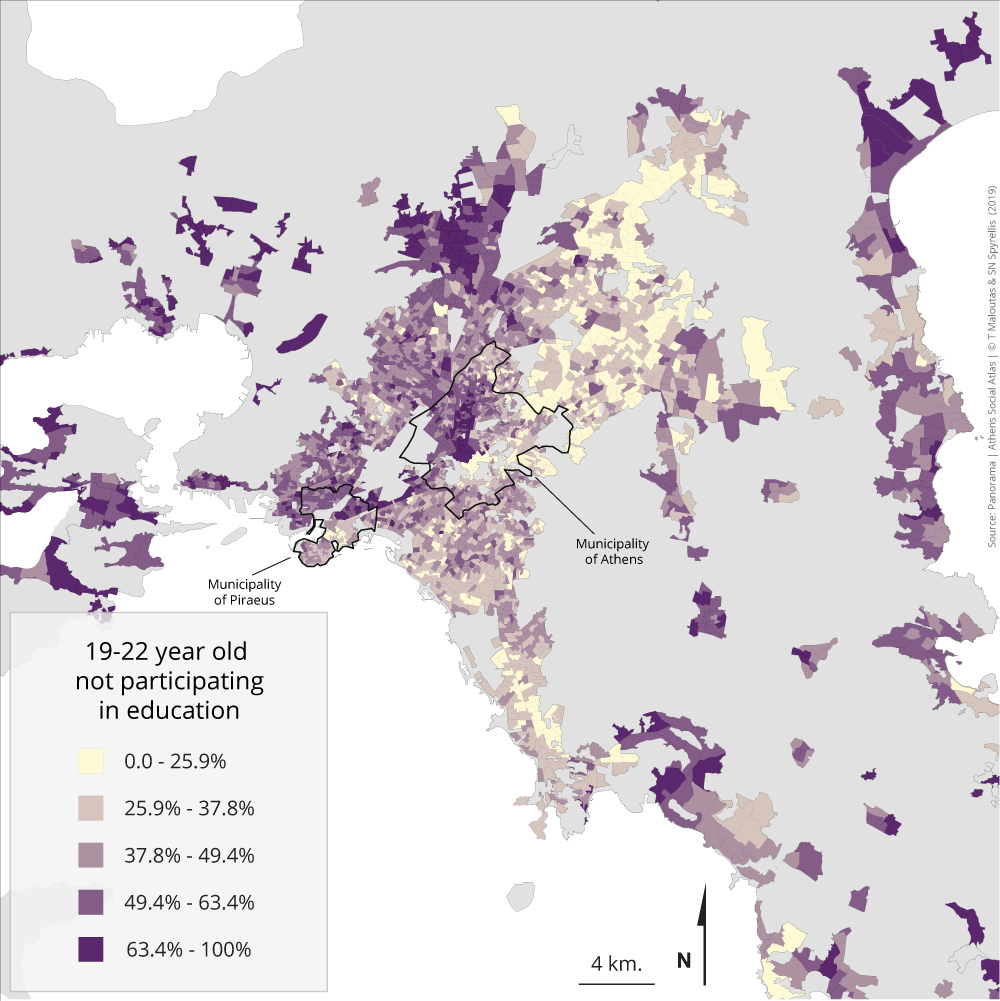
Maps 2.2.1 – 2.2.2: Percentage of 15-18 and 19-22 year old persons not participating in education by area of residence (2011)
The two maps in this section depict the concentration of disadvantage regarding access to education for the young population in different residential areas accross the metropolis. In contrast with the maps of the previous section, where the focus was on the educational titles acquired in the last 40 years by the population aged 23-67 in 2011, the maps of this section refer to the unequal access to education for youths in late adolescence (15-18) and for young adults (19-22) depending on their area of residence during the last census (2011).
The map presenting the percentage of young adults (19-22) who are not in education resembles strikingly with the map of the previous section depicting the concentration of those with low educational credentials. The areas with the highest percentages comprise neighbourhoods of the centre along Patission Av. and Acharnon Av., the municipalities of Rentis and Tavros, Zefyri, Ano Liosia, part of menidi, Aspropyrgos, Marathonas and Salamina. These are the areas with the highest concentration of working class and low-income groups. The comparatively early abandonment of school by the young of these areas, undermines their potential chances for social mobility and contributes significantly to reproduce the low position of these areas in the social hierarchy of the city’s residential areas.
If not participating in education is a relative disadvantage for young adults (19-22), for those in late adolescence (15-18) it depicts a situation at the border of social exclusion. This assumption is based on the fact that for the former, the percentage of their age group participating in education was 56,3% in 2011, while for the latter it was 92,7% (EKKE-ELSTAT 2015). These percentages has significantly changed since 1991 when those in late adolescence participated in education at a rate of 79,5% and young adults (19-22) at a rate of 37,1%. The highest rates of non participants in education among the young are to be found in central neighbourhoods close to Omonia square, parts of Zefyri, Ano Liosia, Aspropyrgos and Marathonas. In most of these areas there are important concentrations of particularly vulnerable groups, like the Roma.
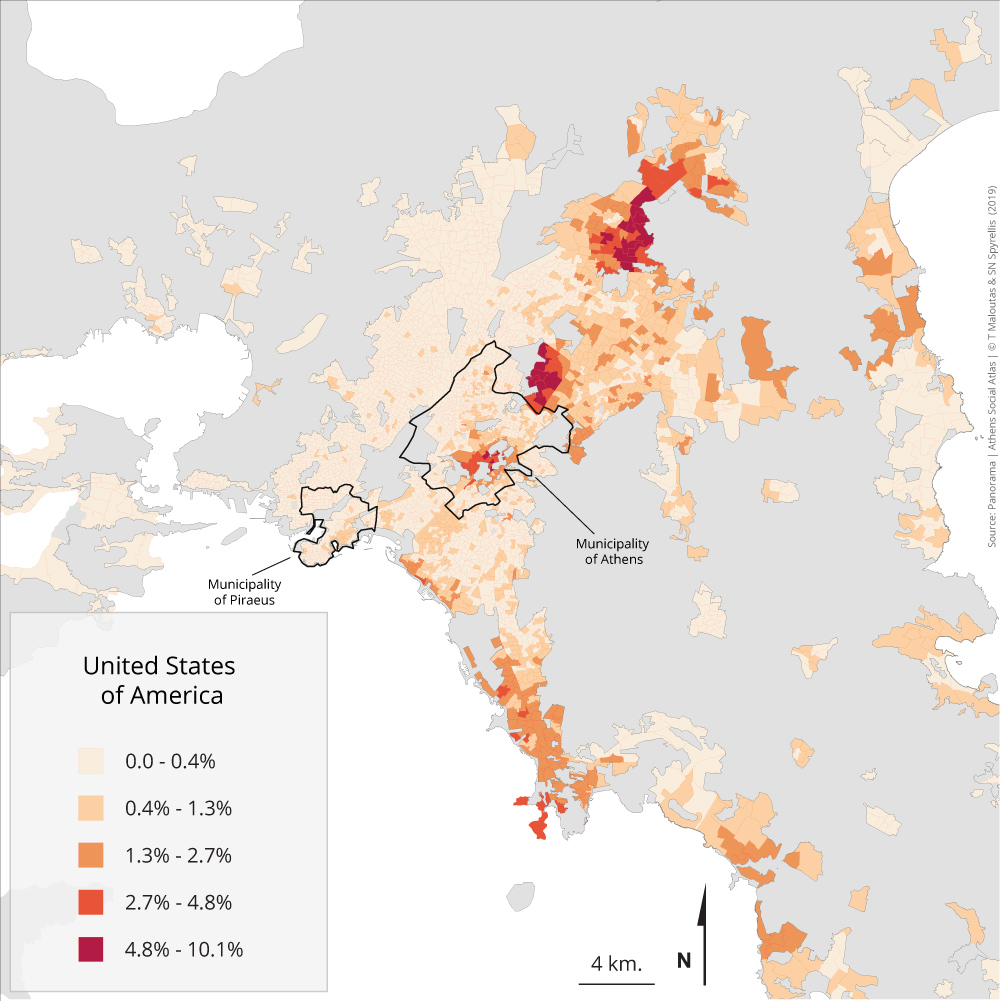
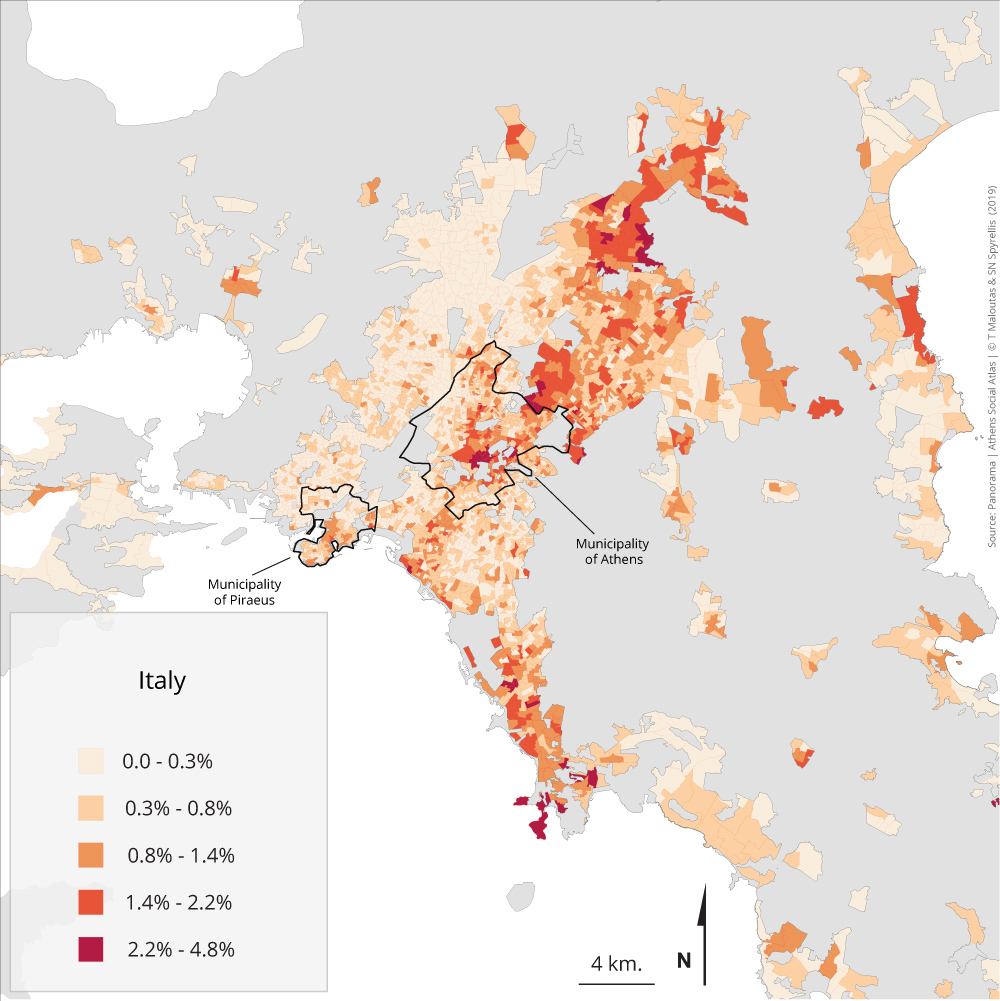
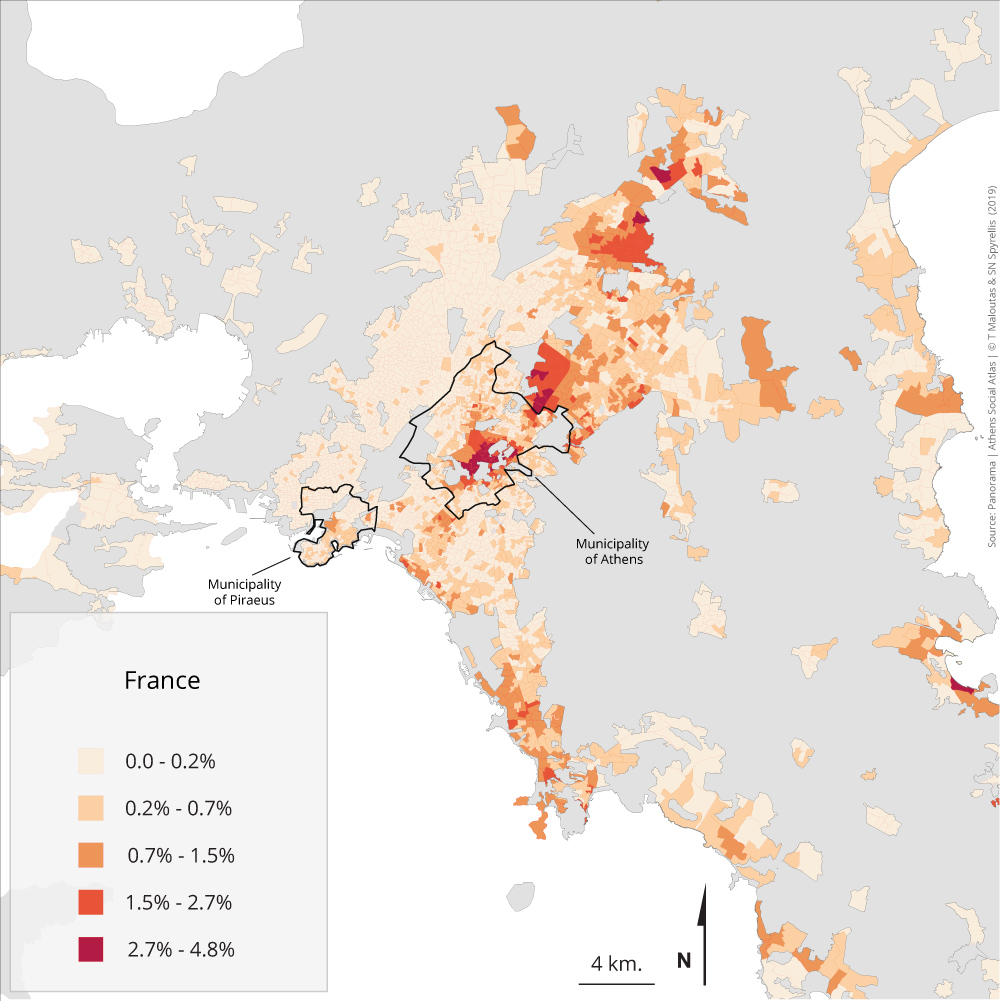
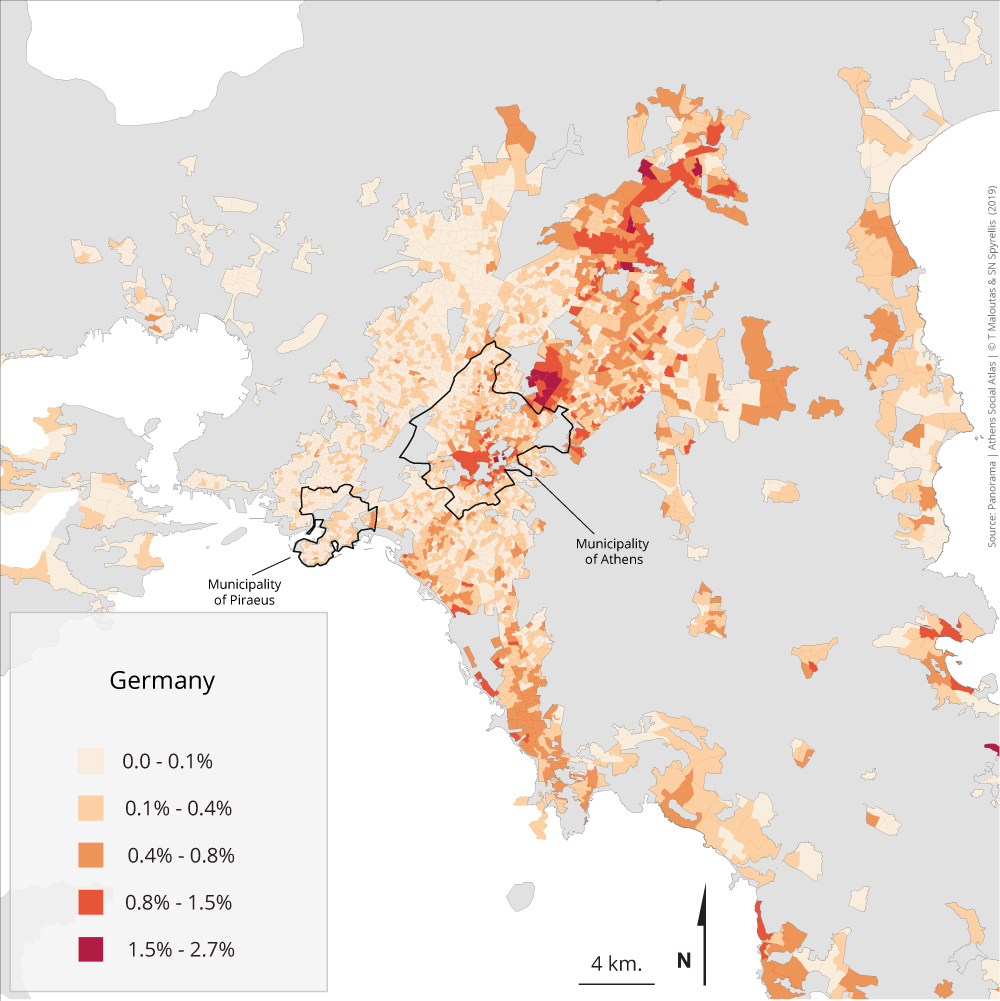
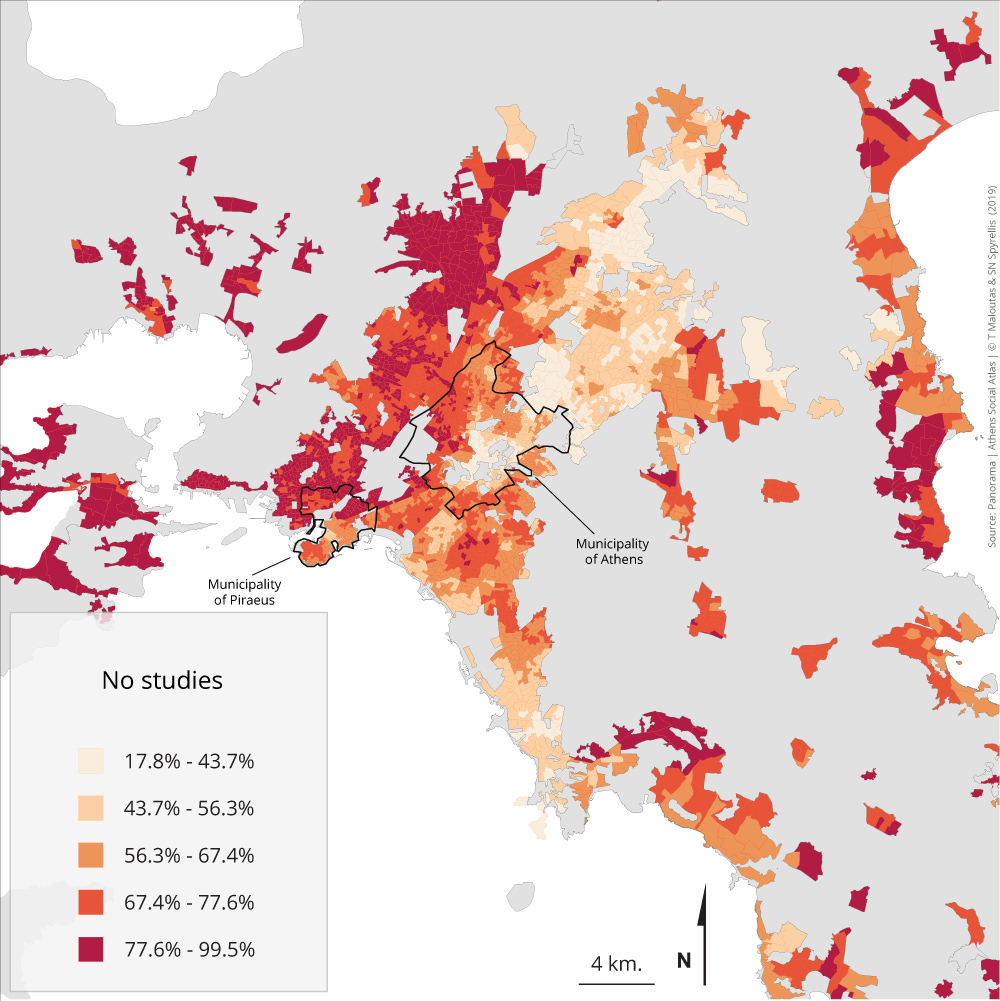
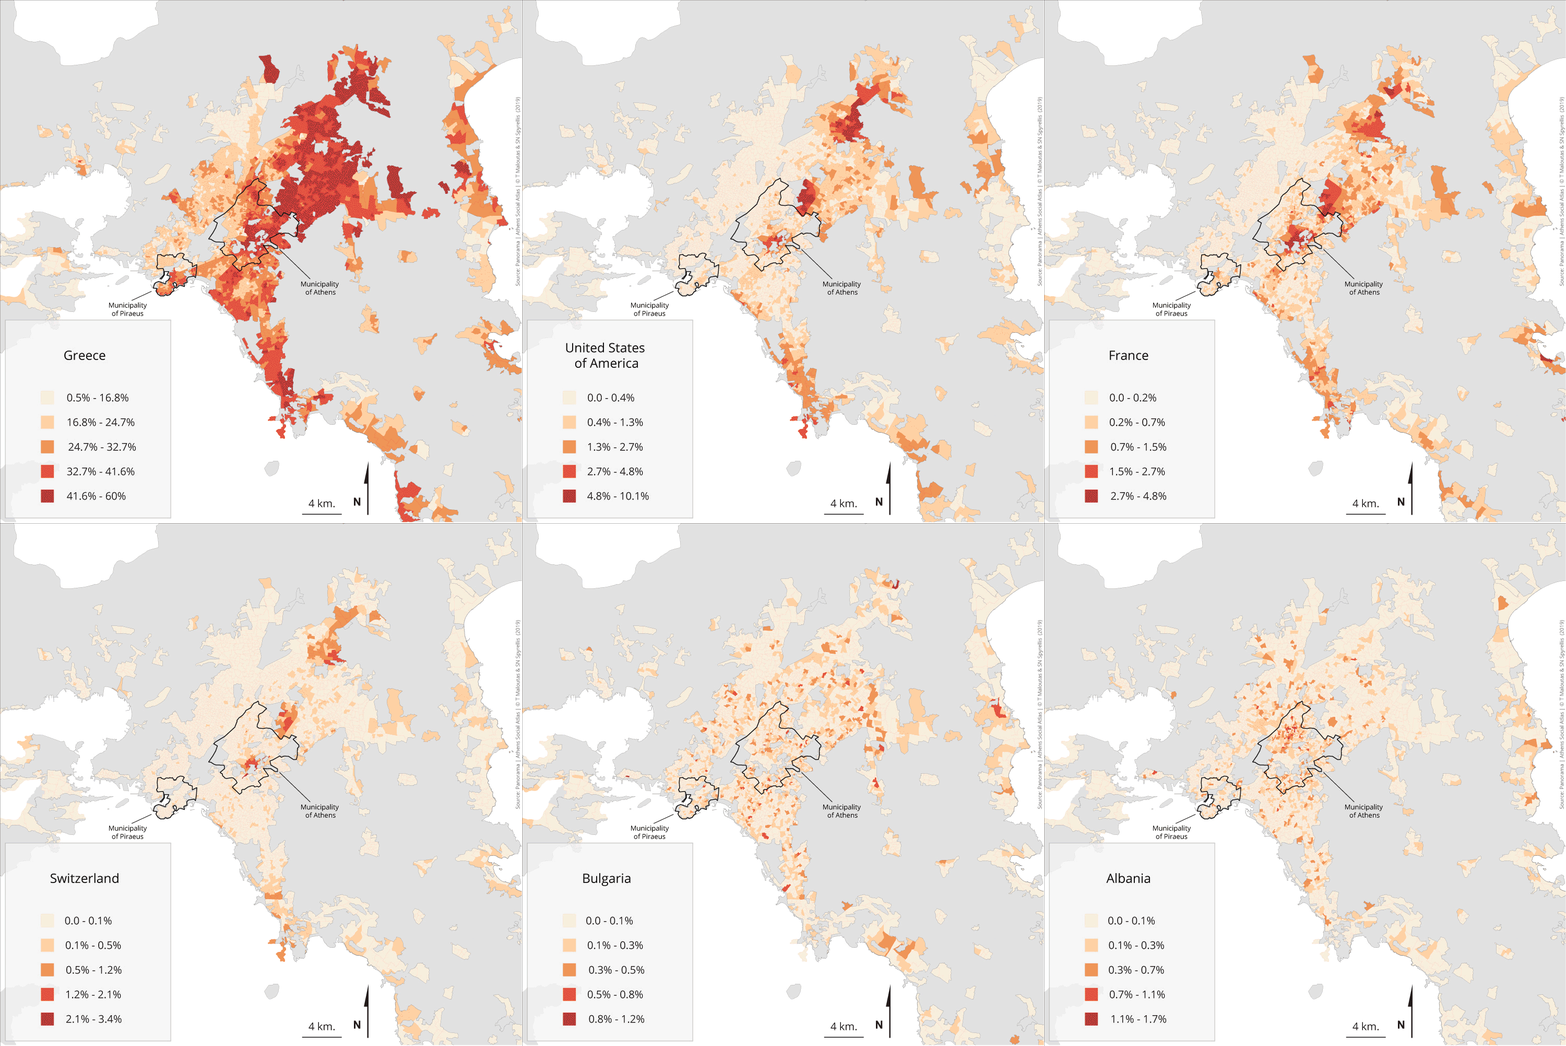
Maps 2.3.1 – 2.3.11: Distribution of degree holders aged 23-67 by country of studies and area of residence (2011)
The maps in this section present the distribution in the residential areas of Athens in 2011 of Greek citizens aged 23 to 67 with a higher education degree by the country in which they studied. The last map in this series shows the spatial distribution of those of the same age with no higher education degree. An important segment of the Greek—and even more so of the Athenian population—studied abroad (see following table). This is an issue investigated through different angles (fiscal, demographic, impact on ‘brain-drain’ etc.) but there are no robust studies on the social origin and on the spatial distribution of those who studied abroad.
The distribution of those who studied in Greece, which is included here for comparison, is almost identical with the distribution of higher education degree holders (presented in a previous section). This was to be expected since more than 80% of higher degree holders have studied in Greece.
Studies in countries with developed economies and, usually, with high standards of university studies, but also involving a rather high cost—like the US, Switzerland, France, the UK, Germany etc.—seem to be a privilege of those who live in neighbourhoods where upper occupational categories are highly concentrated. Those who studied in the UK and in Italy have a comparatively more even spatial distribution due to the large number of Greek students in these two countries, where during certain periods there were opportunities for more accessible studies in terms of cost, sometimes corresponding to lower academic standards.
The assumption that those who studied in countries of high academic standards and increased cost do not originate from the areas where they were registered in the 2011 census suggests that their settlement in the privileged parts of the city is the outcome of their good studies which affected positively their social mobility. Even though this may be true for some of them, this assumption is in contrast with the very low residential mobility in Athens and in Greece. Studies in these countries—and especially in their elite universities—are a privilege of upper and upper-middle strata who could afford the cost of such an educational trajectory. This is not contradicted by the rather small number of those originating from lower social groups and followed this path due to their high academic performance. Exceptions confirm the rules.
Those who studied in low cost neighbouring countries—like Bulgaria and Romania—follow a completely different pattern in terms of residential location. Their social background is very different and the same applies to the status of their residential areas. Moreover, those who studied in Albania are most probably former Albanian nationals, often of Greek ethnic origin, who obtained Greek citizenship in the 2000s.
Finally, the spatial distribution of those who did not study in Greece or abroad is similar to that of those with low educational credentials.
Table 2.3 shows the number and the percentage of Greek citizens aged 23-67 living in Athens who studied abroad. The table includes all countries where more than 1000 Greek degree holders studied, according to the 2011 census.
Table 2.3: Greek citizens aged 23-67 living in Attiki (except islands) holding higher education degrees by country of studies (2011) 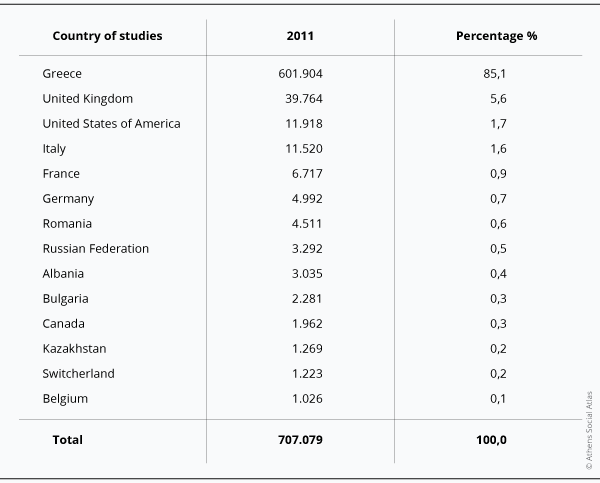
Data source: EKKE-ELSTAT (2015)
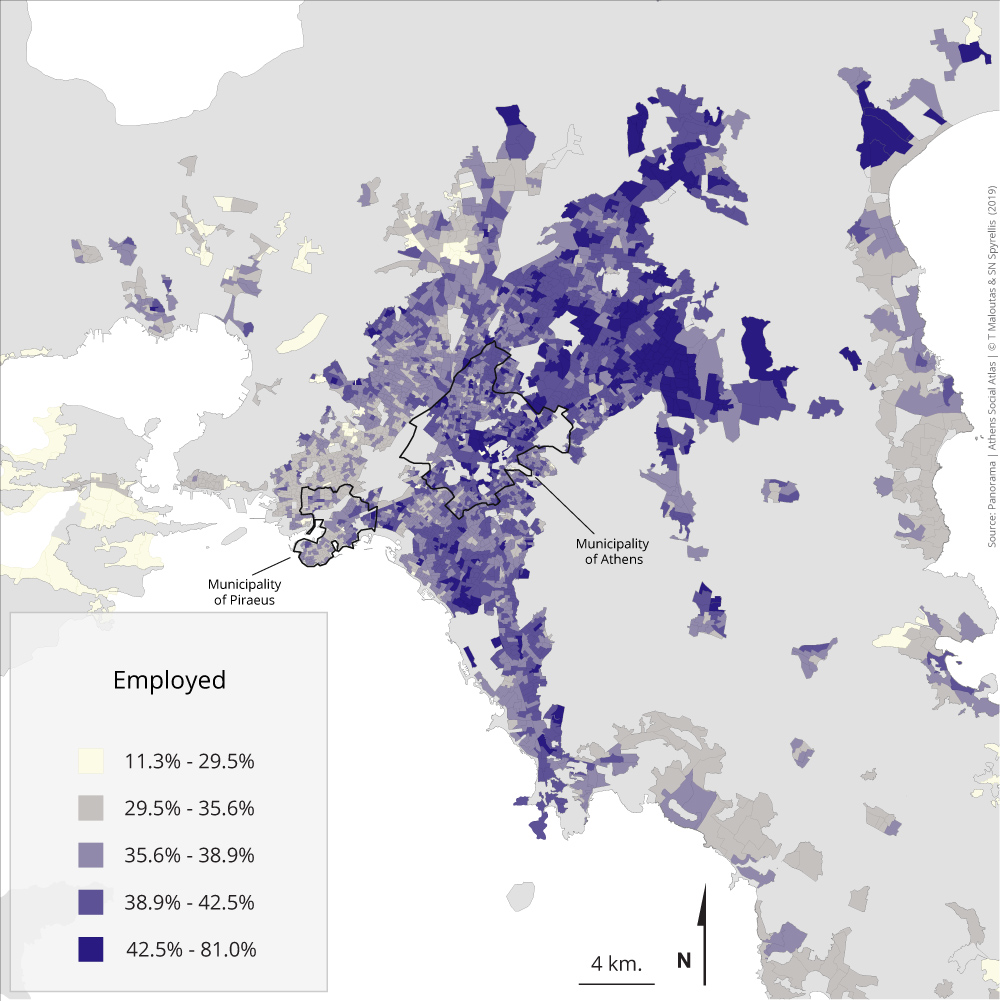
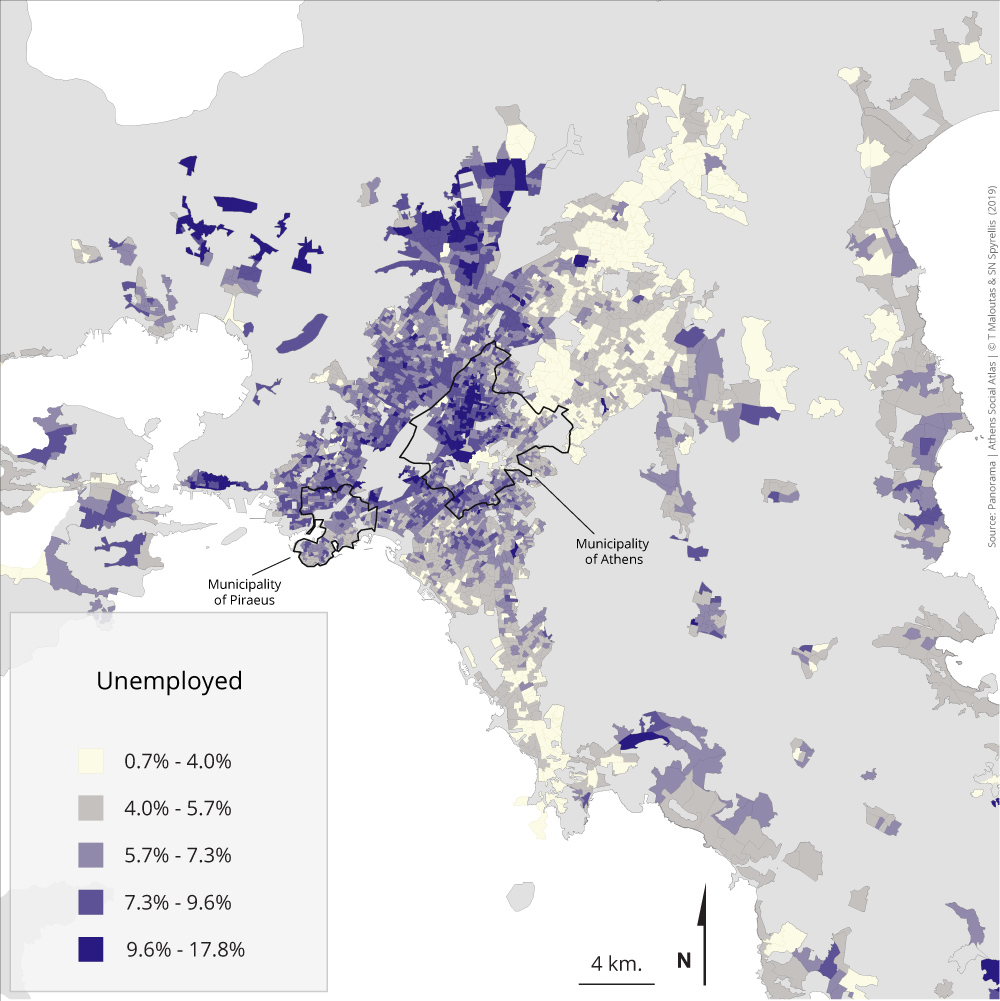
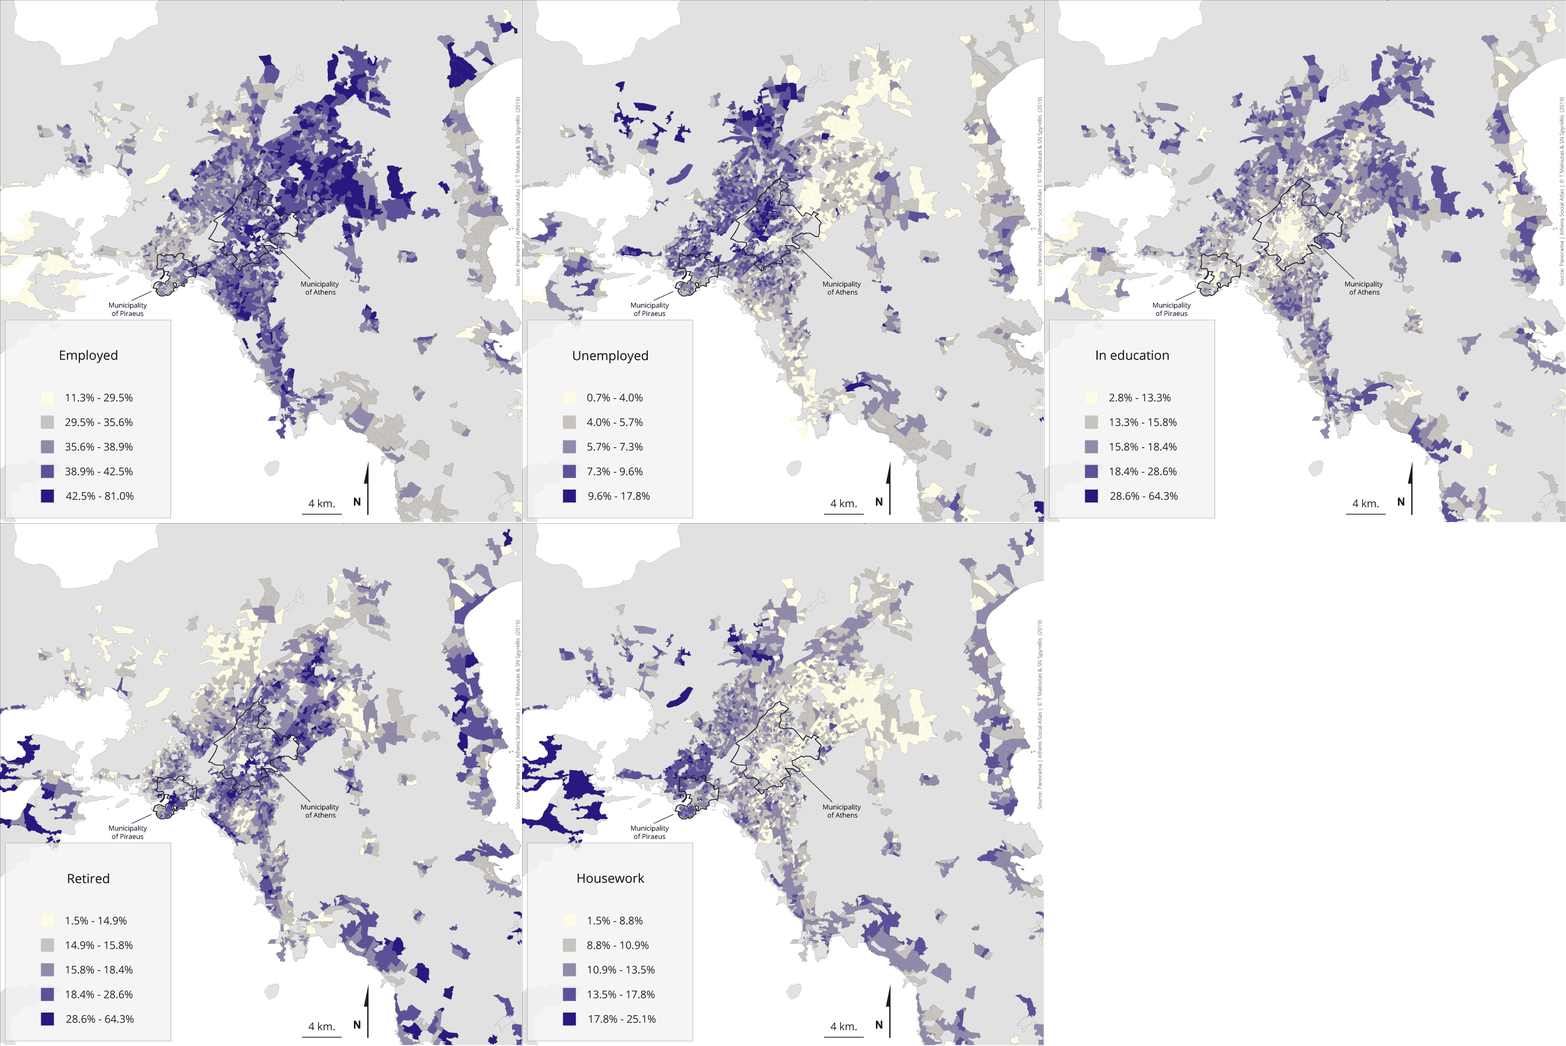
Maps 3.1.1 – 3.1.5: Population distribution by main activity and area of residence (2011)
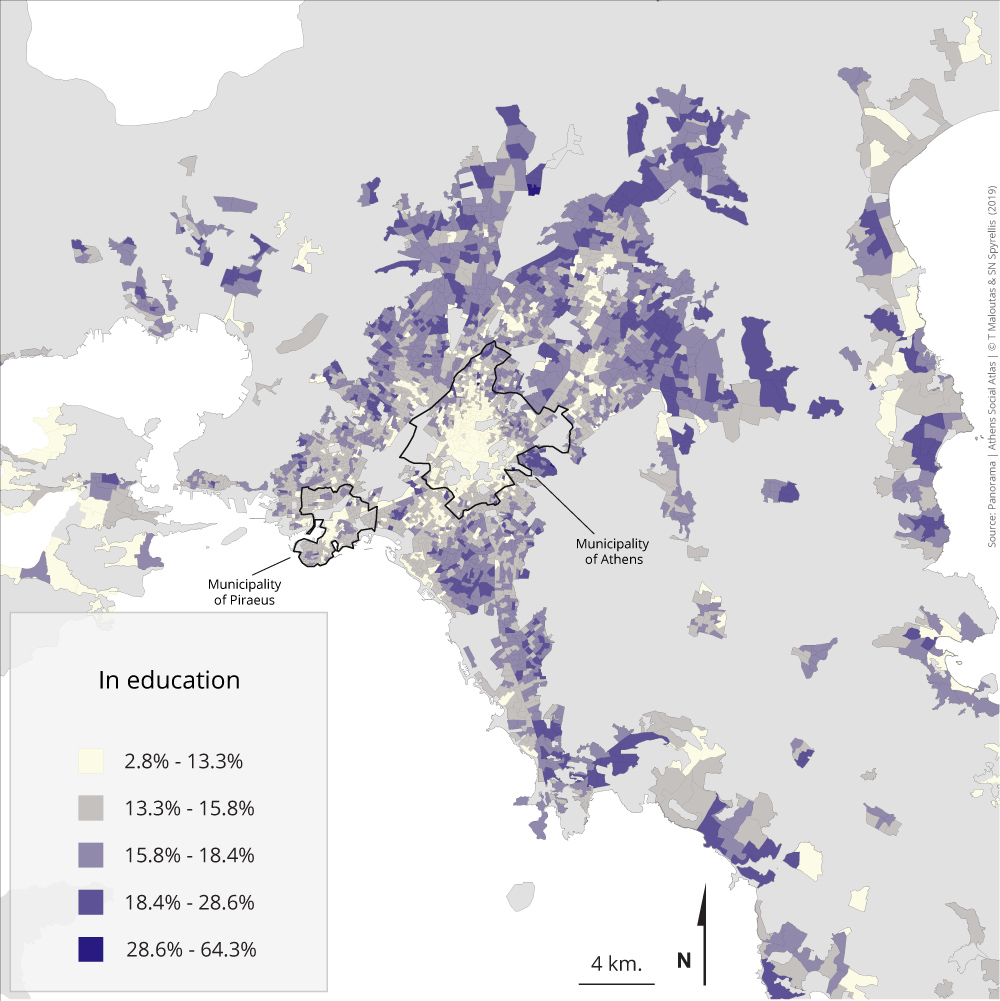
The spatial distribution of the population of Athens according to their main activity brings to the fore a number of issues not necessarily related to the activity itself. For example, the fact that pupils and students are highly concentrated in peripheral areas of the metropolis, is not due to their student activity, but due to their young age. Adolescents and children are mainly gathered in peripheral areas as part of the nuclear families they belong to.
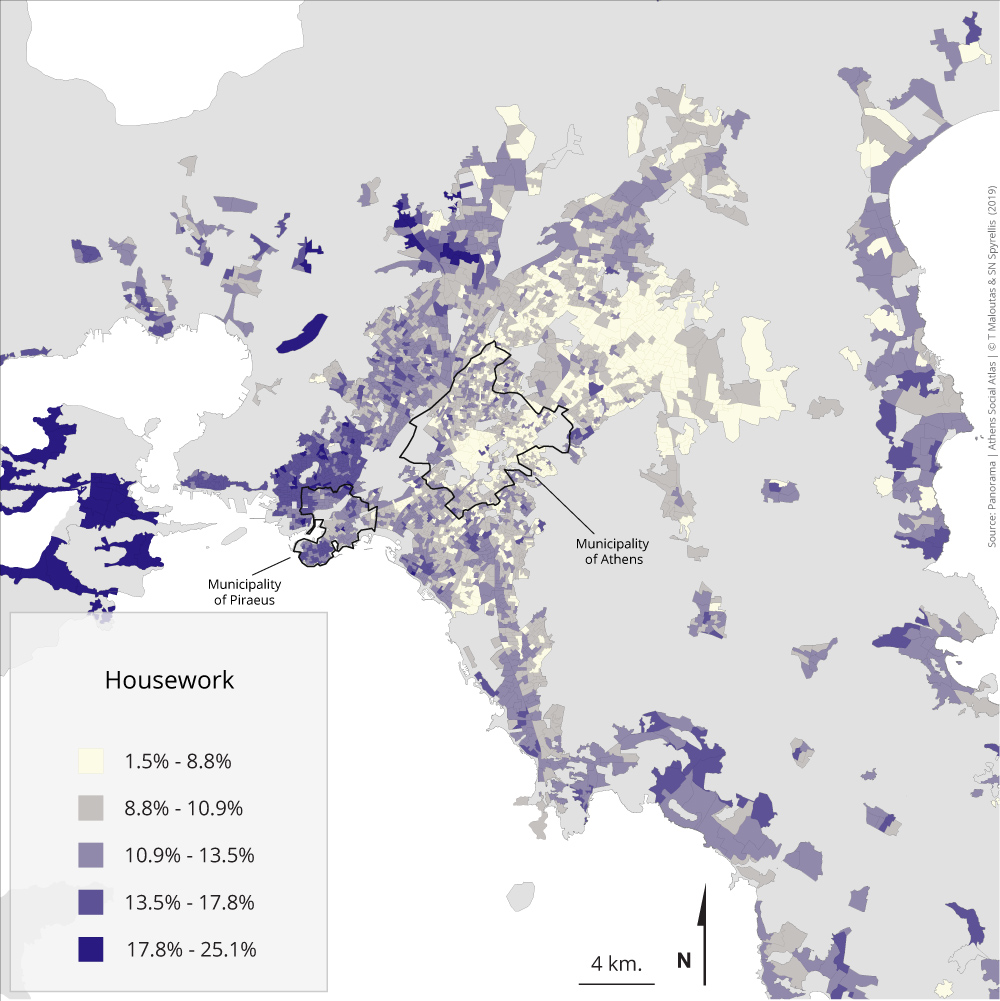
Those in employment are rather evenly distributed in the space of the city. However, the western part of the metropolis and the distant periphery display lower percentages for two main reasons. The first is unemployment, which is unevenly concentrated in the western part—the crisis has increased this unevenness—and in some parts of the distant periphery. The second is the reduced employment rate for women in the western part and the distant periphery, as illustrated by the mapping of women with the household being their main activity.
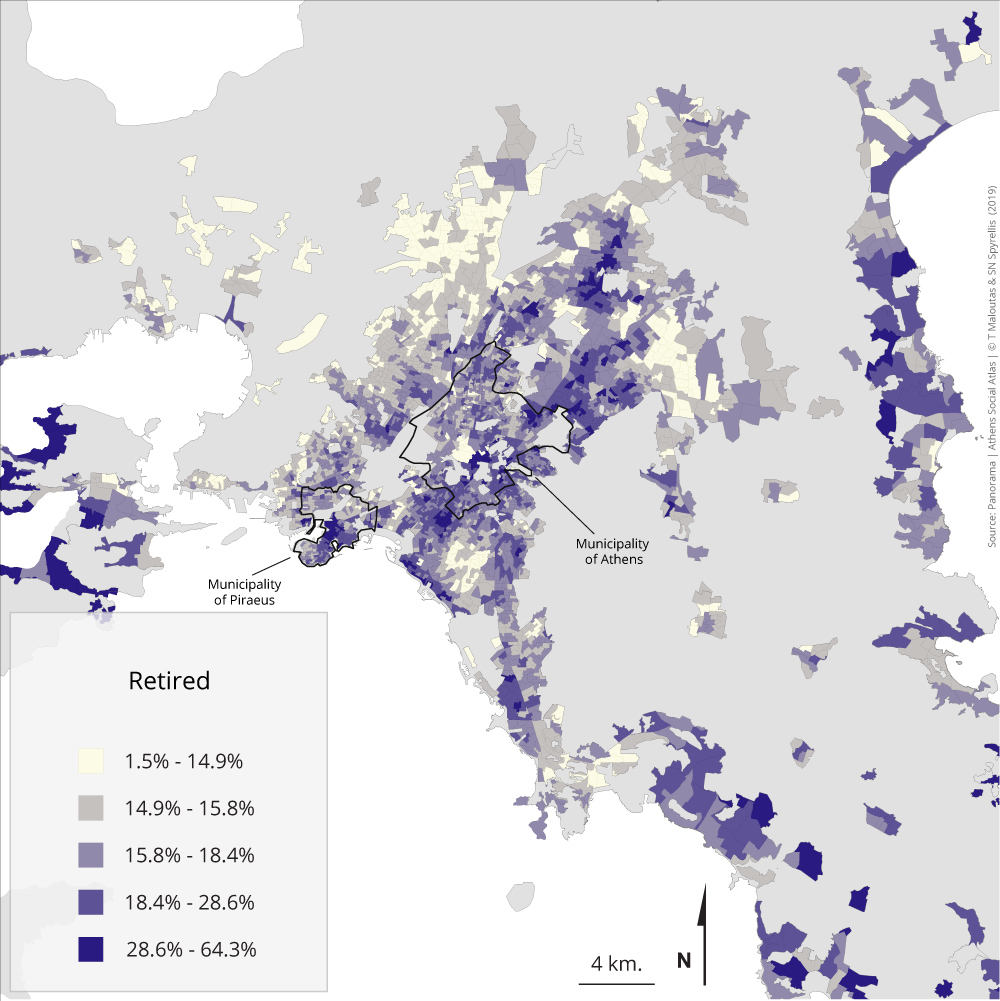
Pensioners are mostly present in the areas of the elderly, i.e. in the upper and upper-middle class suburbs and in the coastal zones of the region, as well as in the island of Salamina.
Table 3.1 shows main activity categories of the population in the metropolis for 1991 and 2011. Categories that were not common for the two censuses (e.g. military service) are omitted from the table.
Table 3.1: Population of Attiki (except islands) by main activity 1991-2011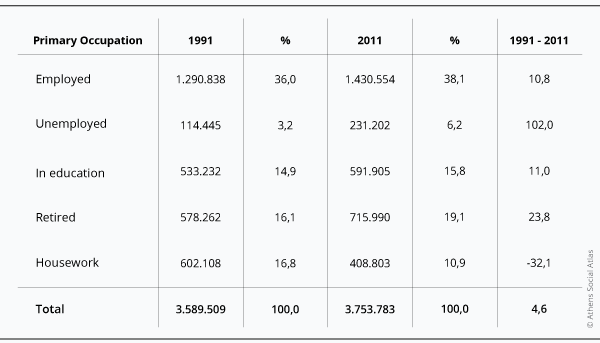
Data source: EKKE-ELSTAT (2015)
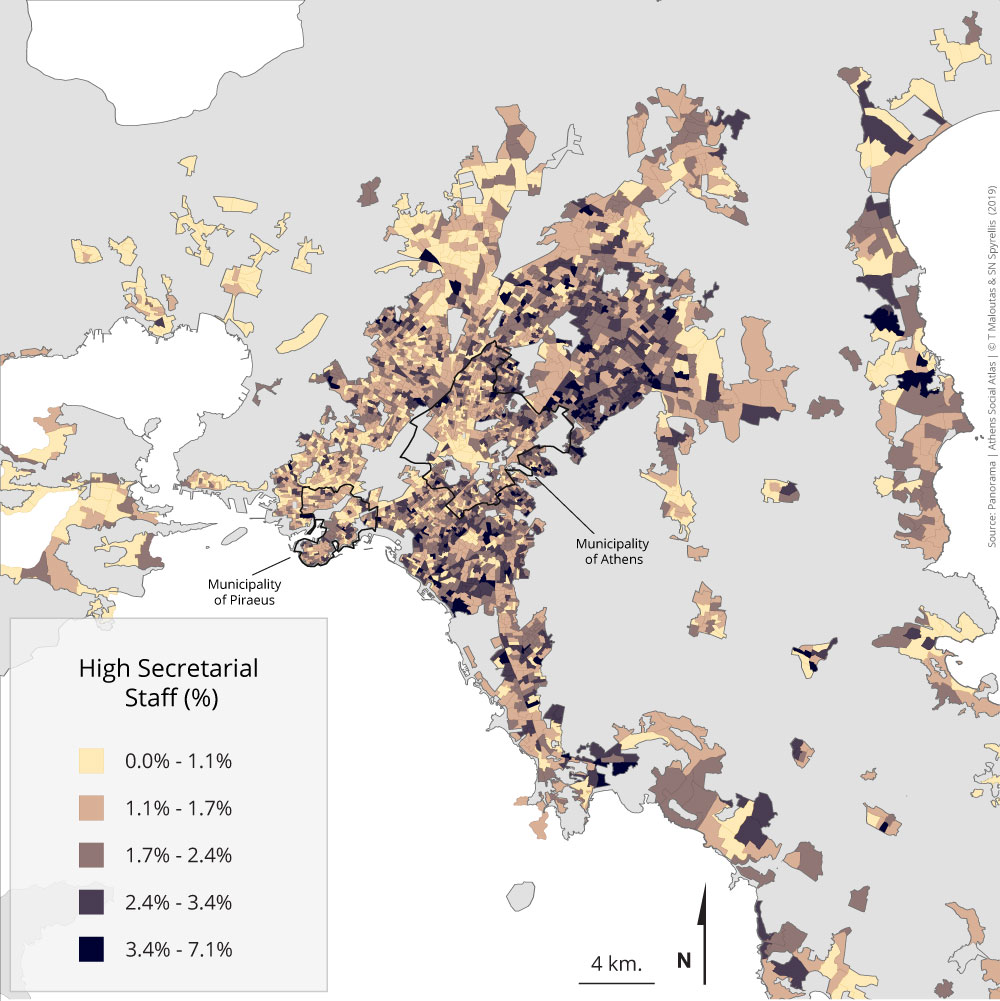
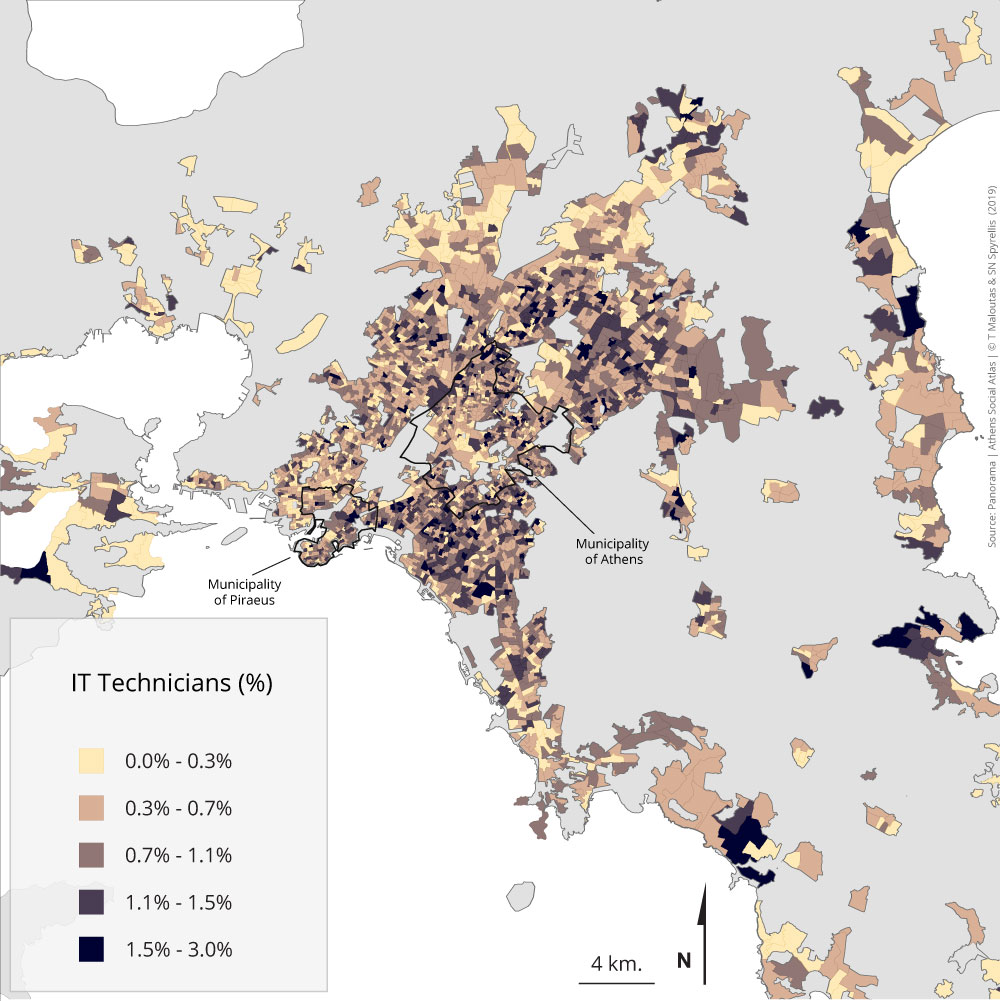
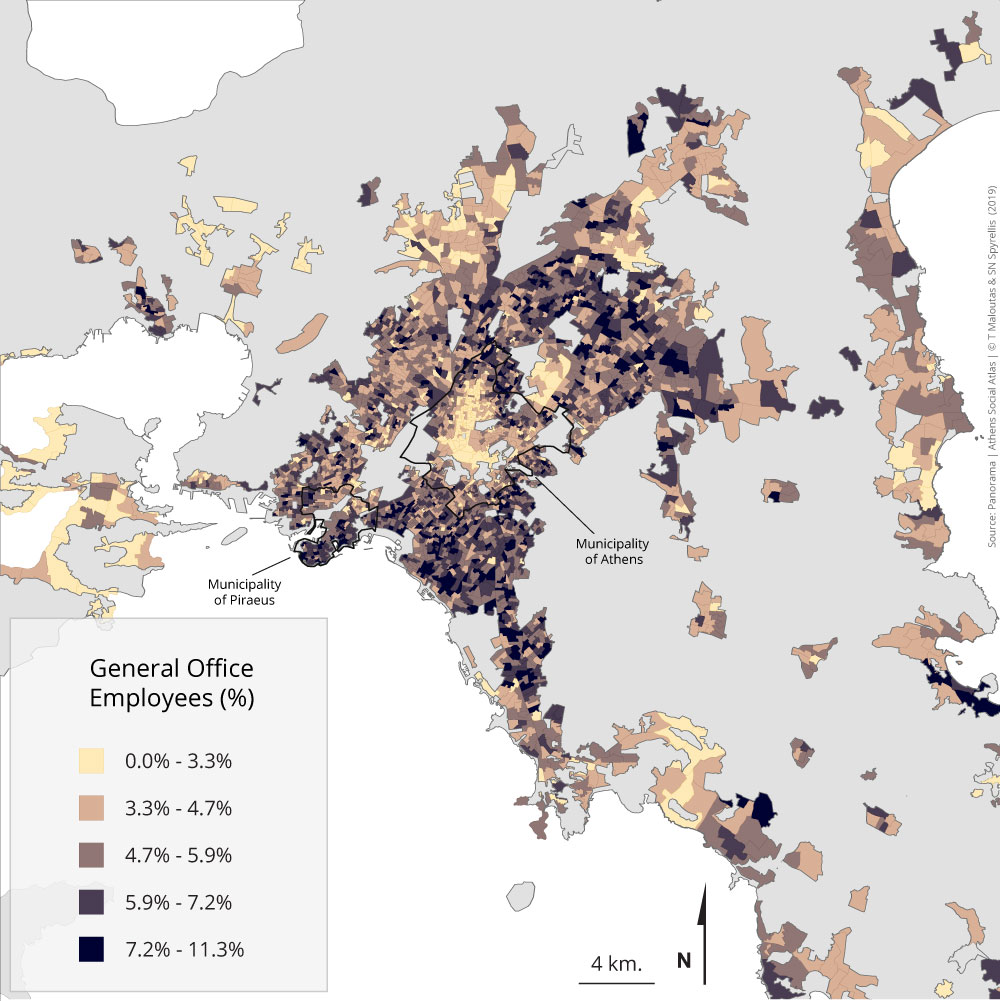
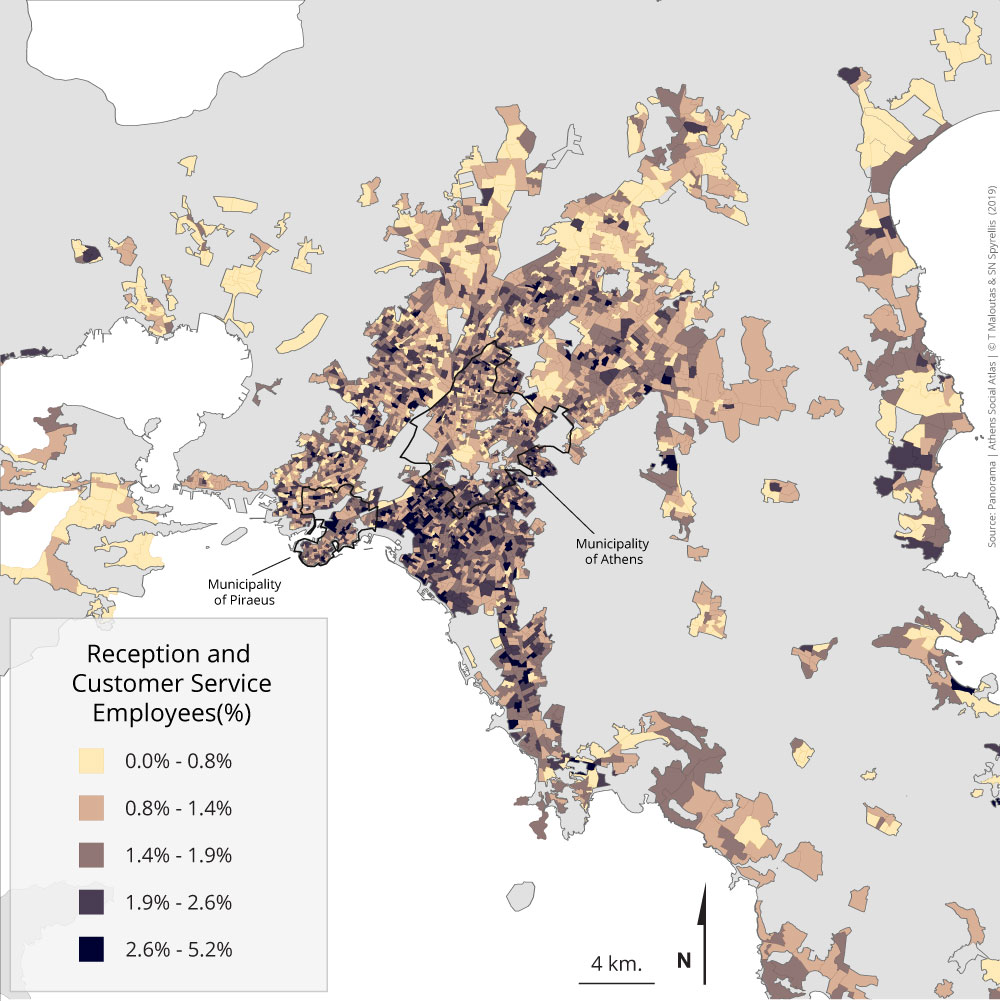
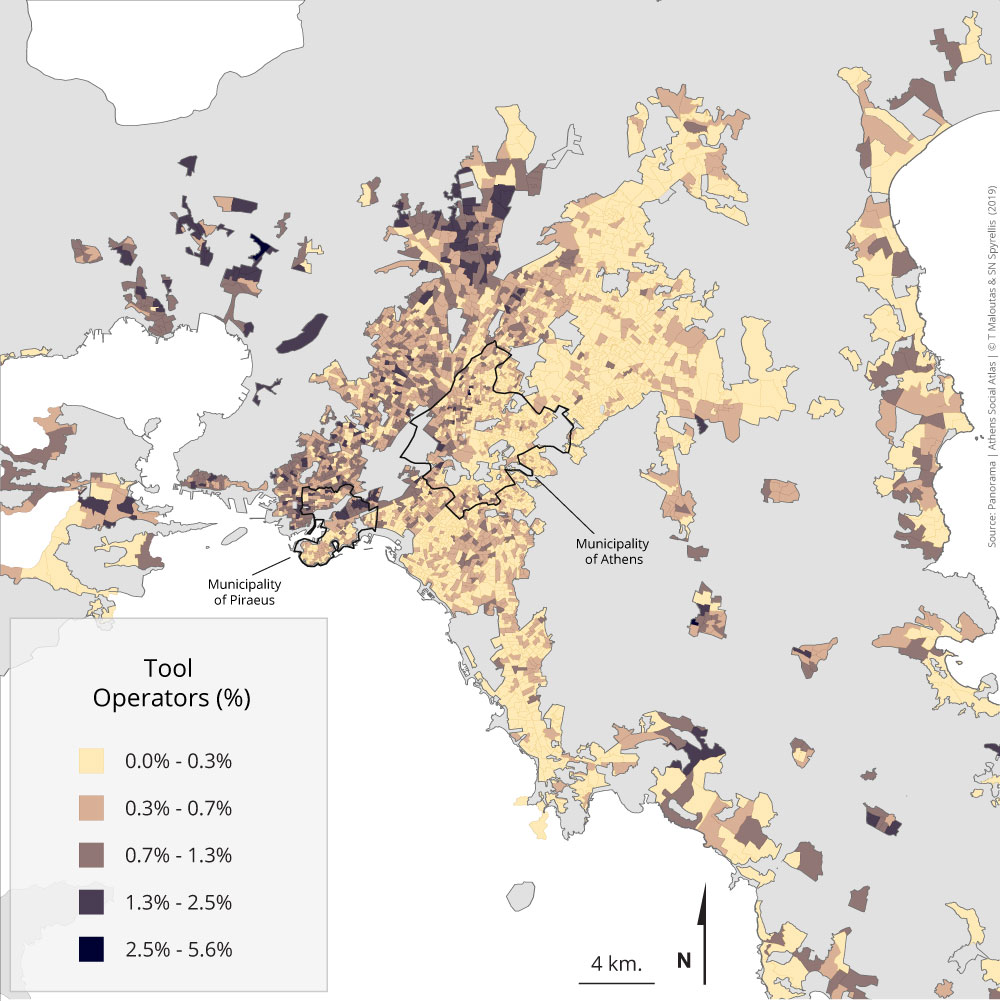
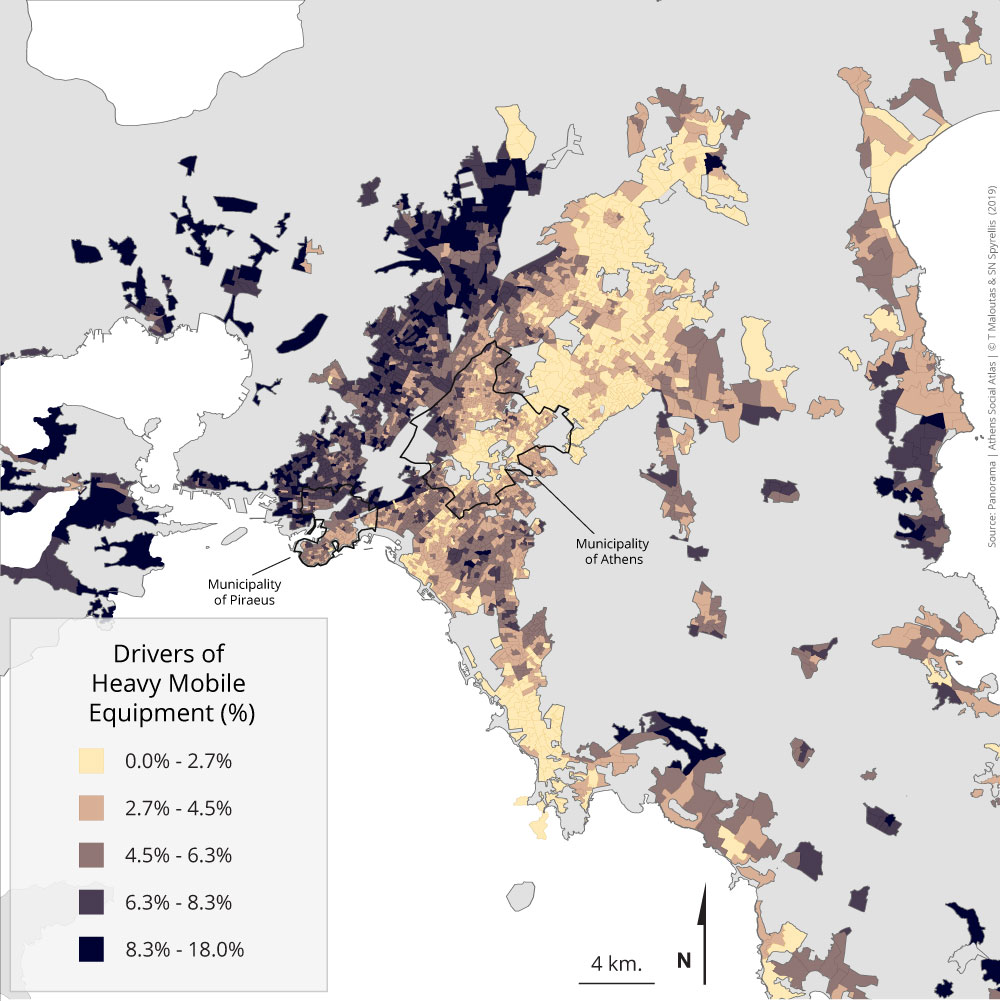
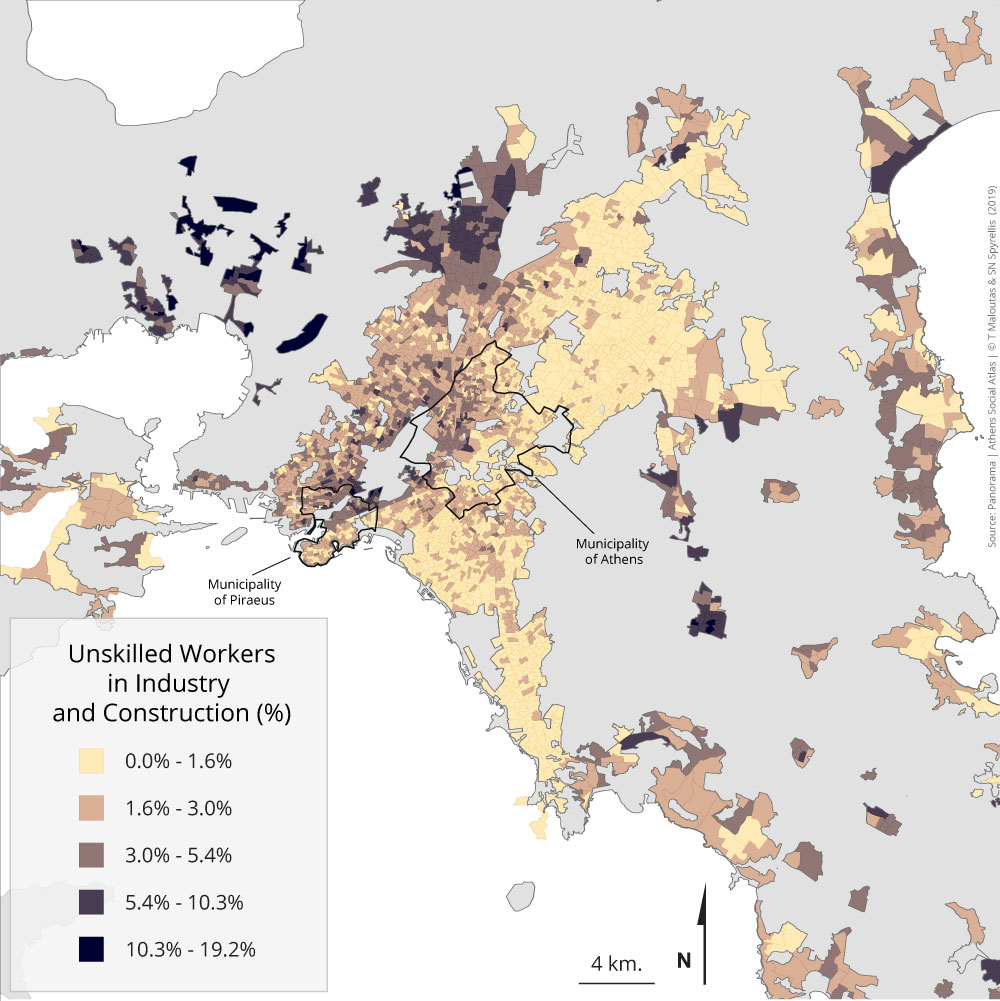
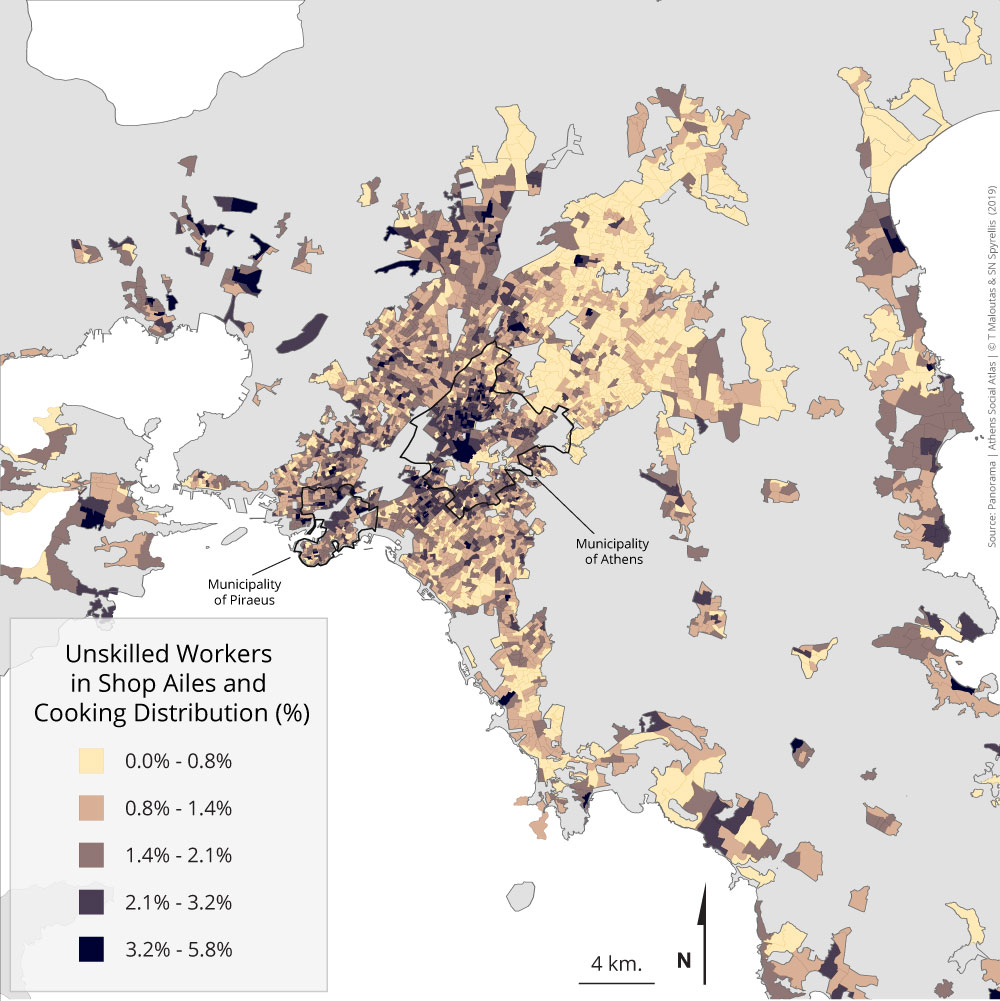
Maps 3.2.1 – 3.2.39: Distribution of the active population by occupational category and area of residence (2011)
The analysis of social hierarchies based on occupational categories is the most comprehensive manner since these categories are related to economic, cultural and social capital at the same time. This is something which other categories—like income categories—can provide in a rather unidimensional way. Moreover, occupational categories refer to positions within a system of production, something that simple income or education level categories cannot adequately reveal.
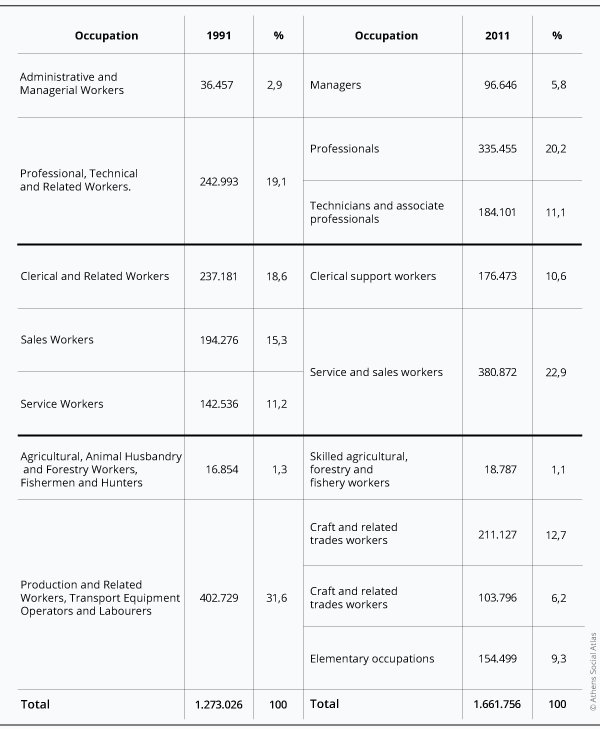
A problem in putting together this section was the difficulty to compare data among different censuses. This is due to the important changes in the international classification models of occupations every 20 years (ISCO-International Standard Classification of Occupations) of the International Labour Office (ILO), which make comparison a challenging process. The Greek census of 1991 was based on the ISCO68 model; the one of 2001 on the ISCO88 model and that of 2011 on the ISCO08 model. However, the broad lines of the changing trend for the main (1-digit) occupational categories between 1991 and 2011 are presented in the following table (table 3.2), even though with some important error margins.
Table 3.2: Distribution of the active population of Attiki (except islands) by 1-digit occupational categories 1991-2011
Data source: EKKE-ELSTAT (2015)
The table above allows a broad comparison of occupational categories between 1991 and 2011. The higher occupational categories in 1991—the two first on the table—accounted for 22,0% of the active population. Their content corresponds to the first three categories of 2011 who accounted for 37,1%. In the opposite side of the occupational hierarchy, the two last categories for 1991 comprised 32,9% of the active population. They corresponded to the four last categories of 2011 and to 29,3% of the active population. This means that the general pattern of change for the occupational categories between 1991 and 2011 shows a considerable increase of higher categories, a limited loss of lower categories and a considerable decrease of intermediate ones. However, the inclusion of an important part of intermediate categories to the higher ones—technicians, technical assistants of liberal professionals etc. that were part of higher groups in 1991—reduces the significance of our previous conclusions.
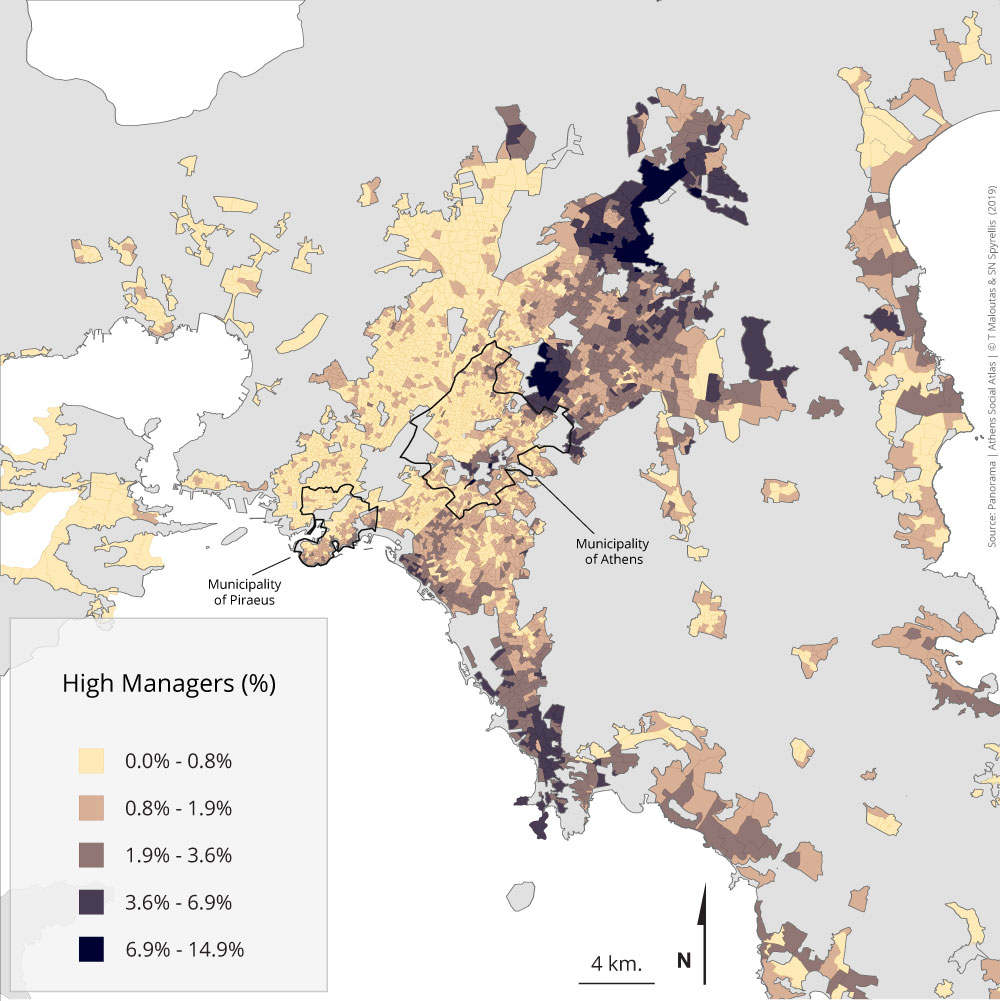
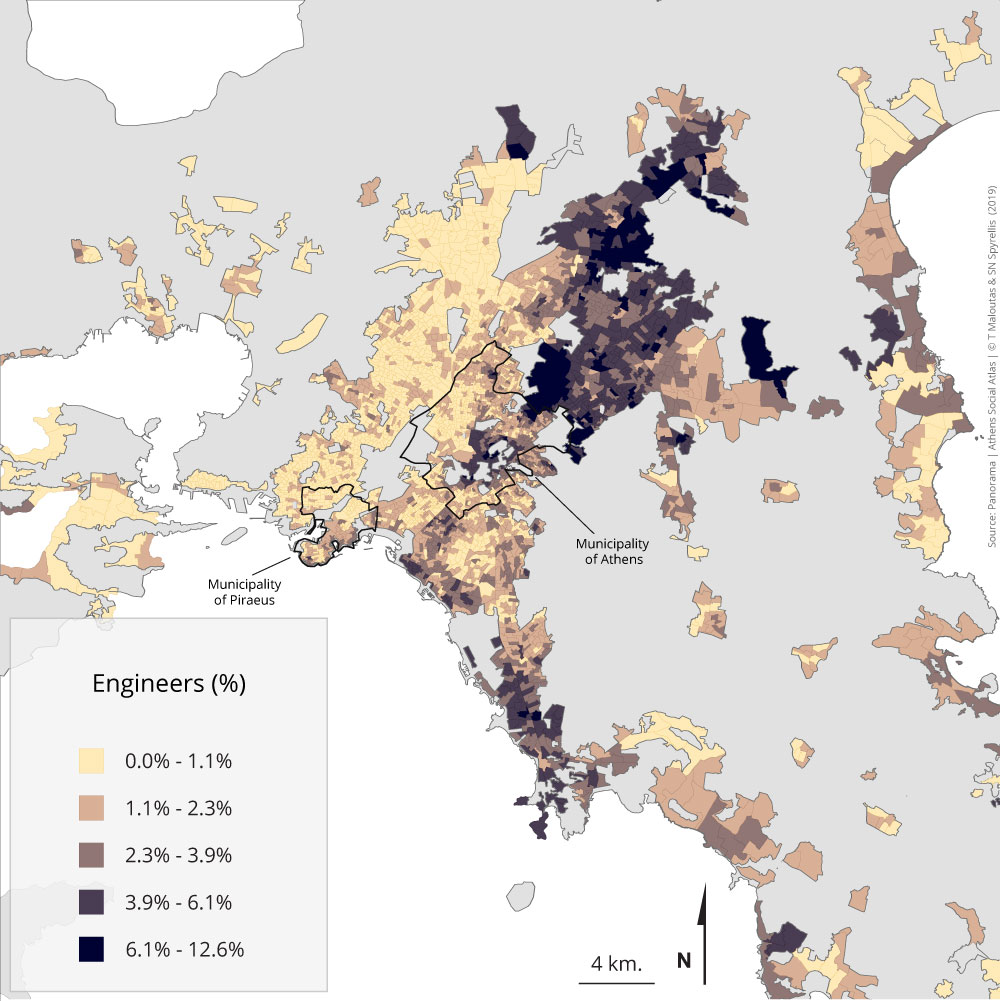
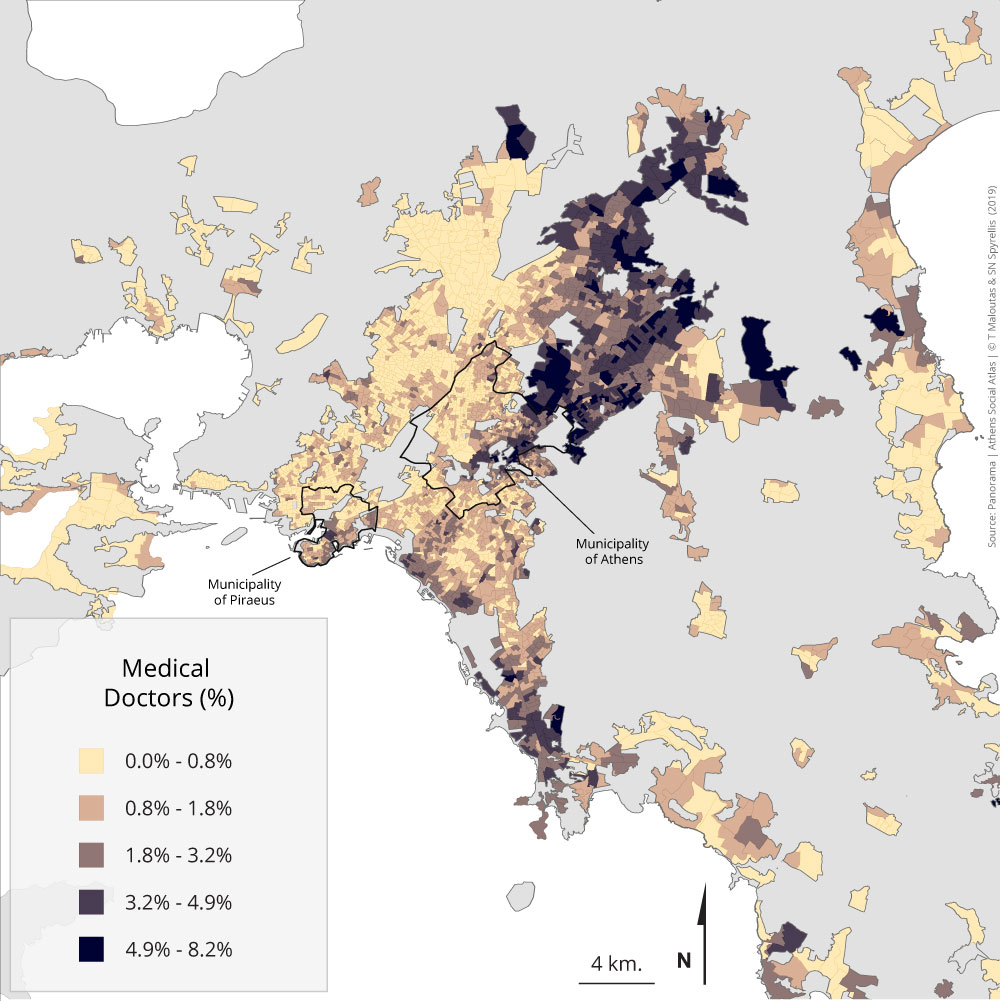
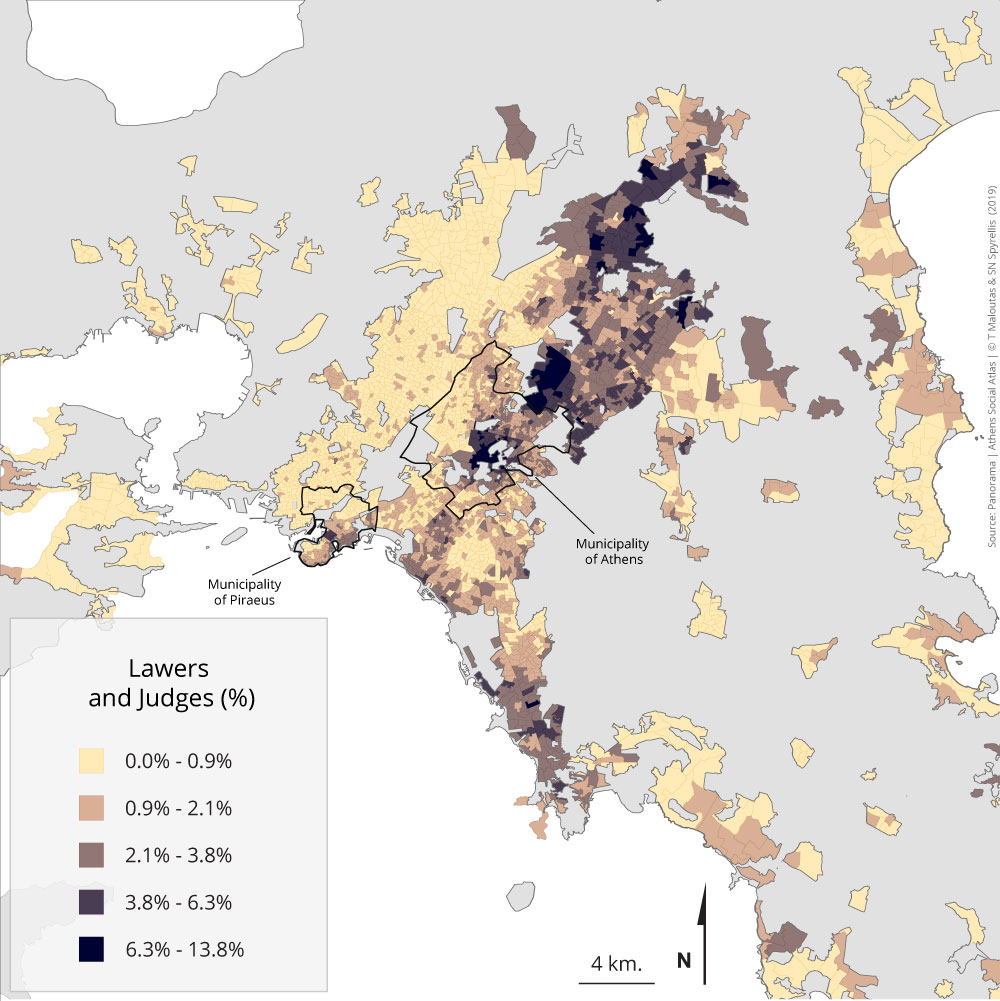
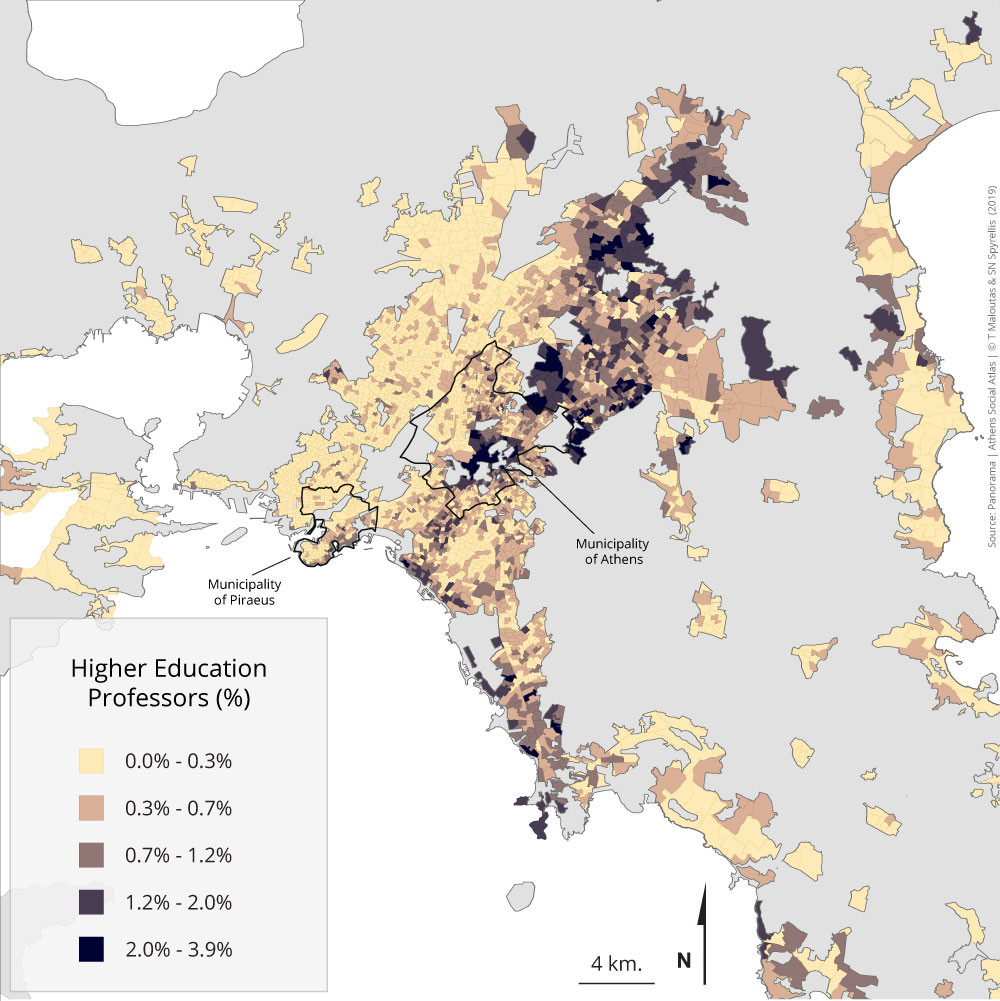
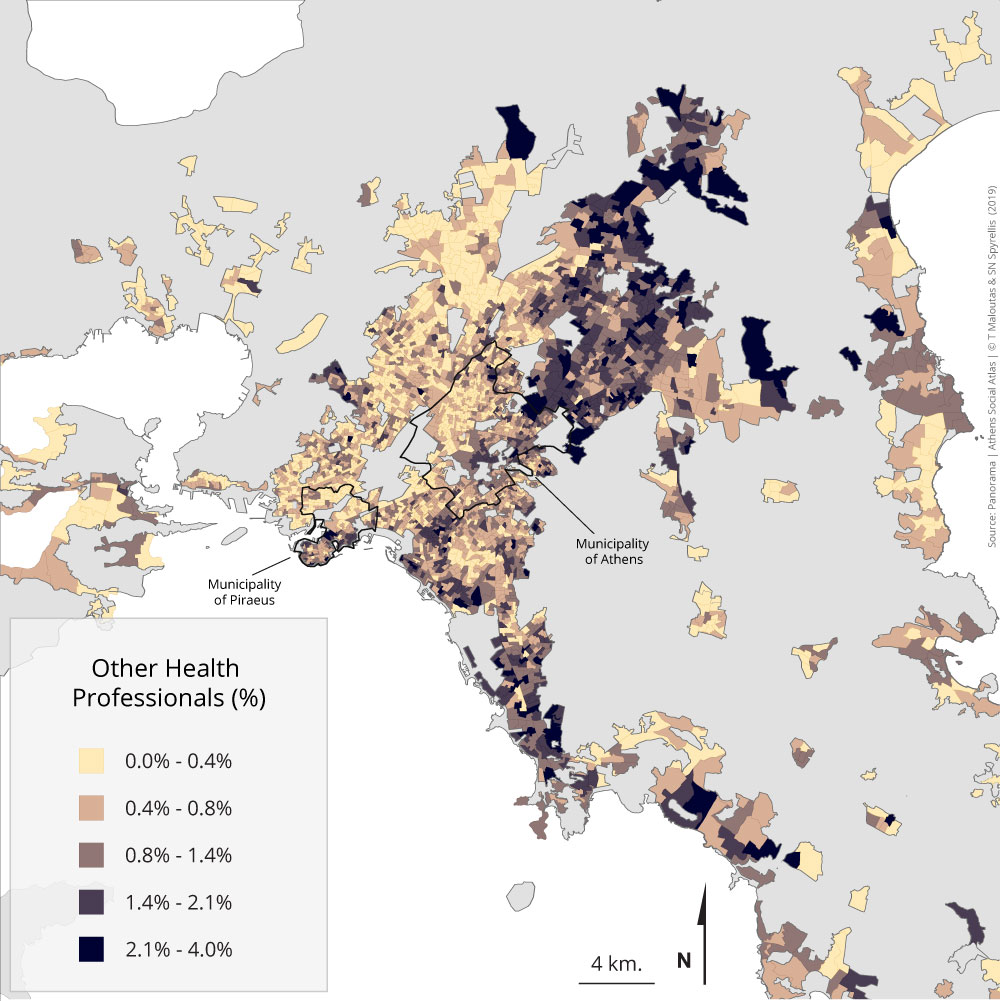
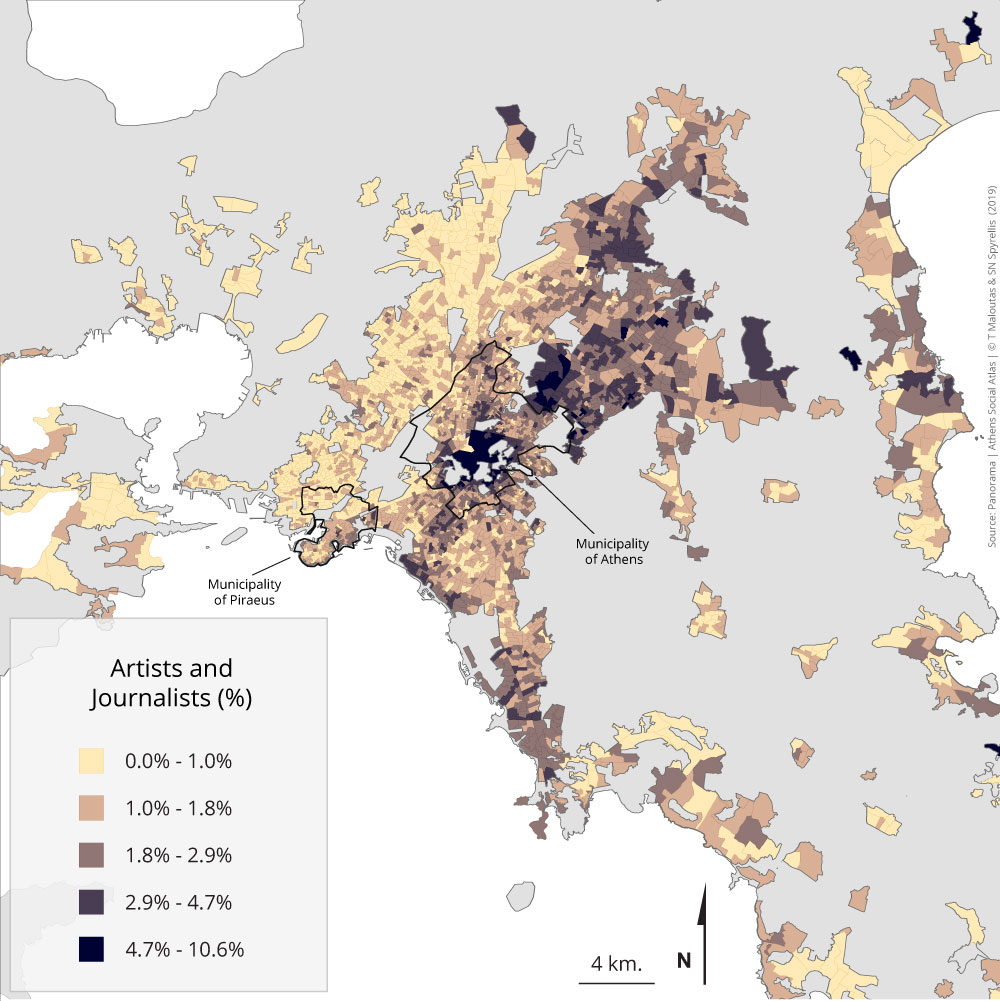
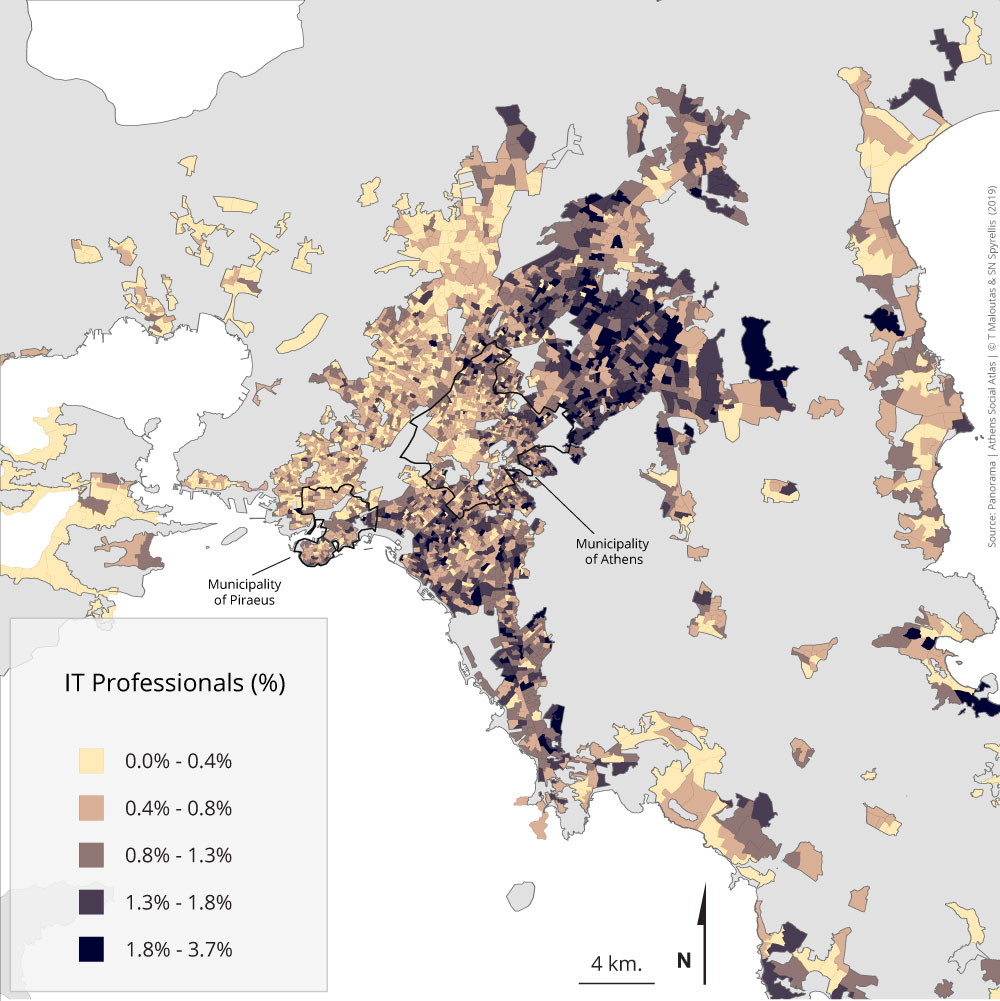
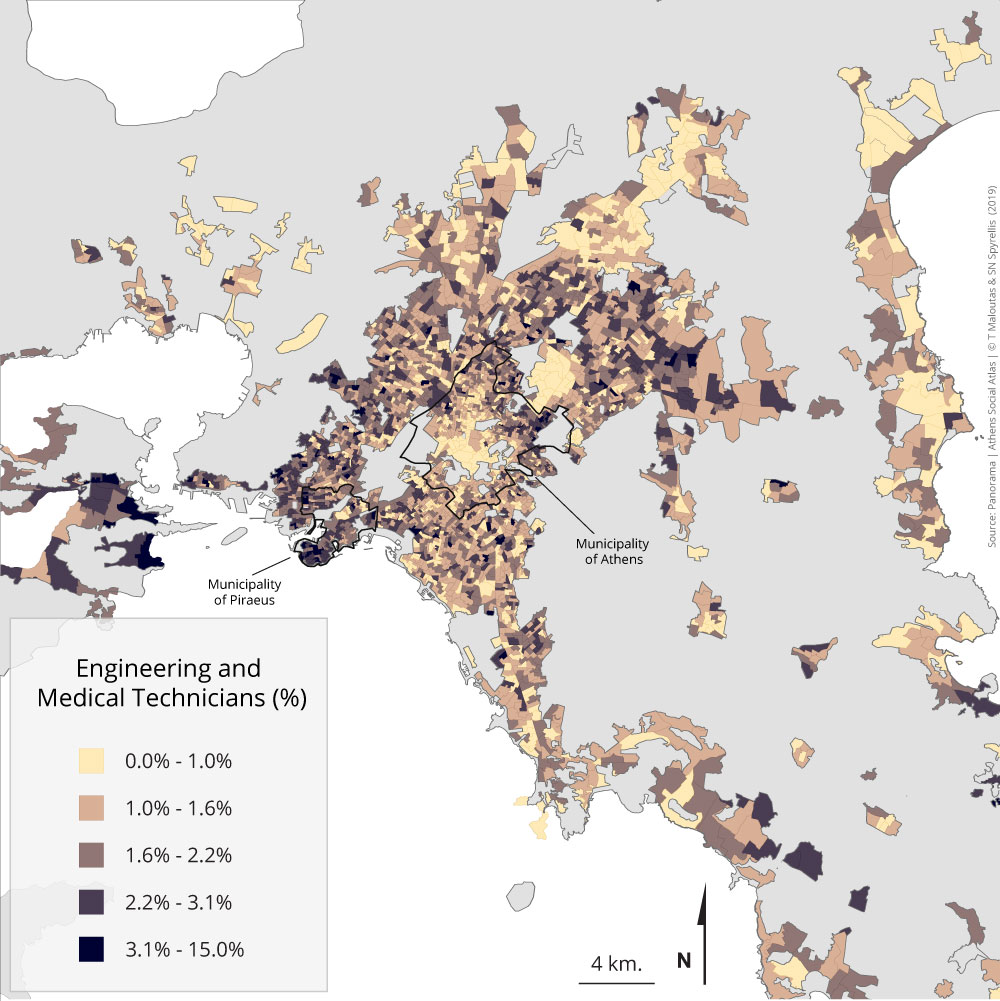
The 39 maps in this section refer to higher occupational categories—like top managers, engineers, medical doctors and lawyers—to intermediate categories—like technicians, office employees and salespersons—and to lower ones—like skilled and unskilled workers. The maps are in the sequence the ILO (ISCO) and ELSTAT register occupational categories (from higher to lower). However, these hierarchies are neither absolute and stable nor obvious.
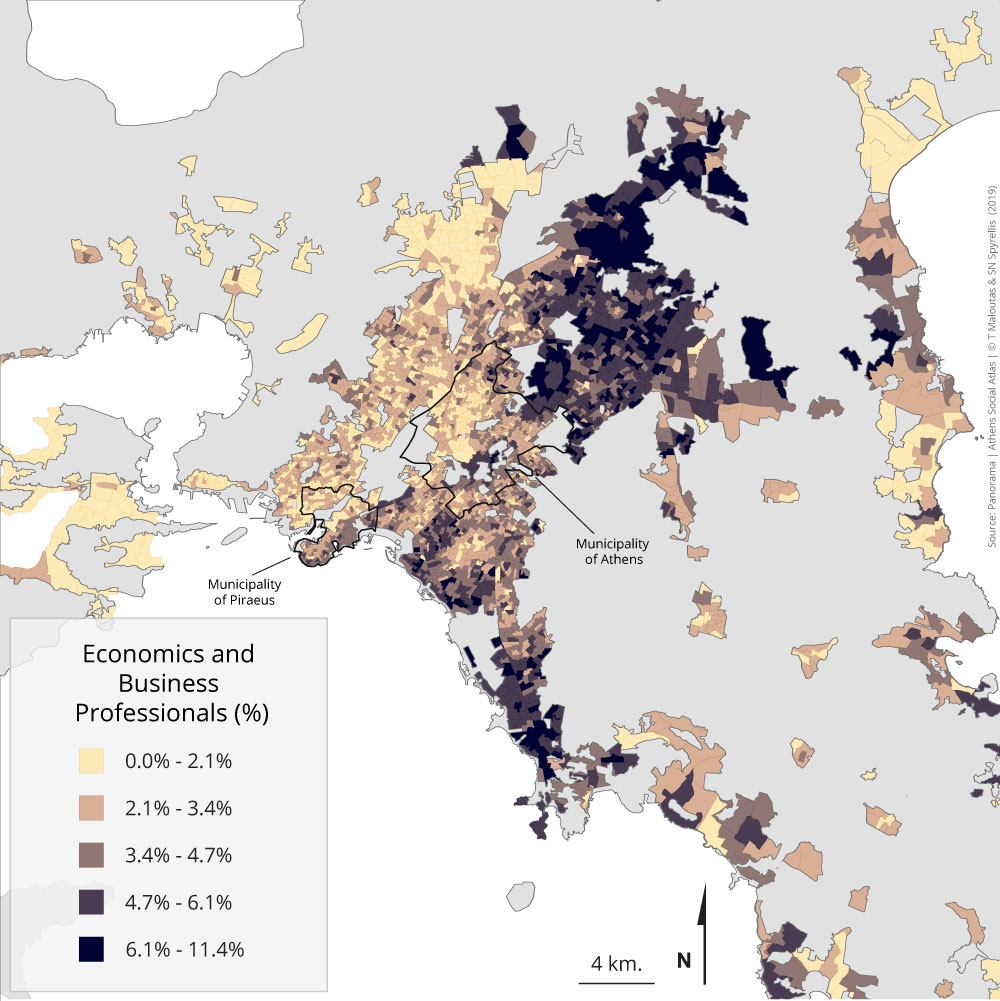
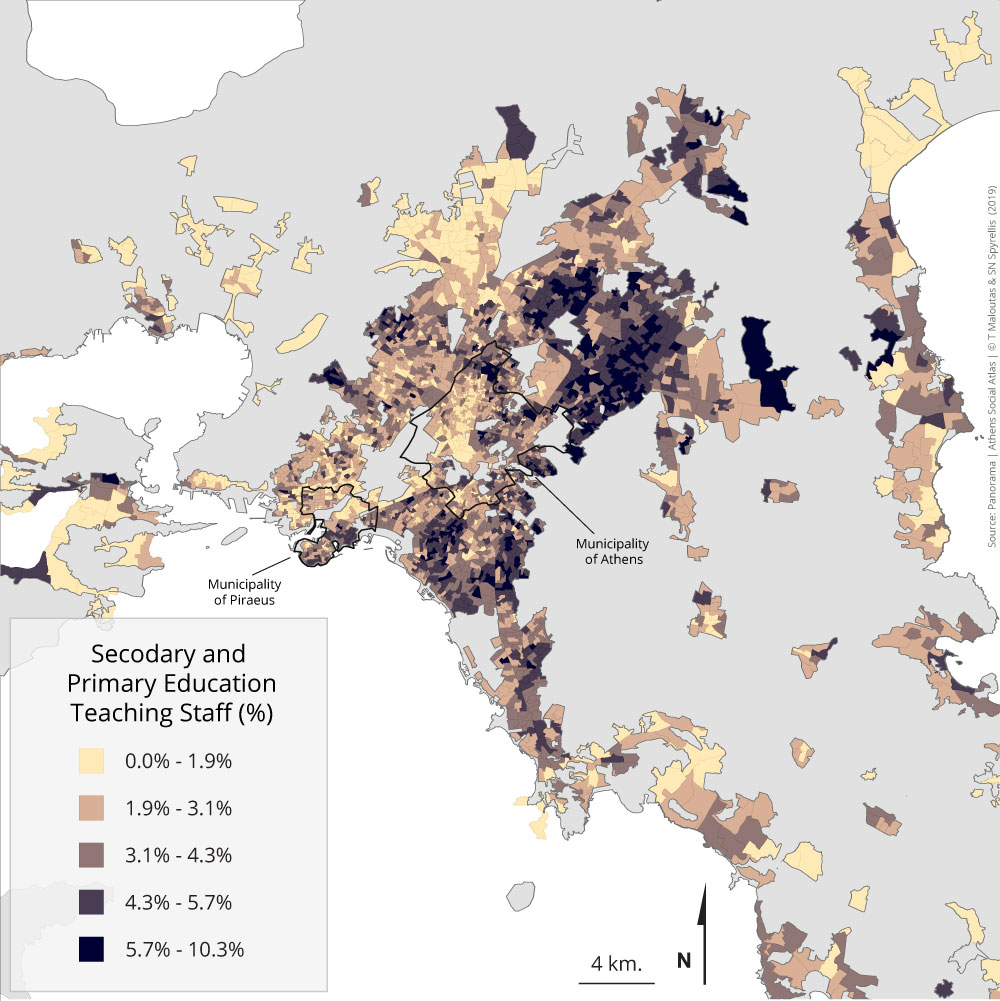
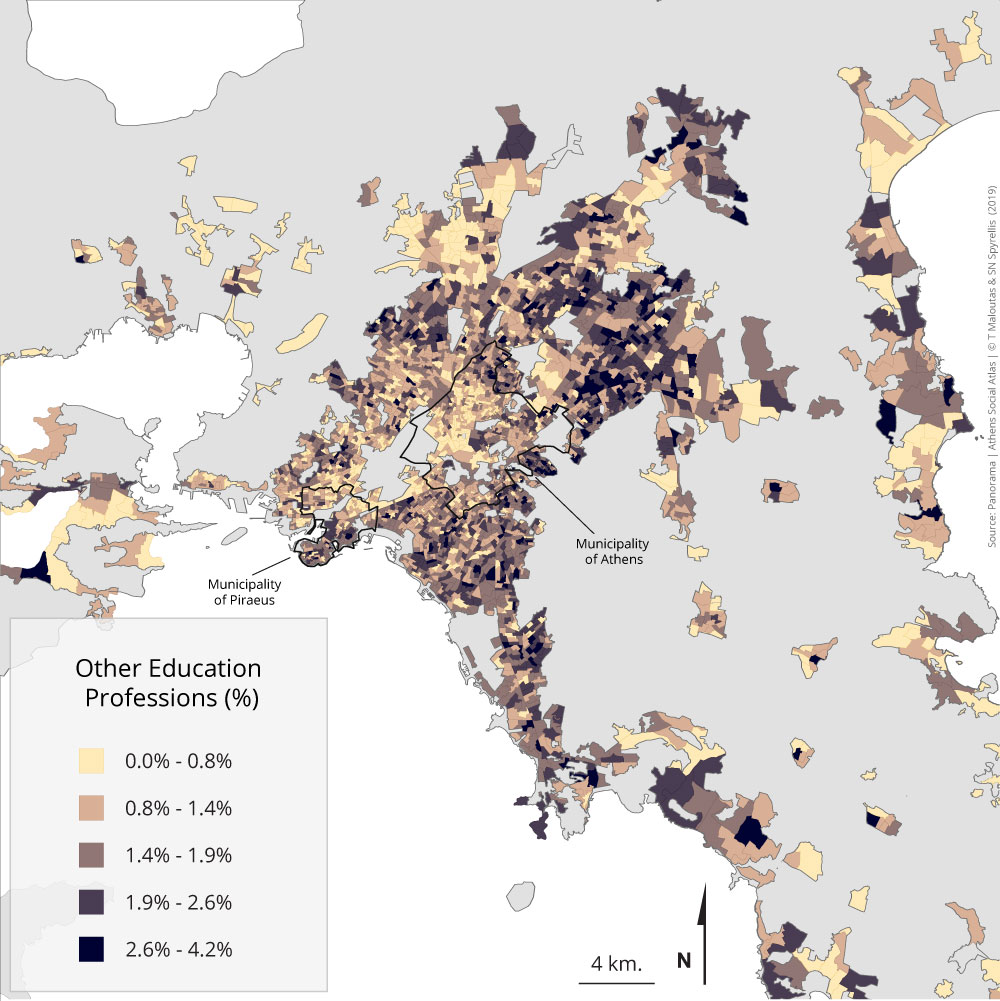
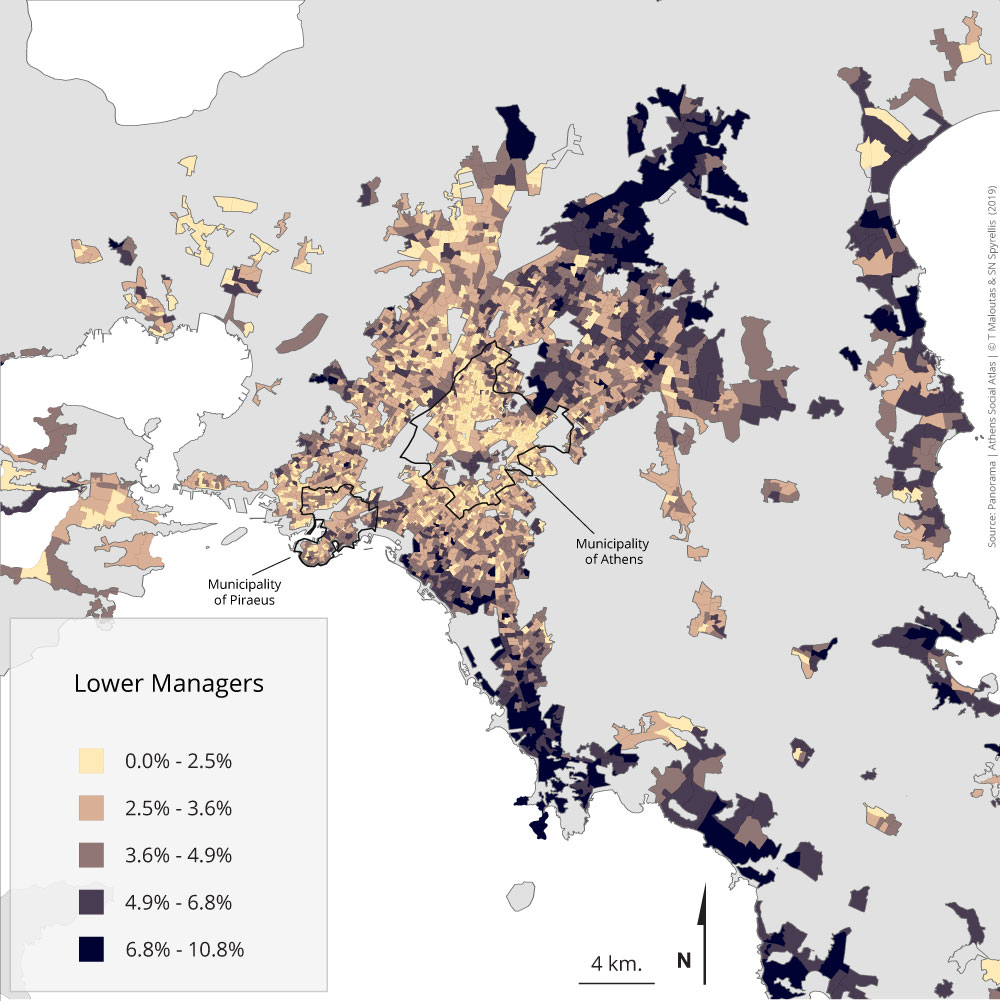
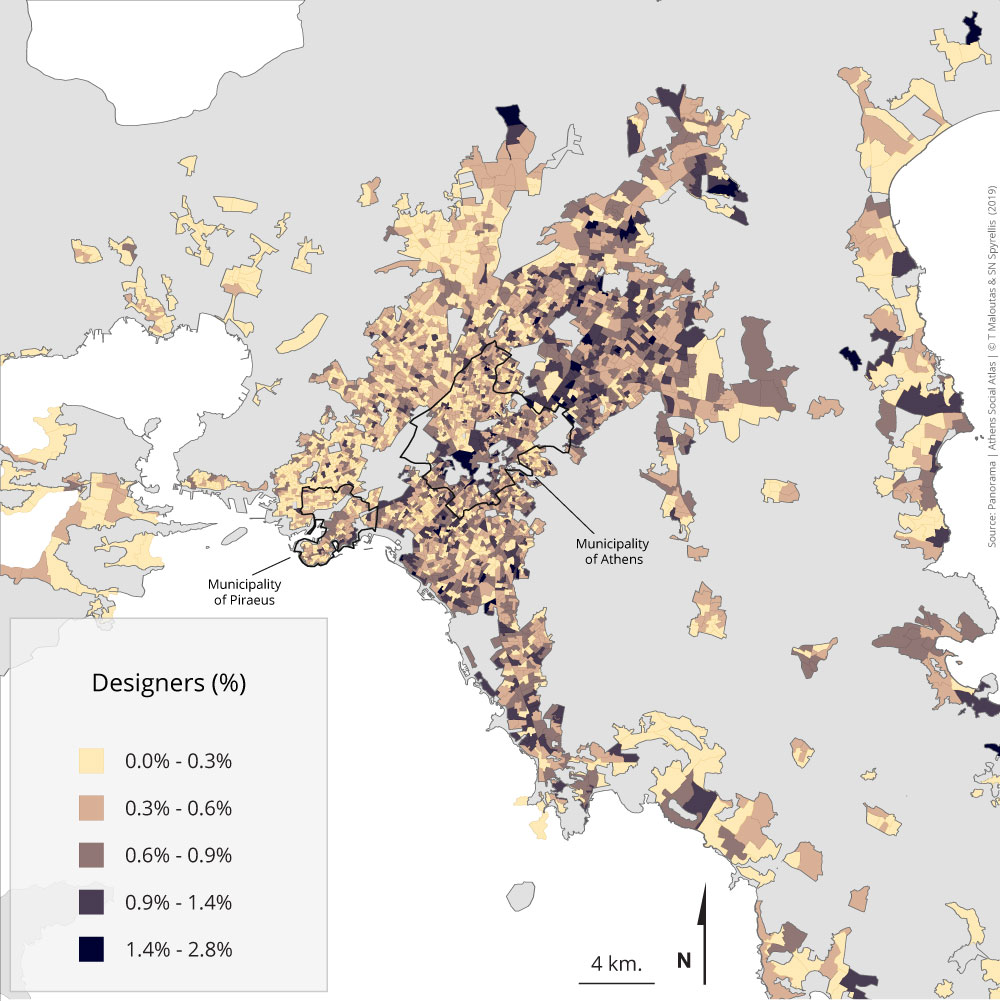
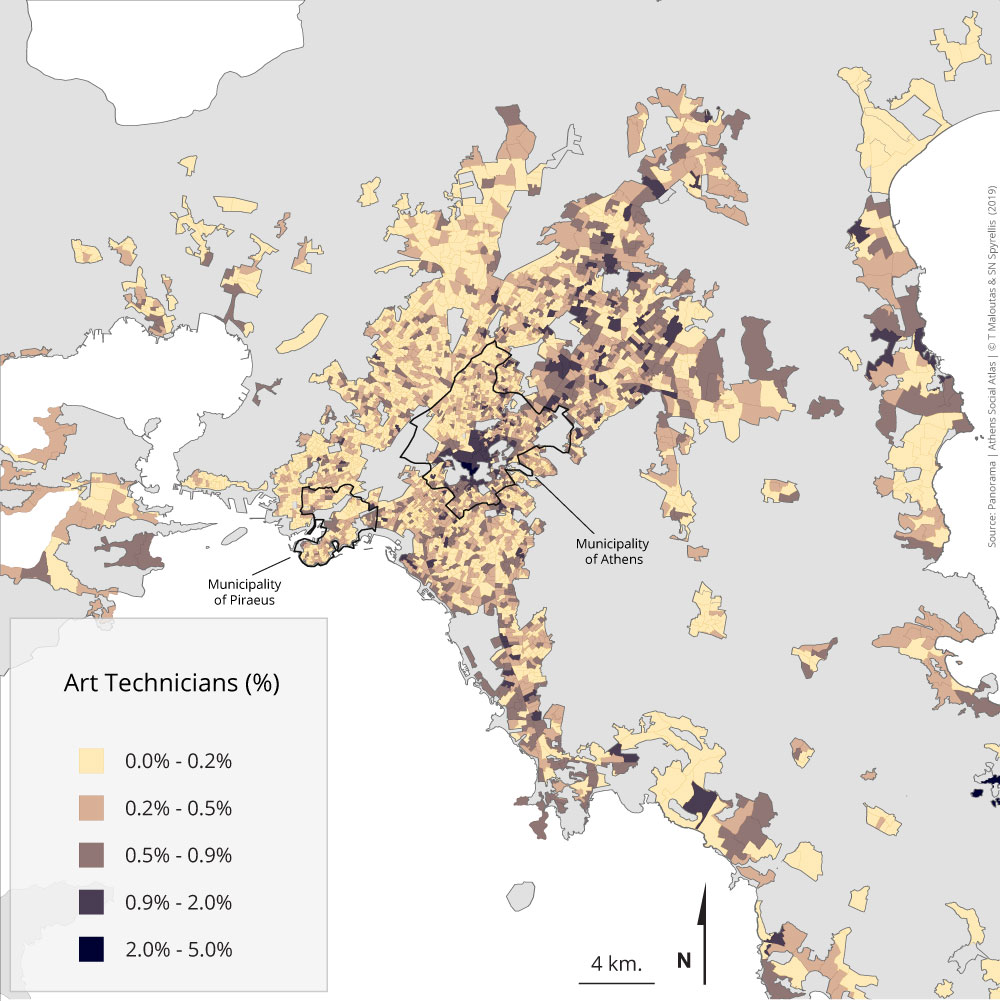
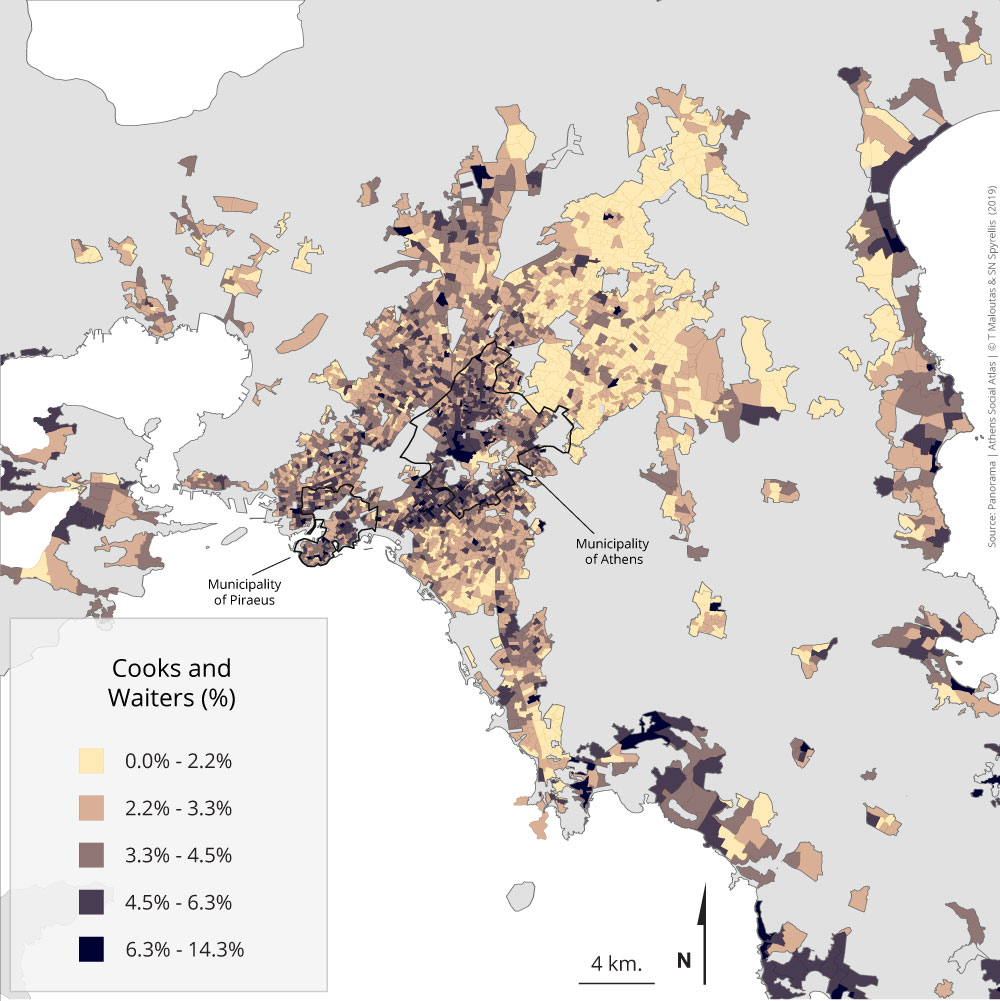
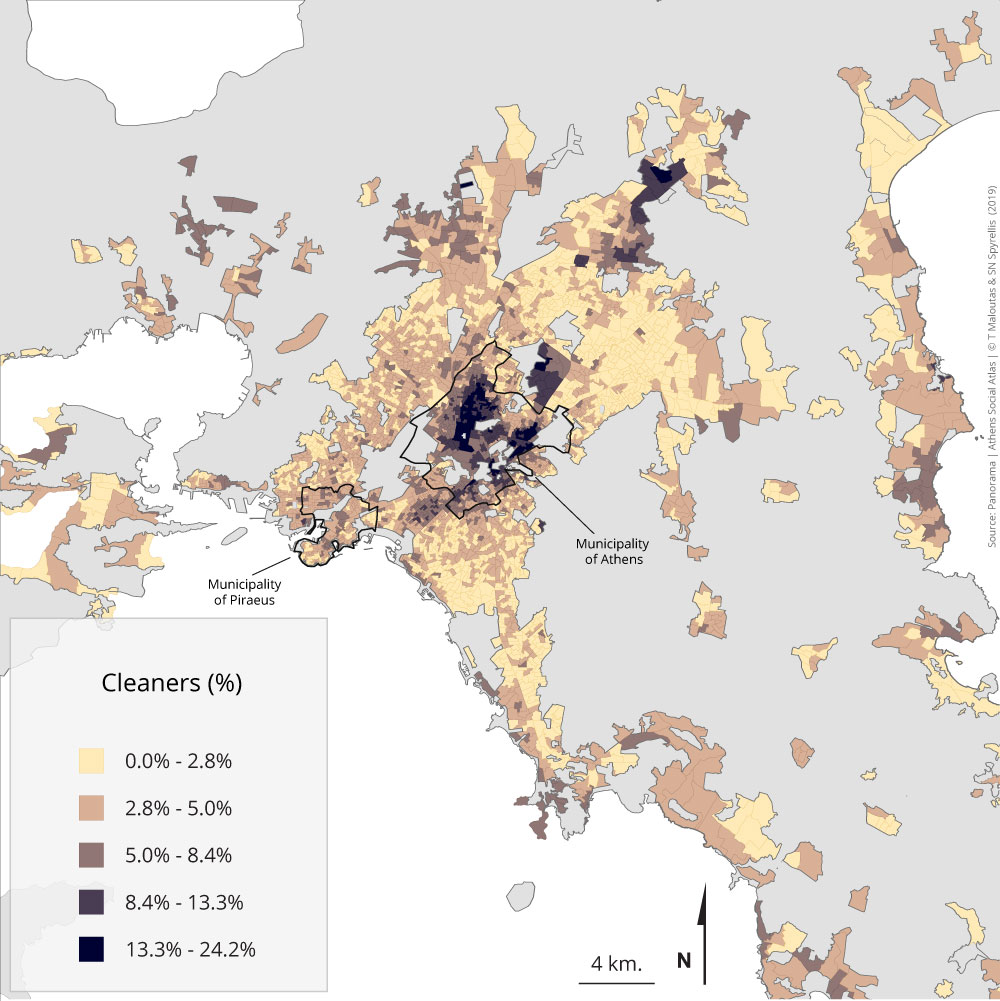
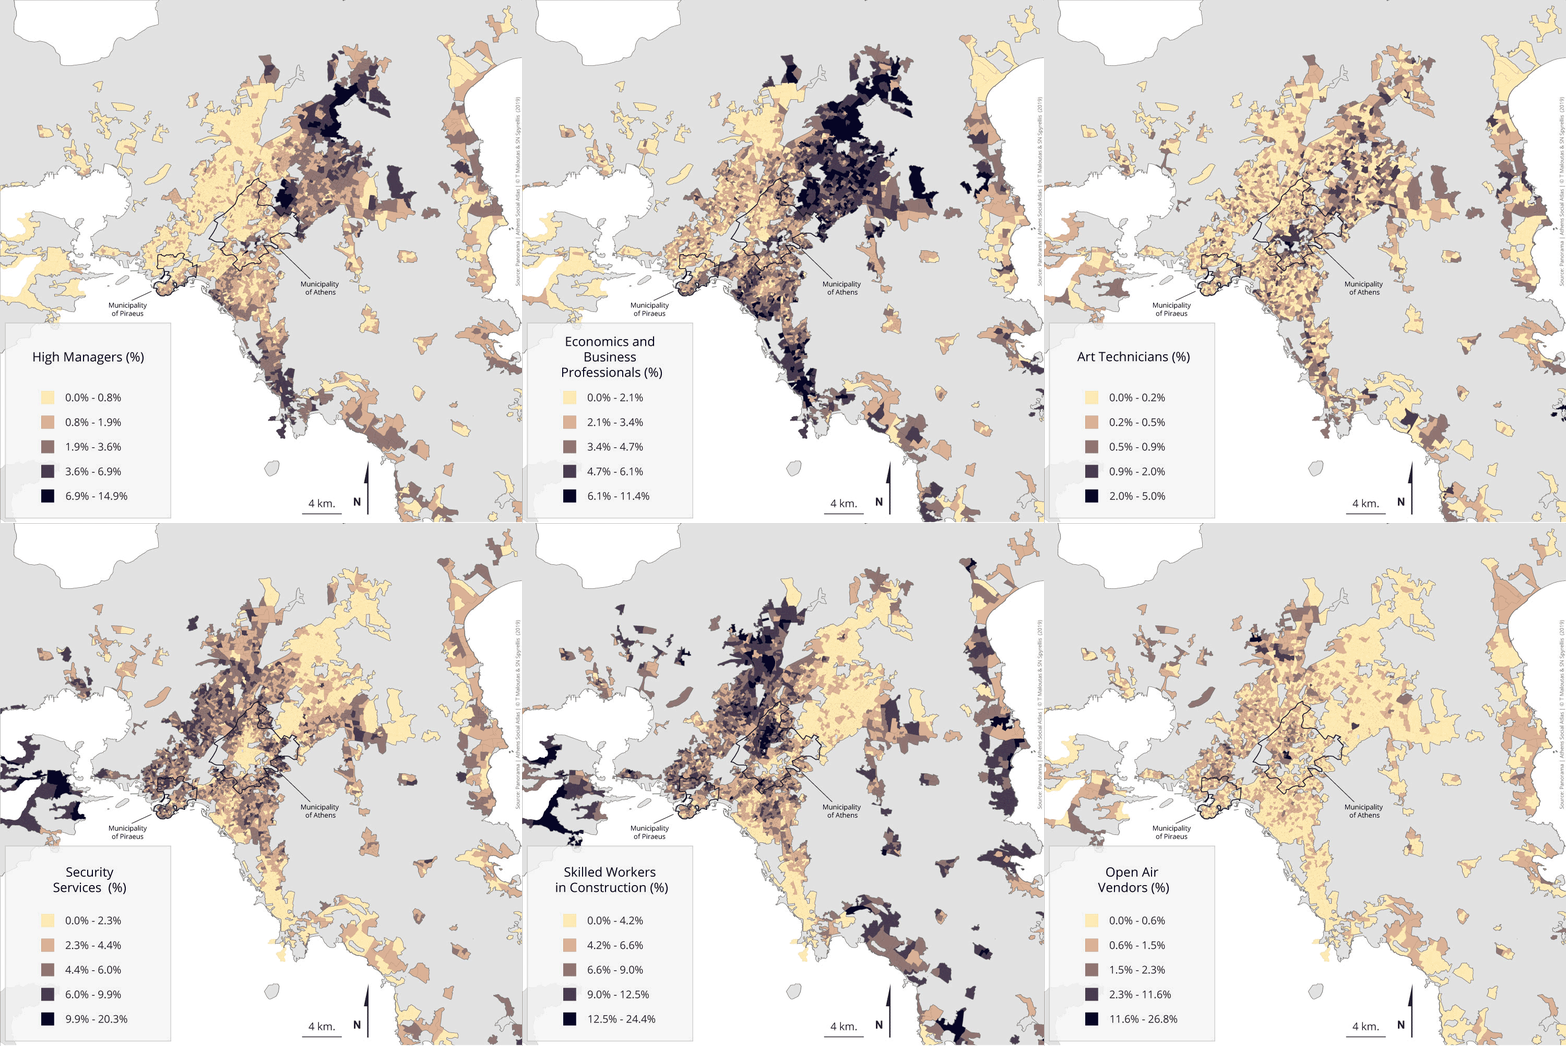
The spatial distribution of occupational categories in residential areas shows that the higher ones are overrepresented in the eastern part of the city, the lower ones in the western part, while the intermediate are comparatively more evenly distributed. The division between centre / periphery is much less important in the distribution of these categories. For some particular categories—like artists, cleaners, cooks, waiters and, to some extent, lawyers—the city centre is important in their distribution pattern.
There are two main groups among the highest categories. The first comprises the upper part—for example CEOs and lawyers—overrepresented in the few areas where the highest social groups are concentrated (Psychico-Filothei, Kifissia, Ekali, Kolonaki, and the coastal zone from Palaio Faliro to Vouliagmeni). Their presence is limited in the rest of the eastern part of the city and they are almost absent from the western part. The second group comprises the lower part—for example lower managers and teachers in secondary and primary education—who are overrepresented in the broad eastern part of the city, without being absent from the western part.
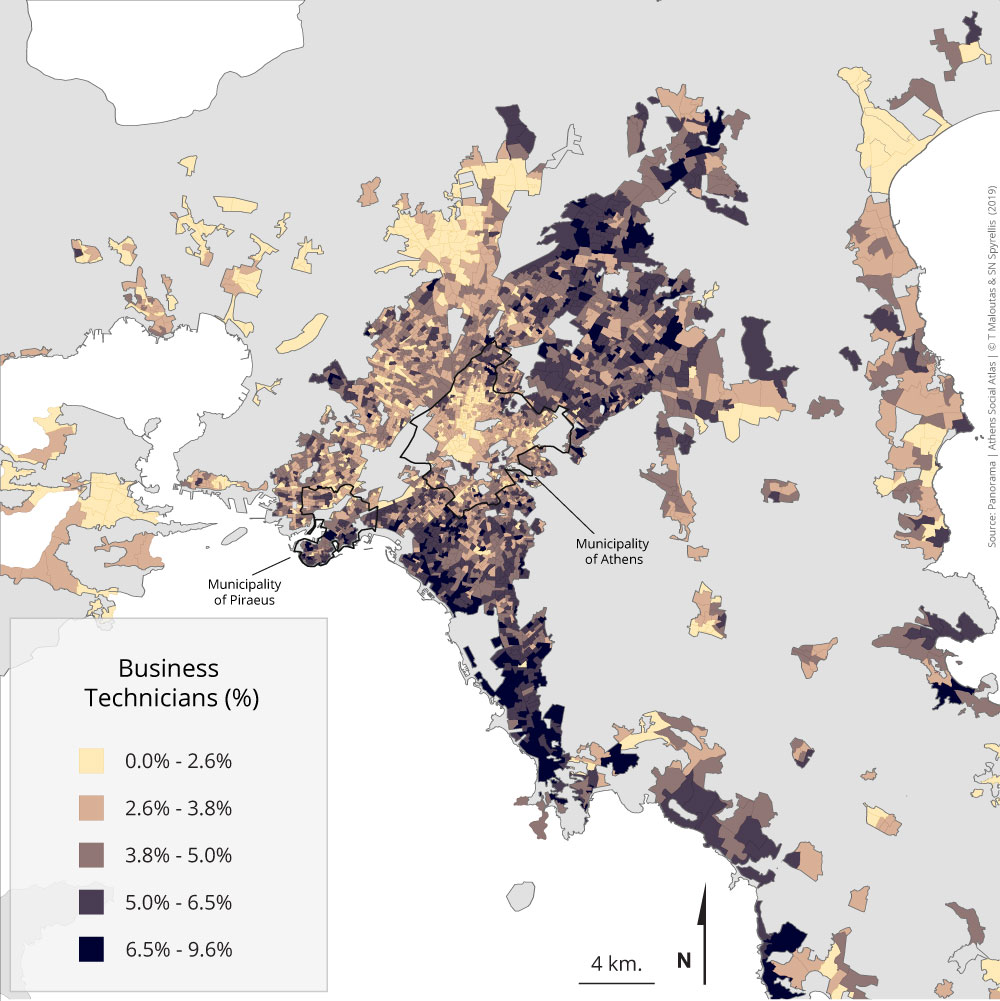
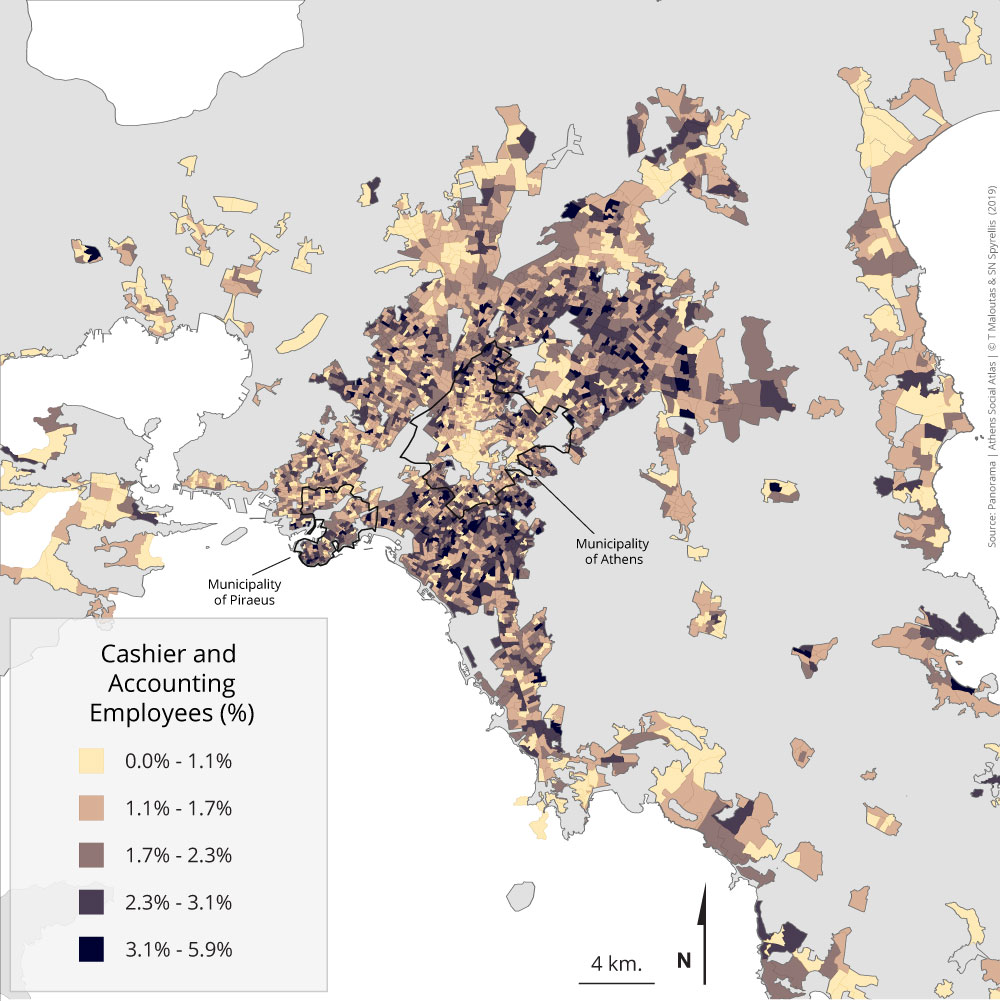
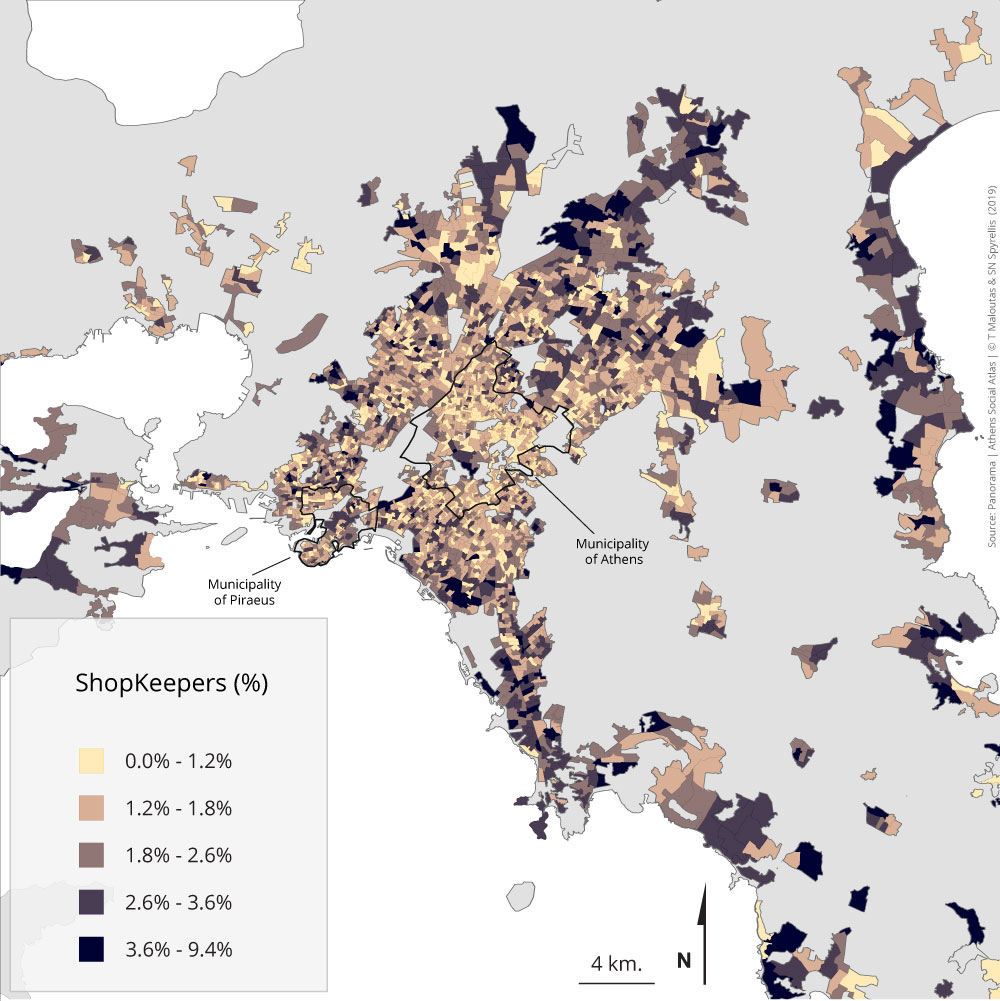
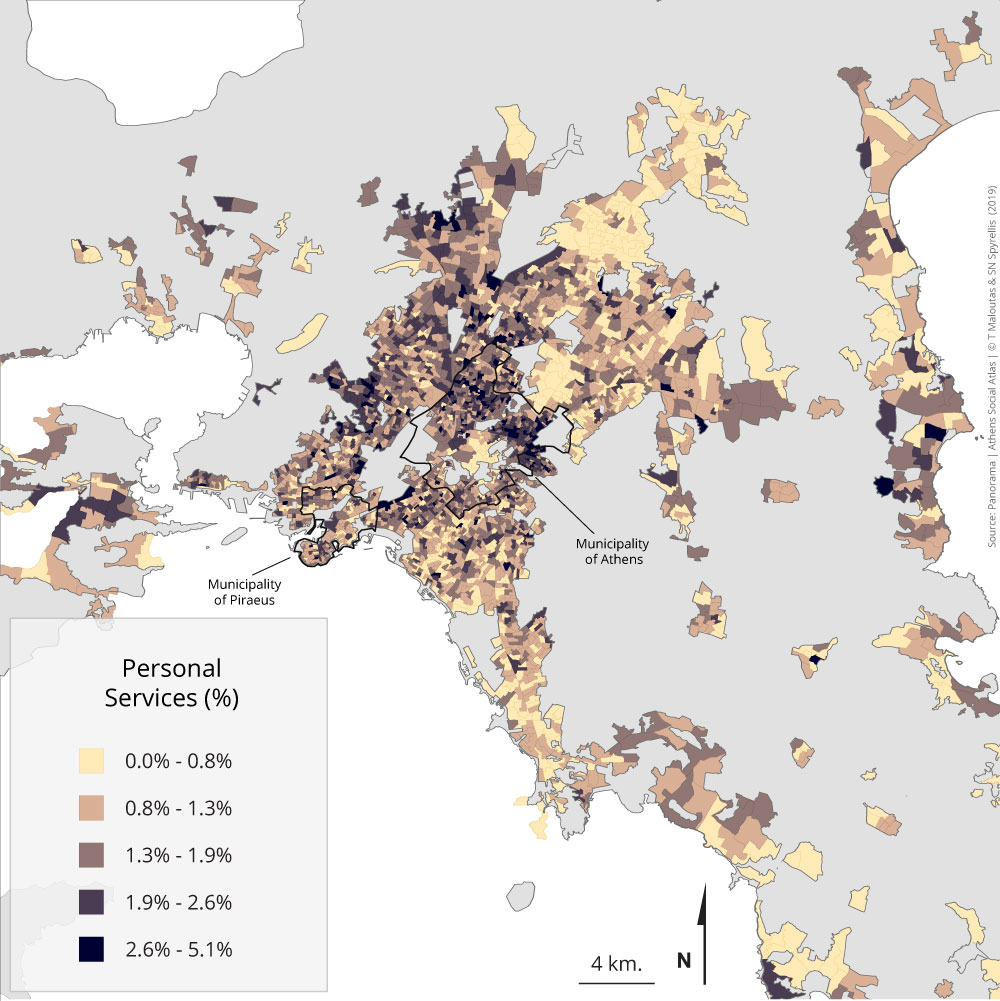
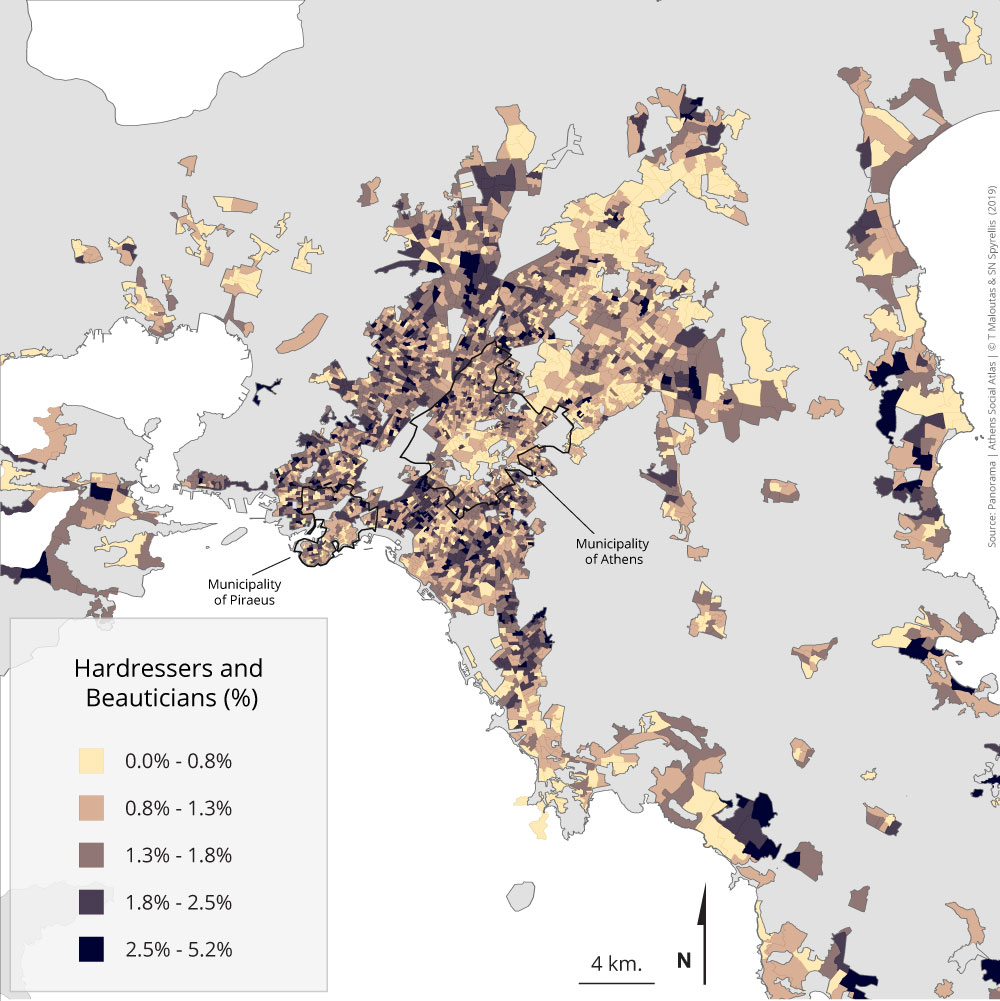
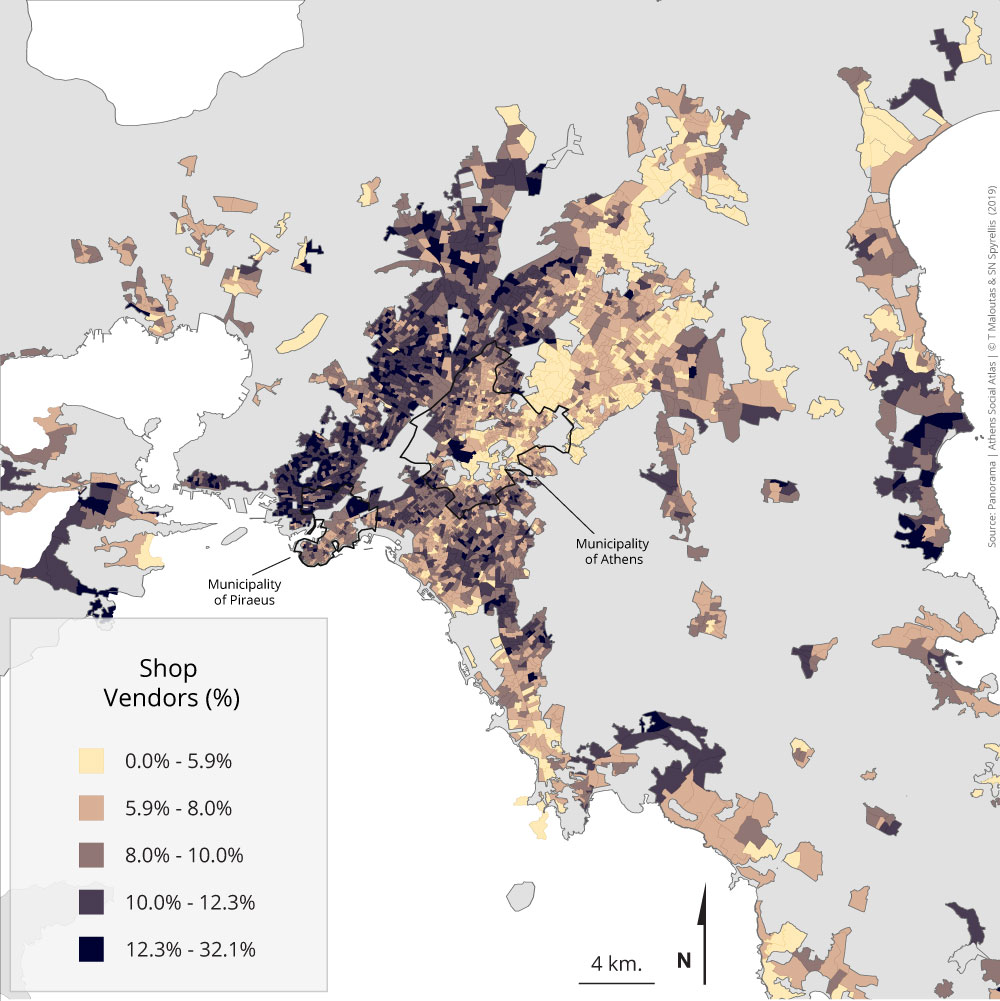
Similar differences are observed amongst intermediate categories as well. The categories on the upper part of the hierarchy—like management technicians, executive secretaries and office employees—are relatively evenly distributed between east and west. On the contrary, those at the lower end—like inventory registration, logistics and correspondence employees, hairdressers and beauticians, and shop salespersons—are located much more on the western part of the city.
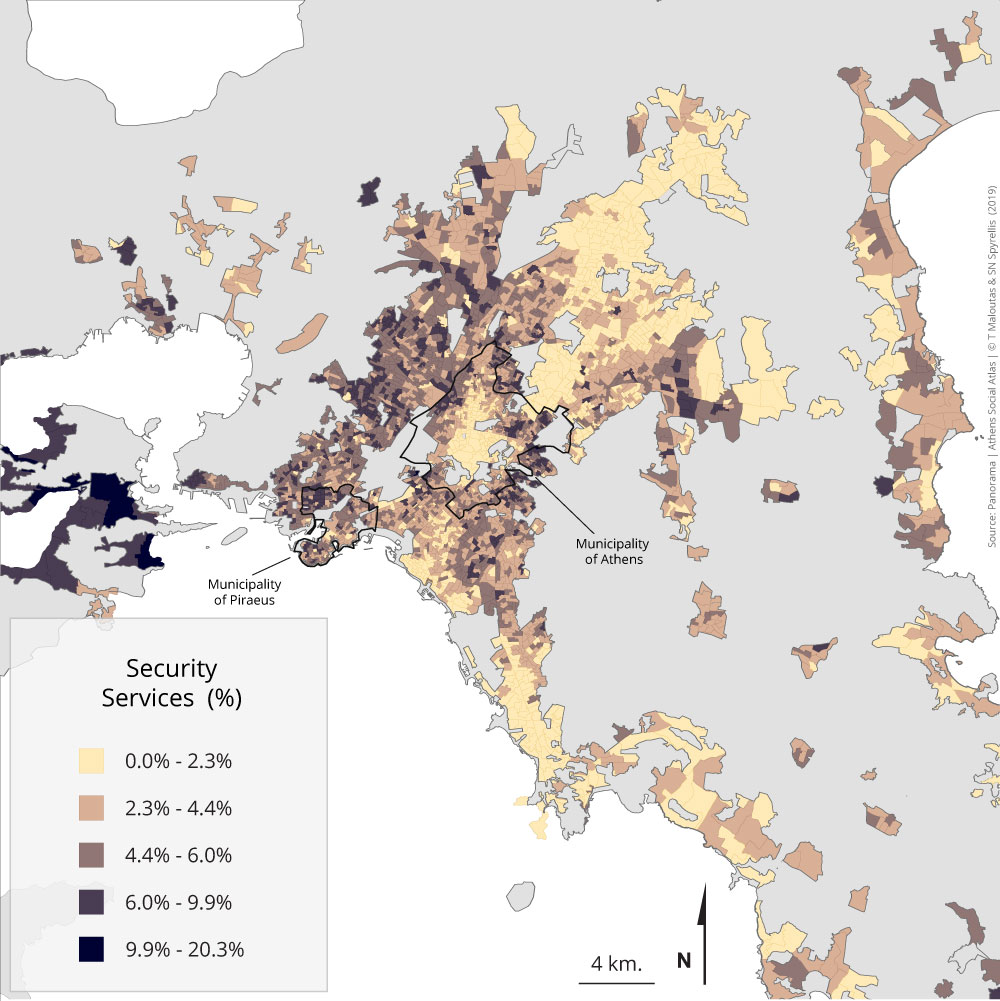
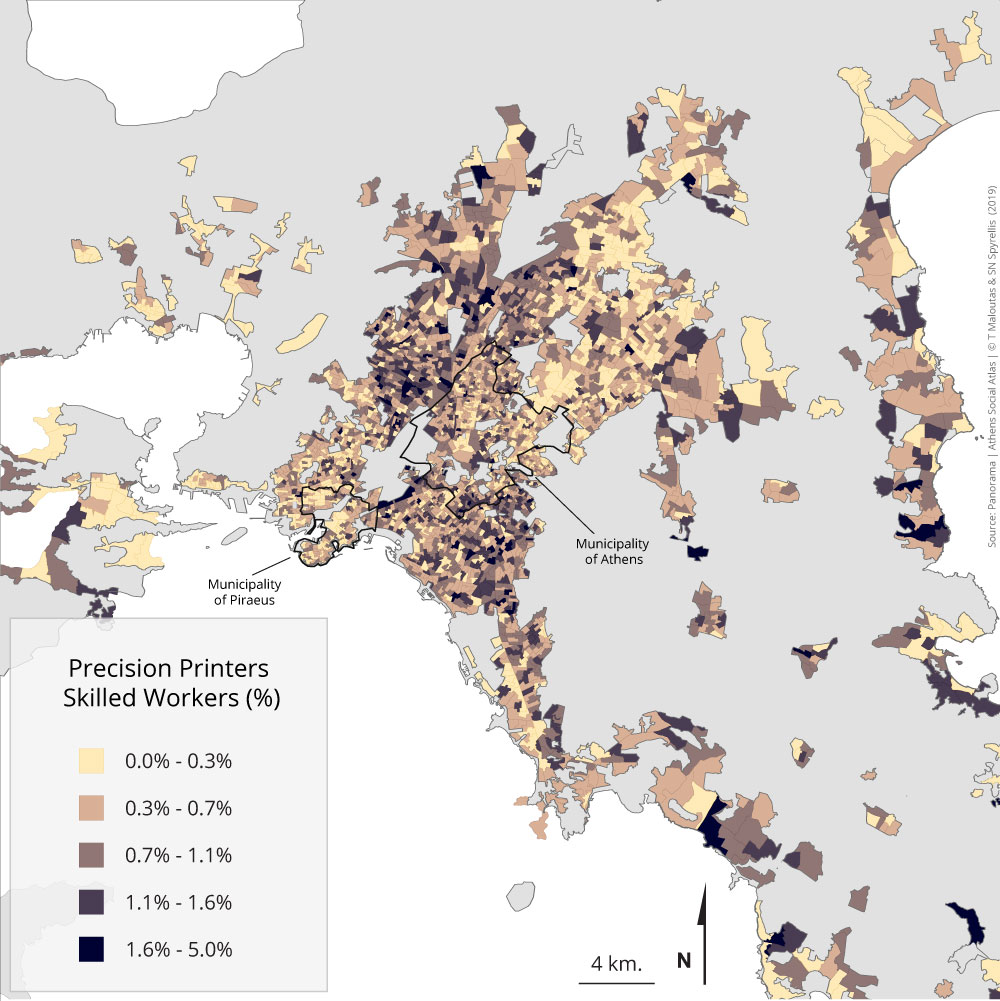
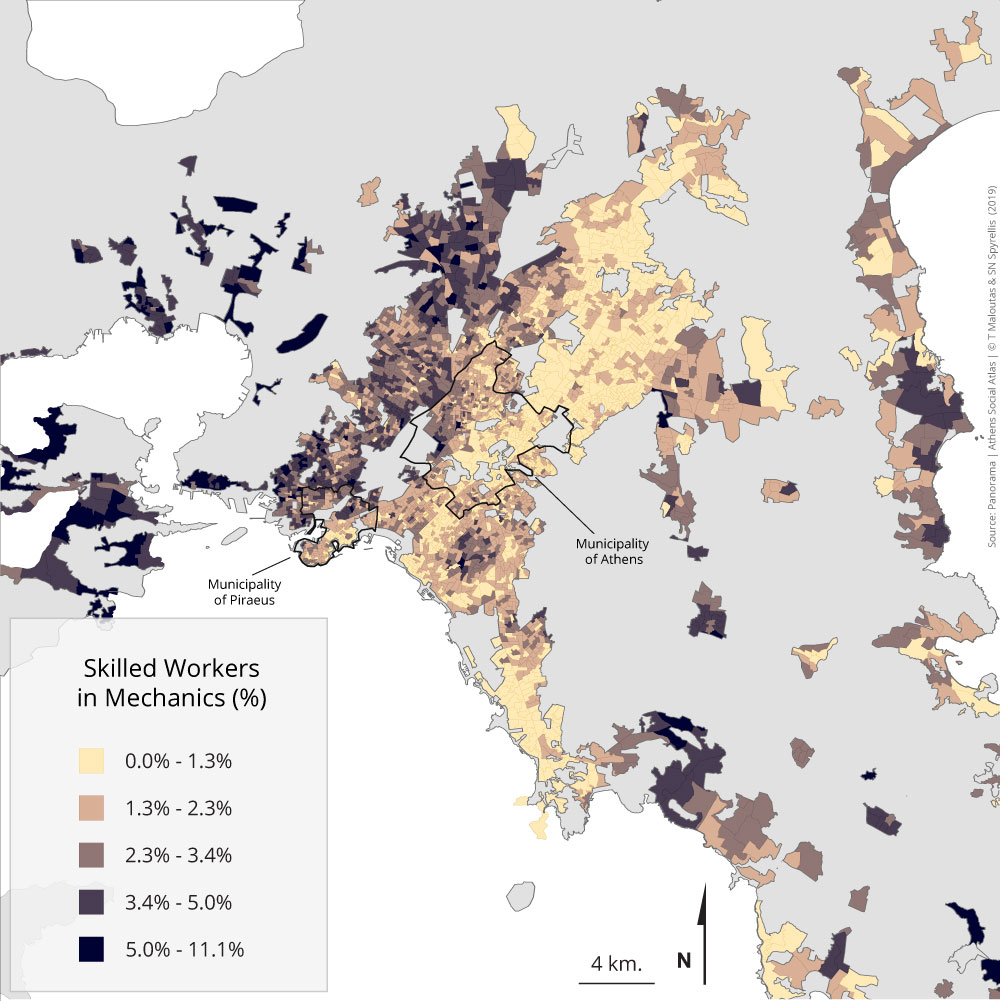
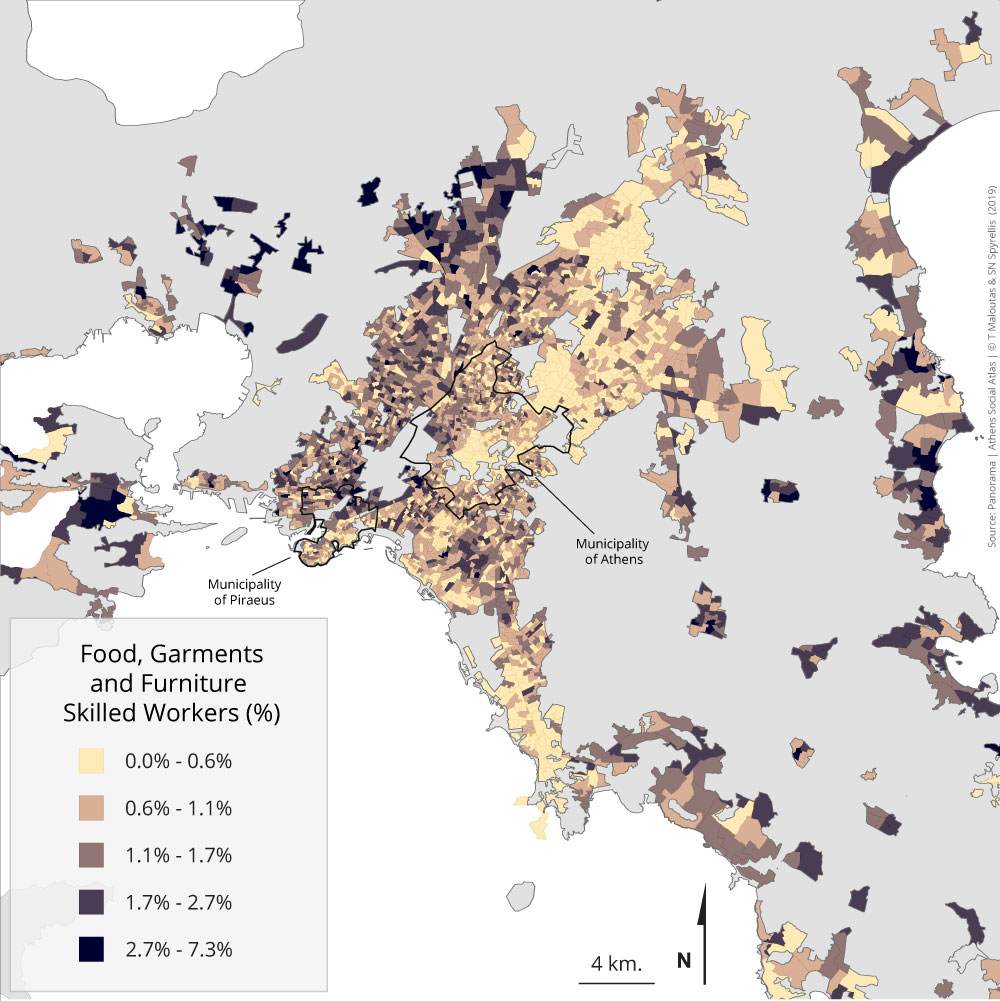
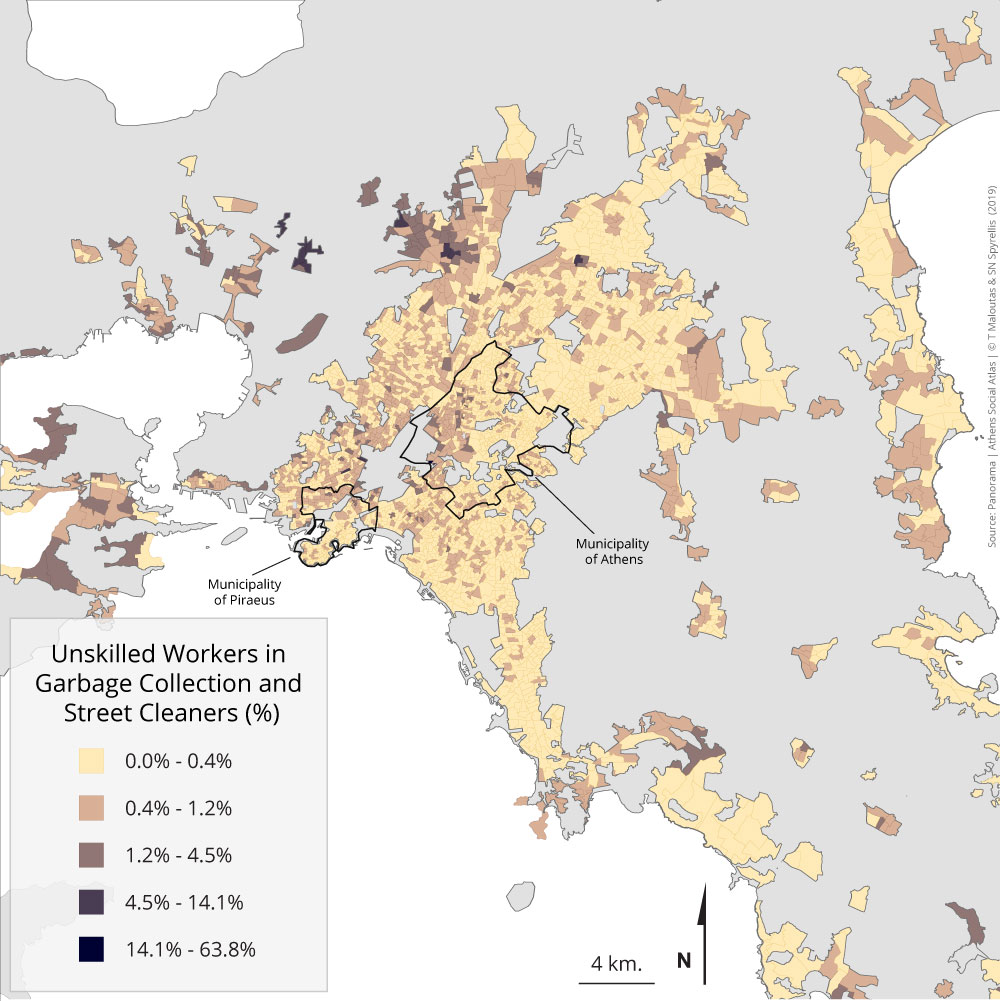
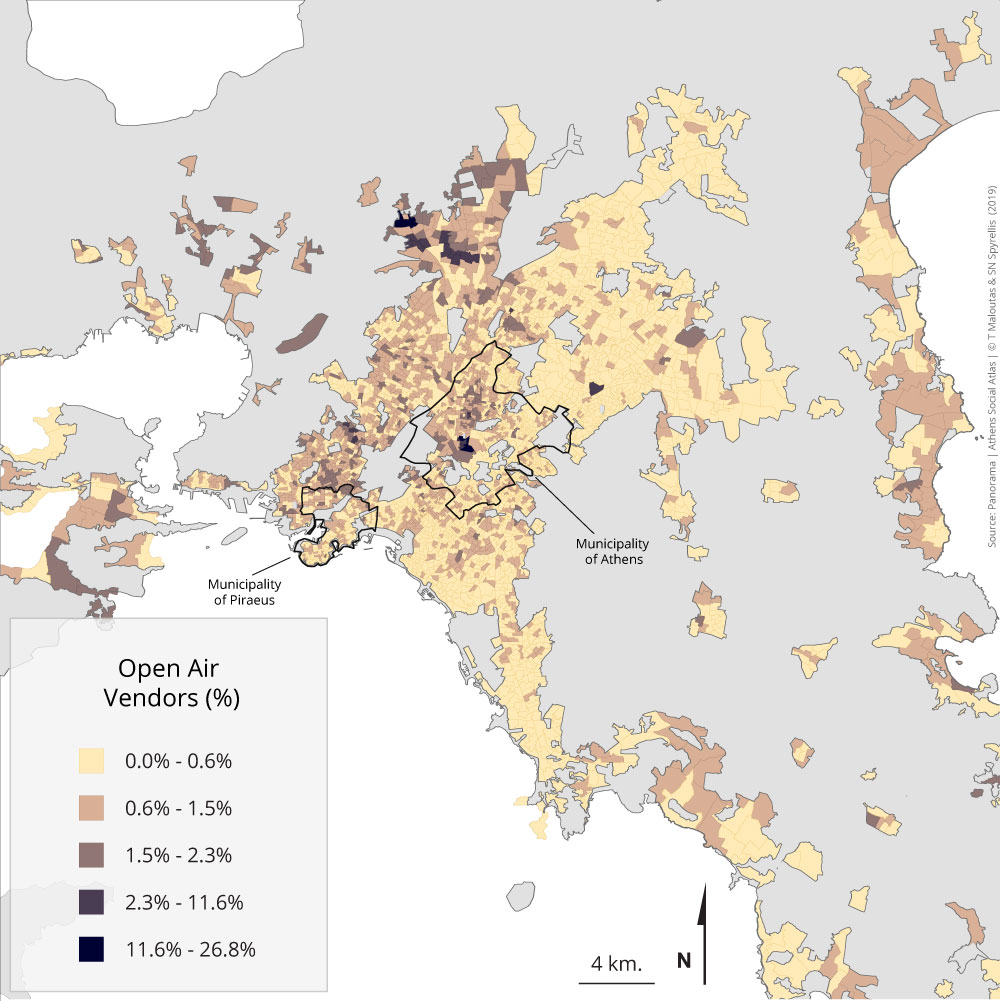
Among the lower occupational categories, the ones on the upper part—as most skilled workers—are distributed rather diffusely mainly in the western part of the city. Makers of precision tools and printers are an exception, with a residential pattern much closer to that of intermediate categories. Categories at the lower end—like unskilled workers in industry and construction works, cleaners and garbage collectors and street cleaners—are concentrated in the areas of lower social groups (Aspropyrgos, Zafyri, Ano Liosisa, central neighbourhoods north of Omonia square etc.), have limited presence in the rest of the western part of the city and are absent from the eastern part. Salespersons in open-air markets have a similar settlement pattern, even though they formally are part of intermediate categories.
Maps 3.3.1 – 3.3.3: Distribution of the active population by sector of economic activity and area of residence (2011)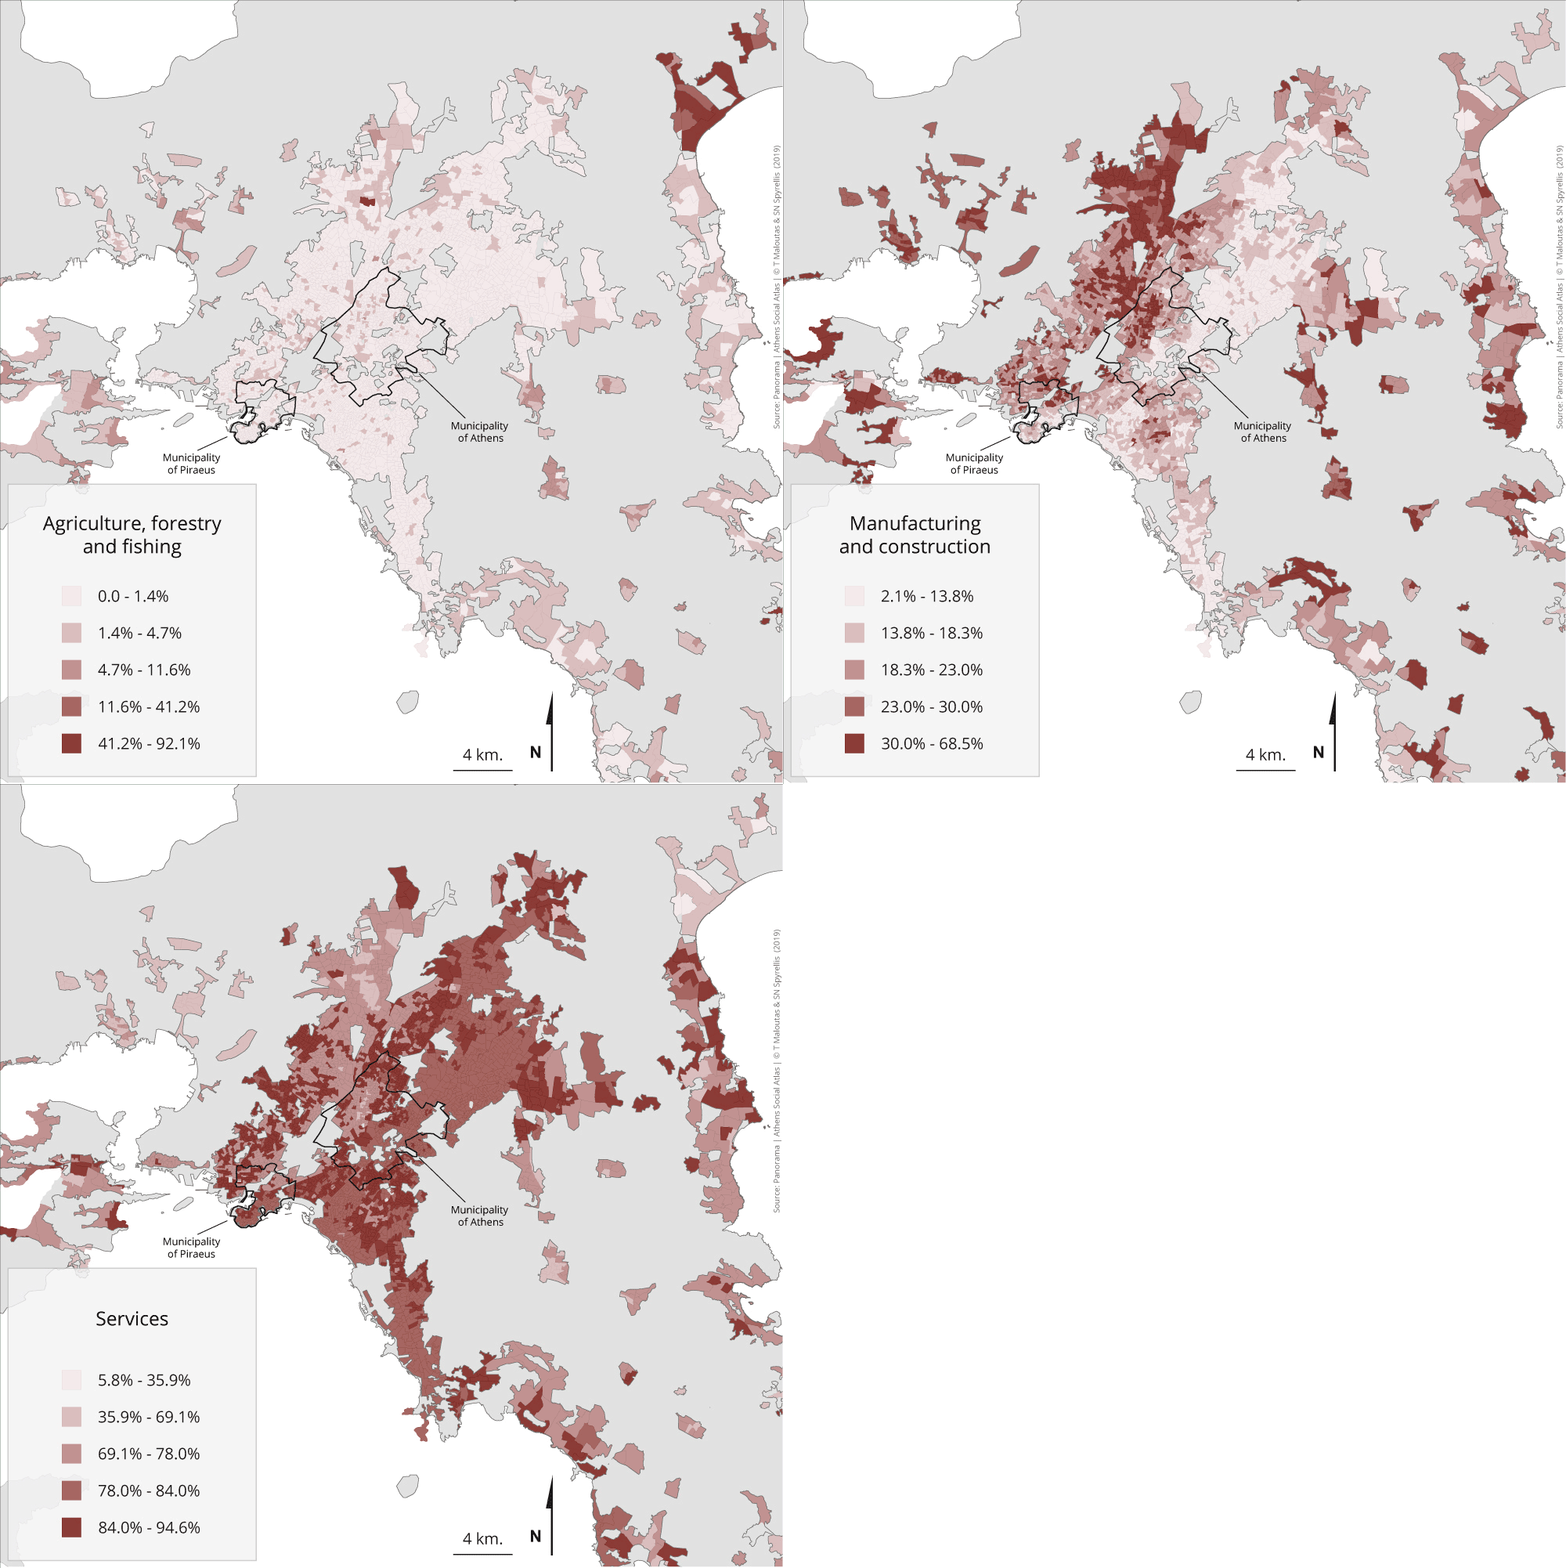
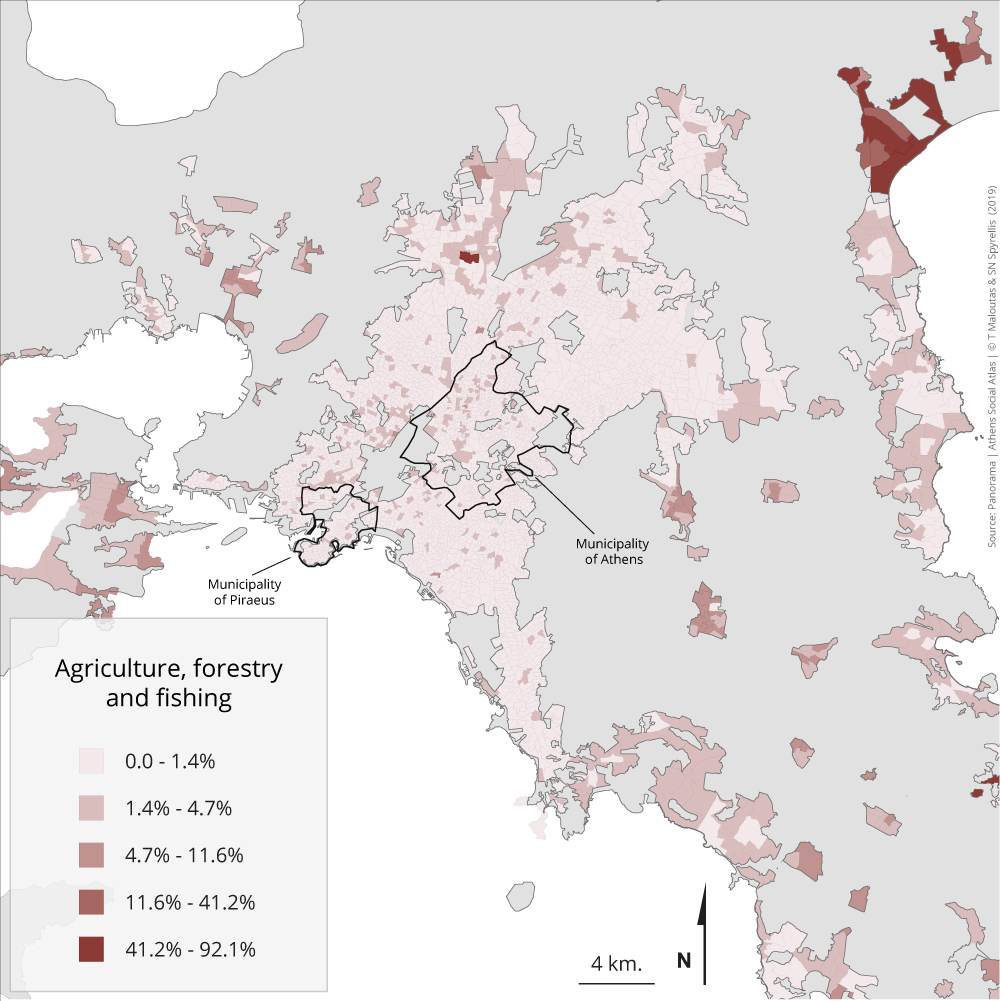
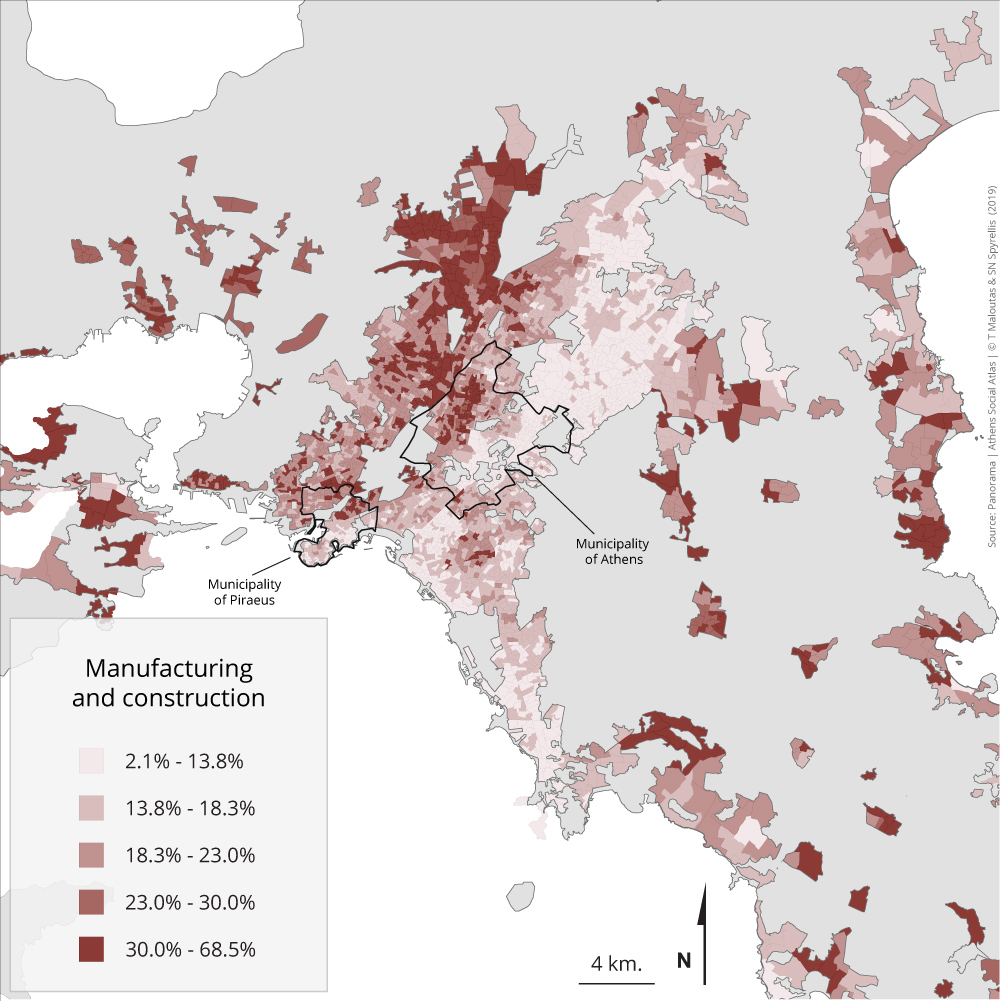
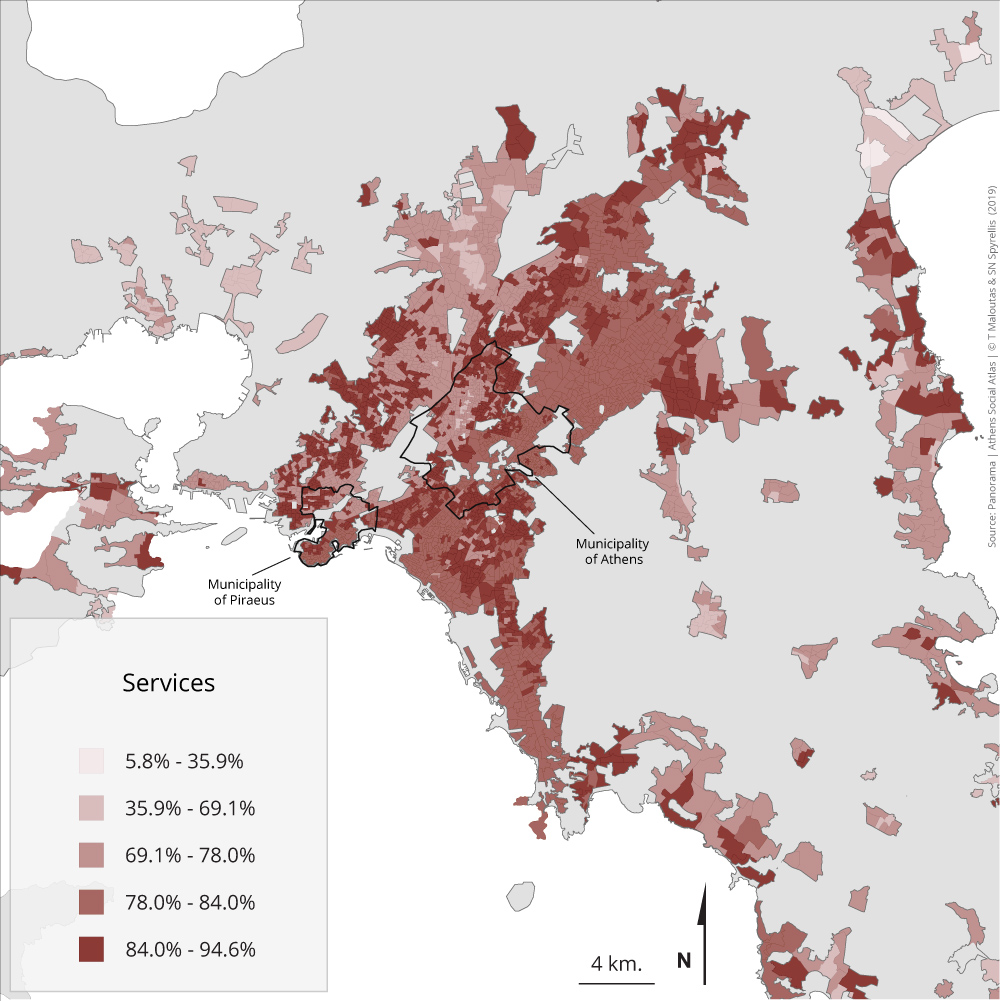
The three maps included in this section give a synthetic picture of the residential location of the active population in the three main sectors of economic activity (primary/agriculture and mining, secondary/industry and construction, tertiary/services).
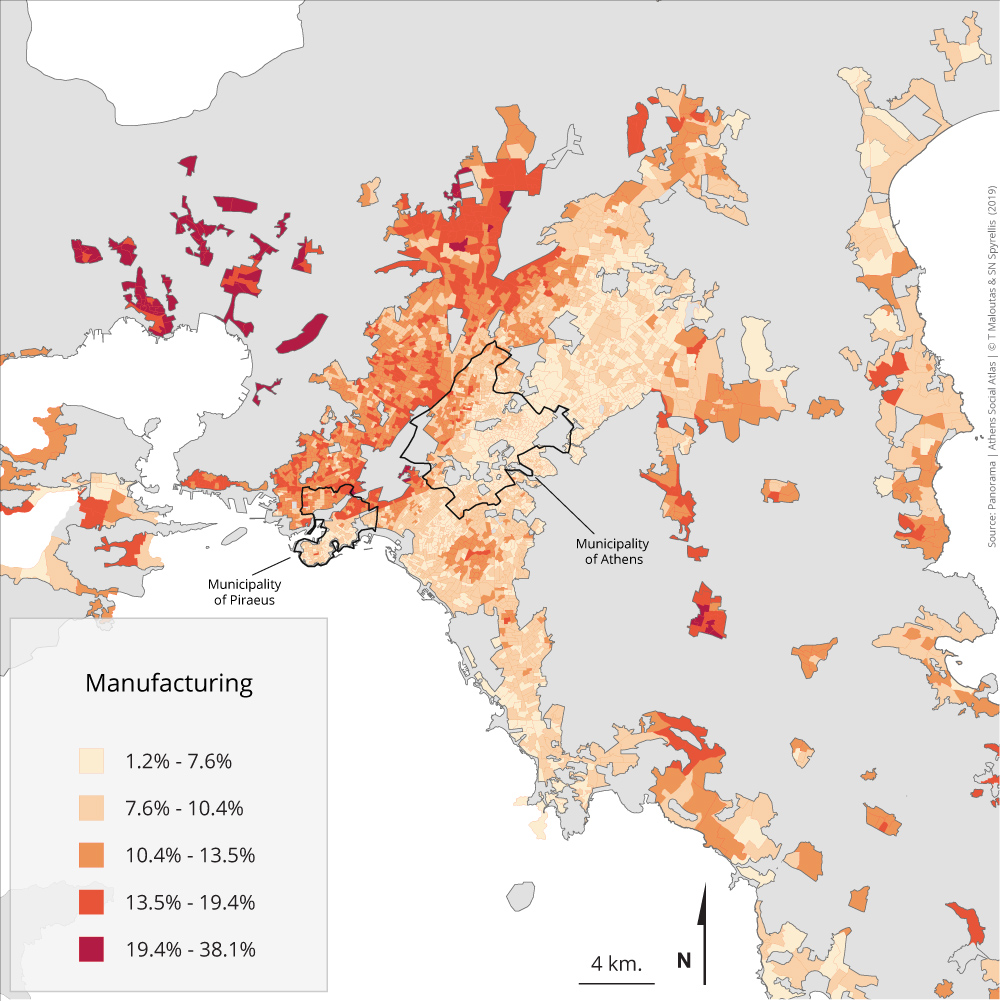
Those employed in the primary sector are, as expected, much more concentrated in the distant periphery of the metropolis and are scarcely present in the rest of the region. Those employed in the secondary sector are gathered mainly in the western part of the city—mainly in the northwestern part—and in the distant periphery, while those employed in services are present throughout the region, but their presence is higher in the eastern part of the city.
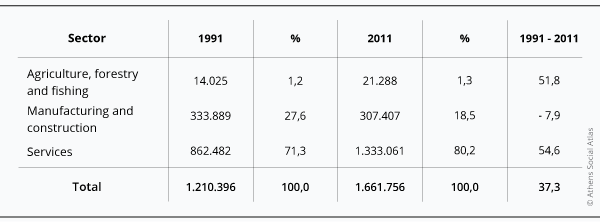
The main changes presented in table 3.3 show that between 1991 and 2011 employment dropped in the secondary sector—in relative rather than in absolute terms—and increased considerably in the service sector.
Table 3.3: Distribution of the active population of Attiki (except islands) by sector of economic activity 1991-2011
Data source: EKKE-ELSTAT (2015)
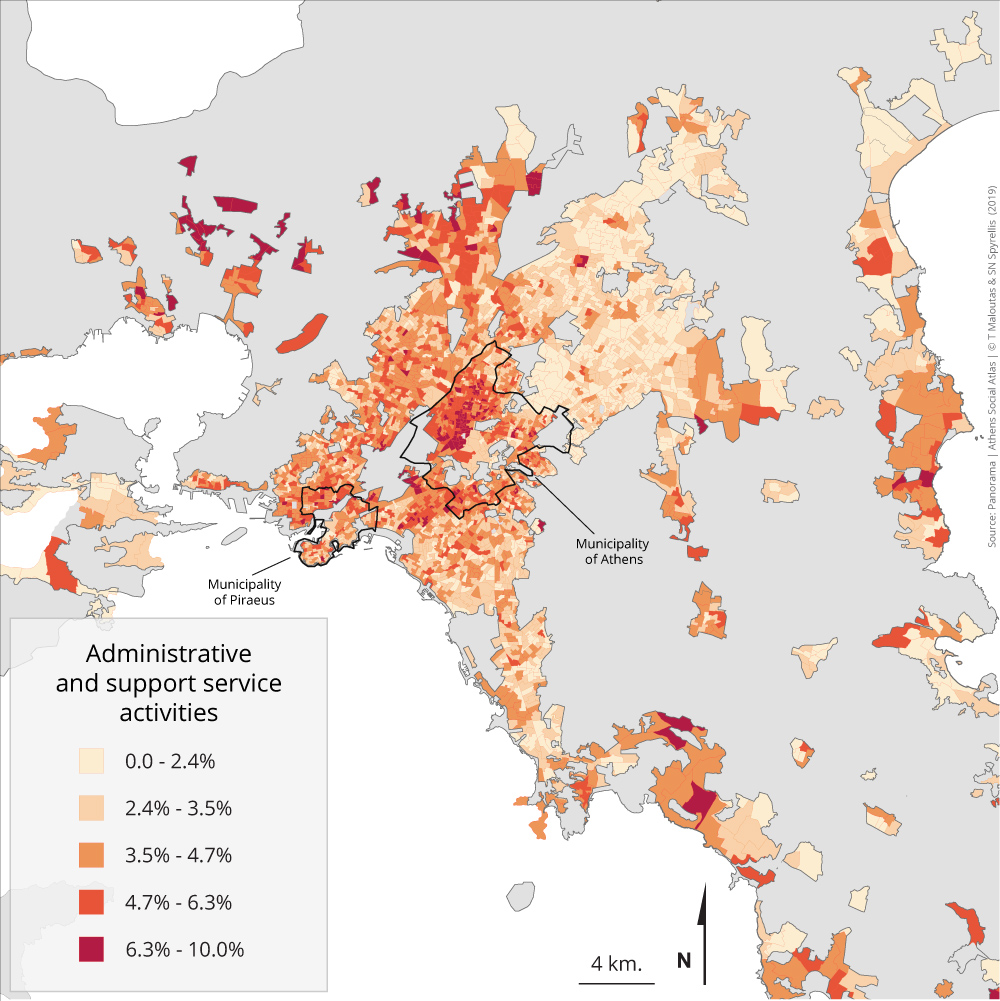
Maps 3.4.1 – 3.4.15: Distribution of the active population by branch of economic activity and by area of residence (2011)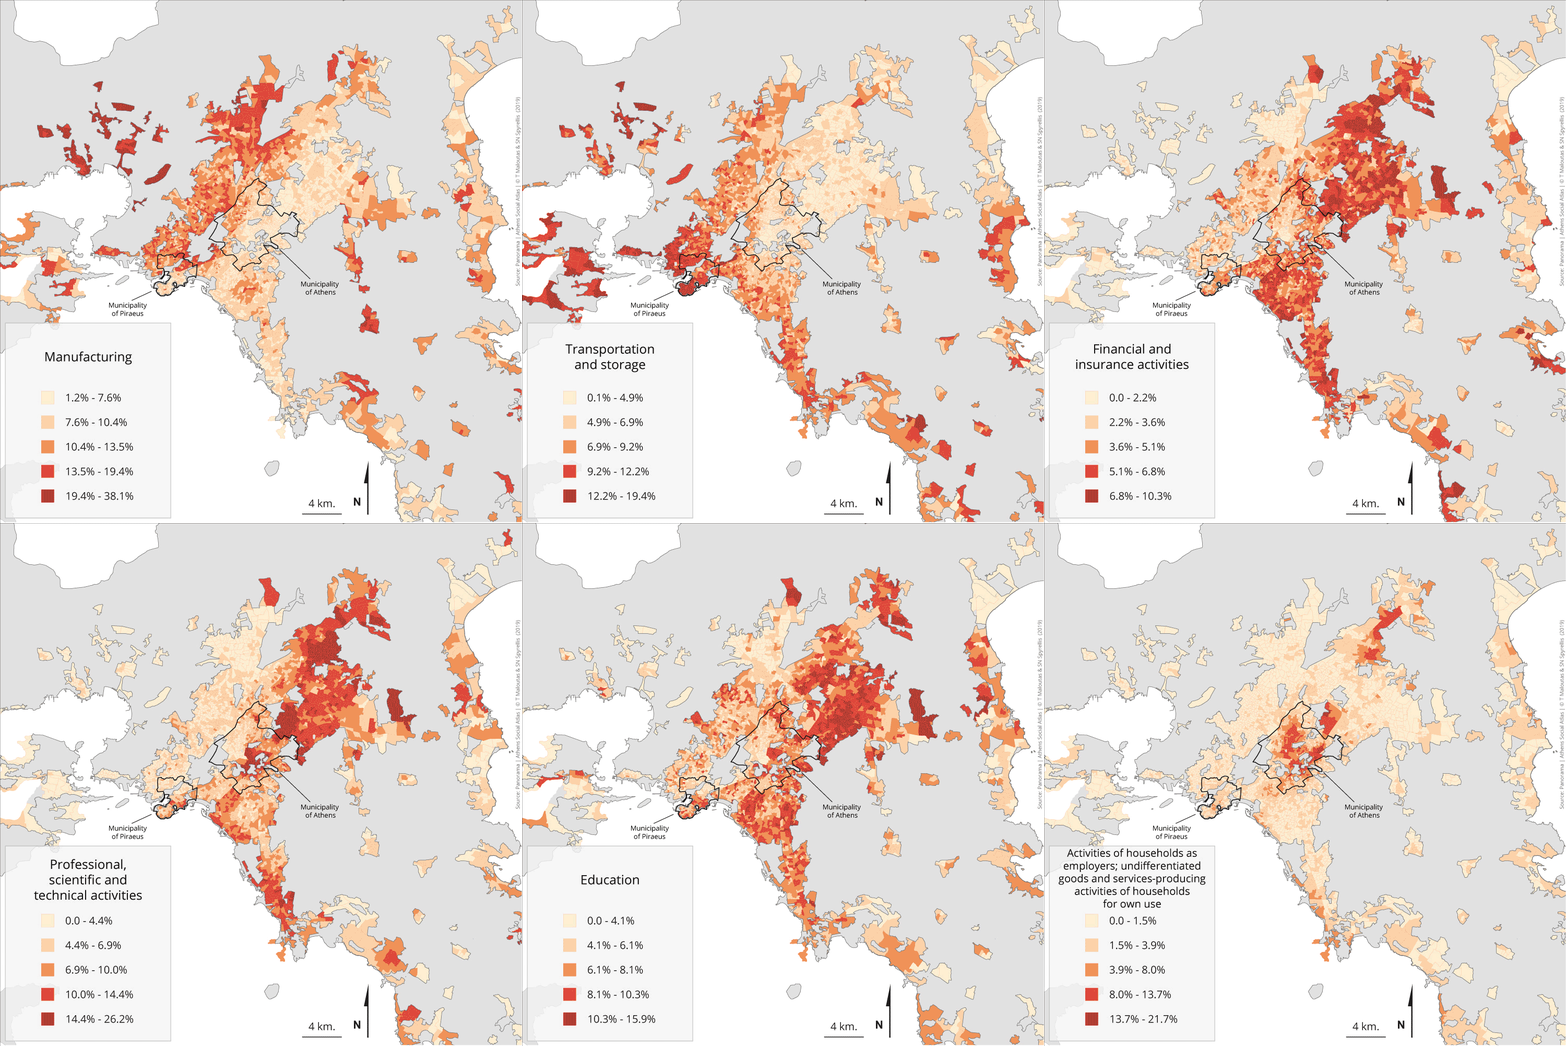
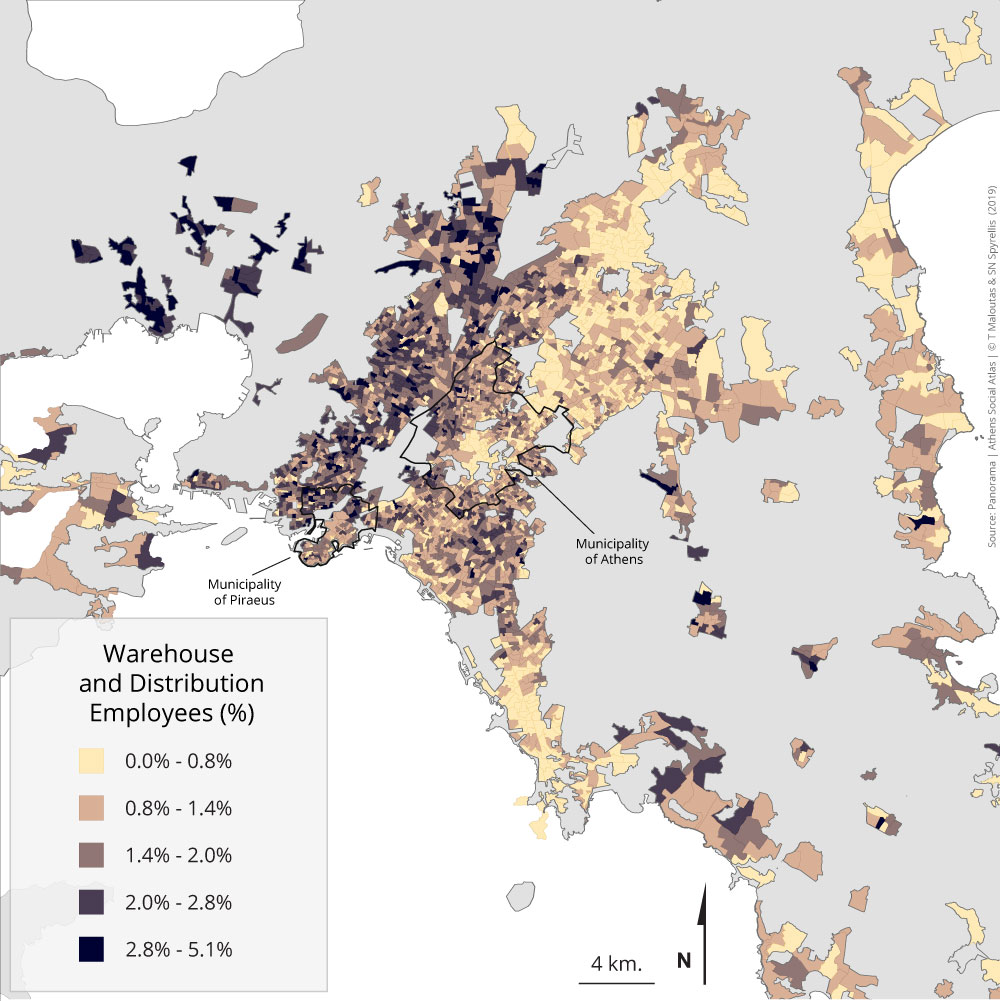
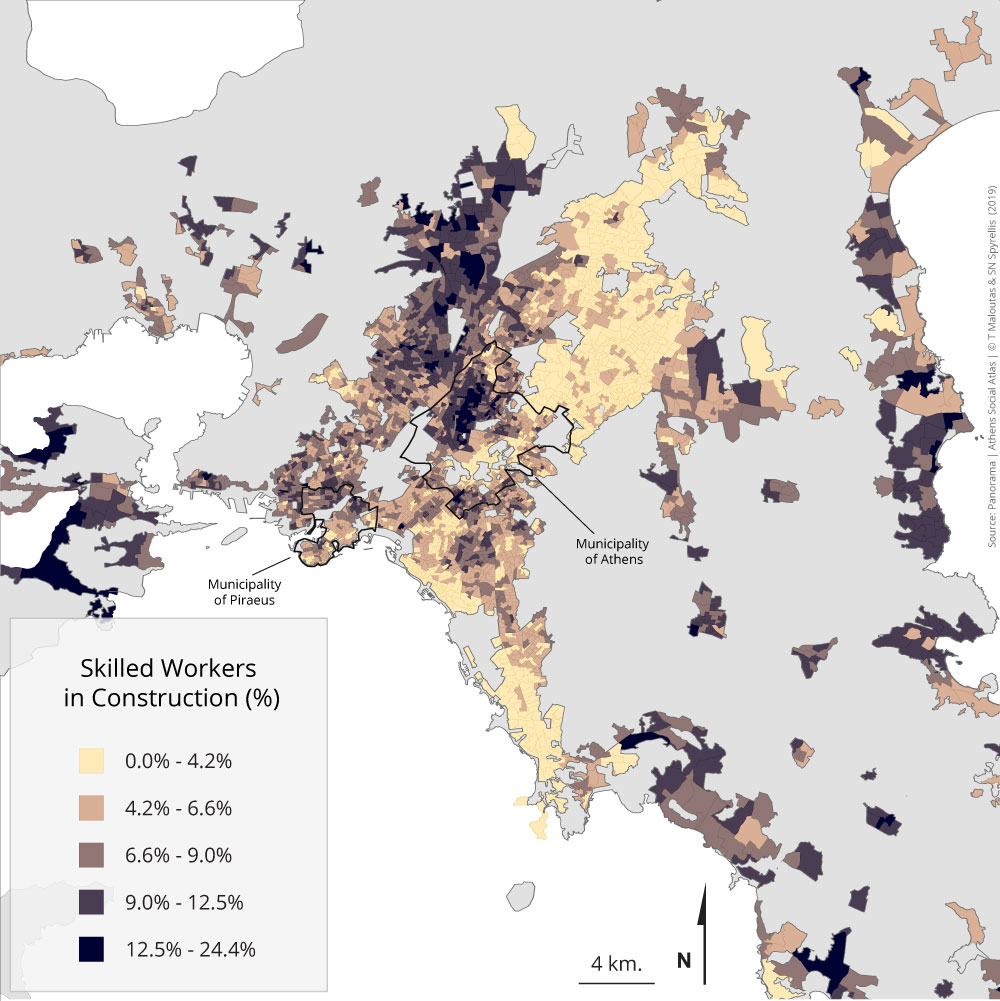
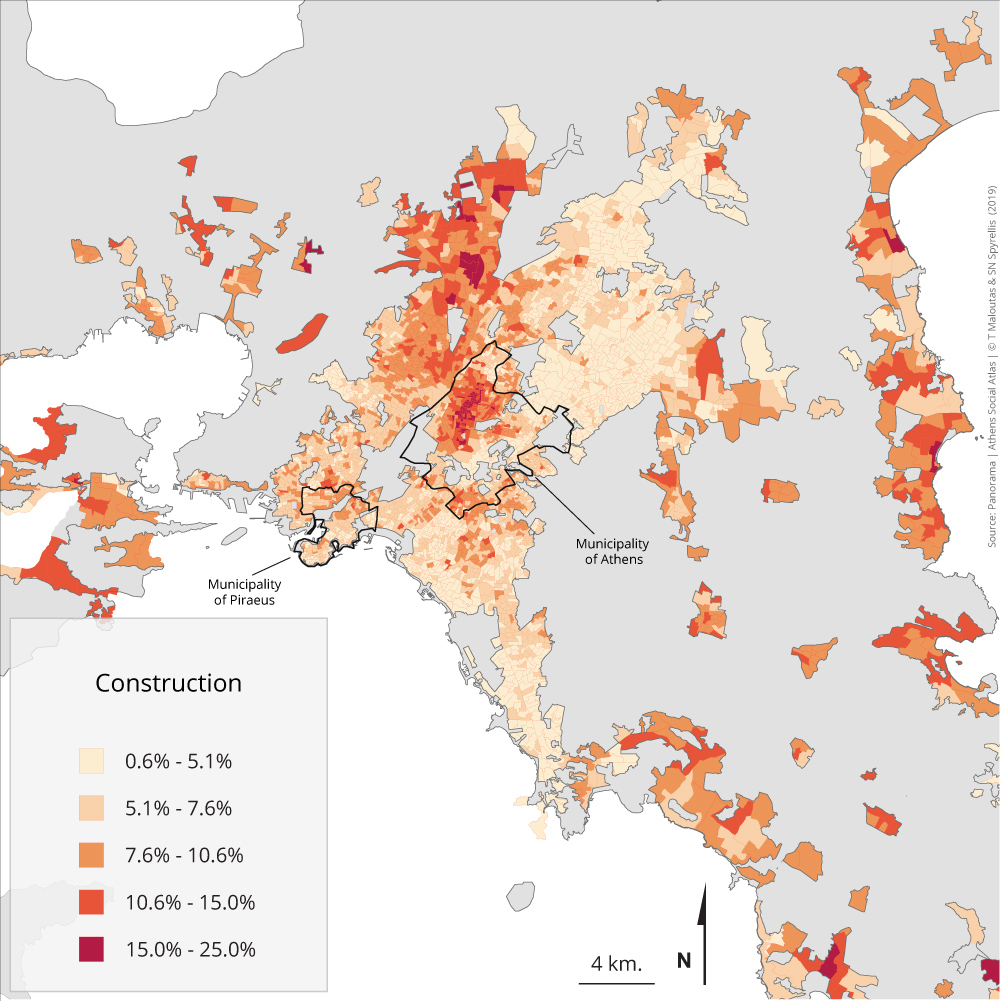
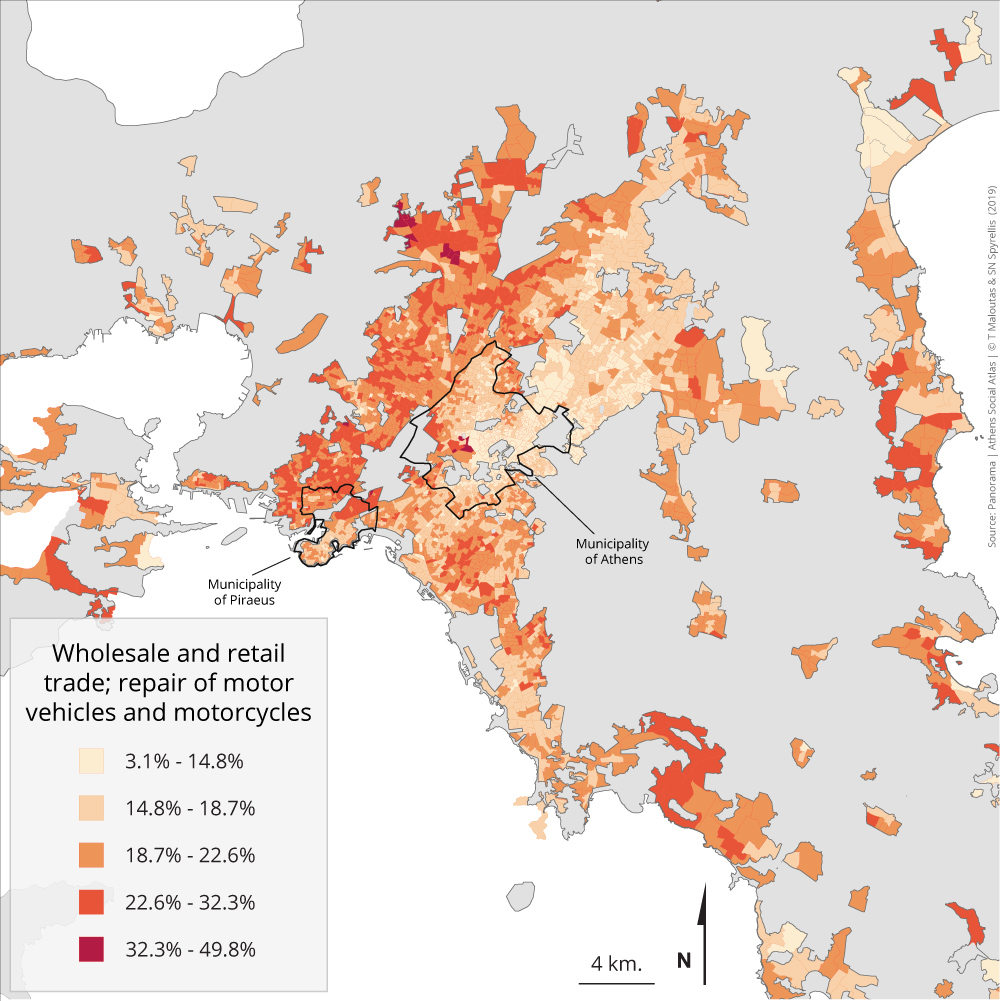
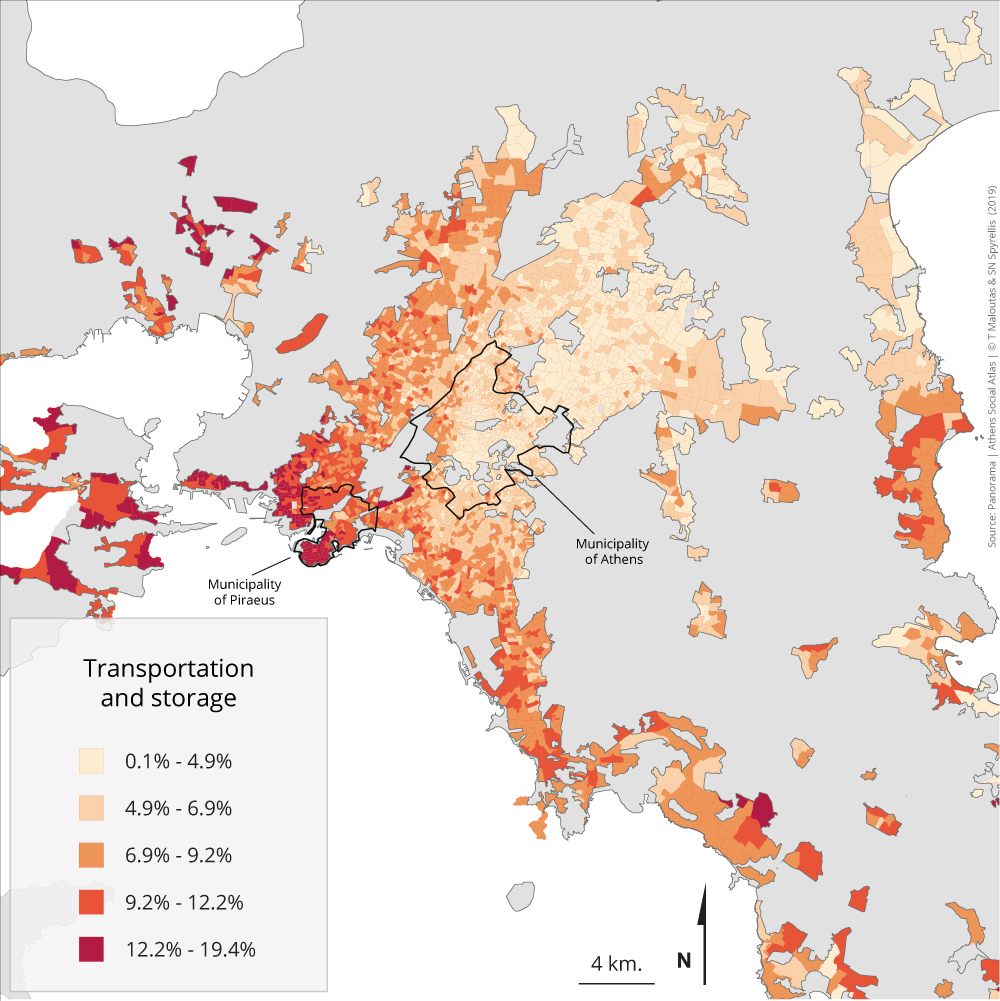
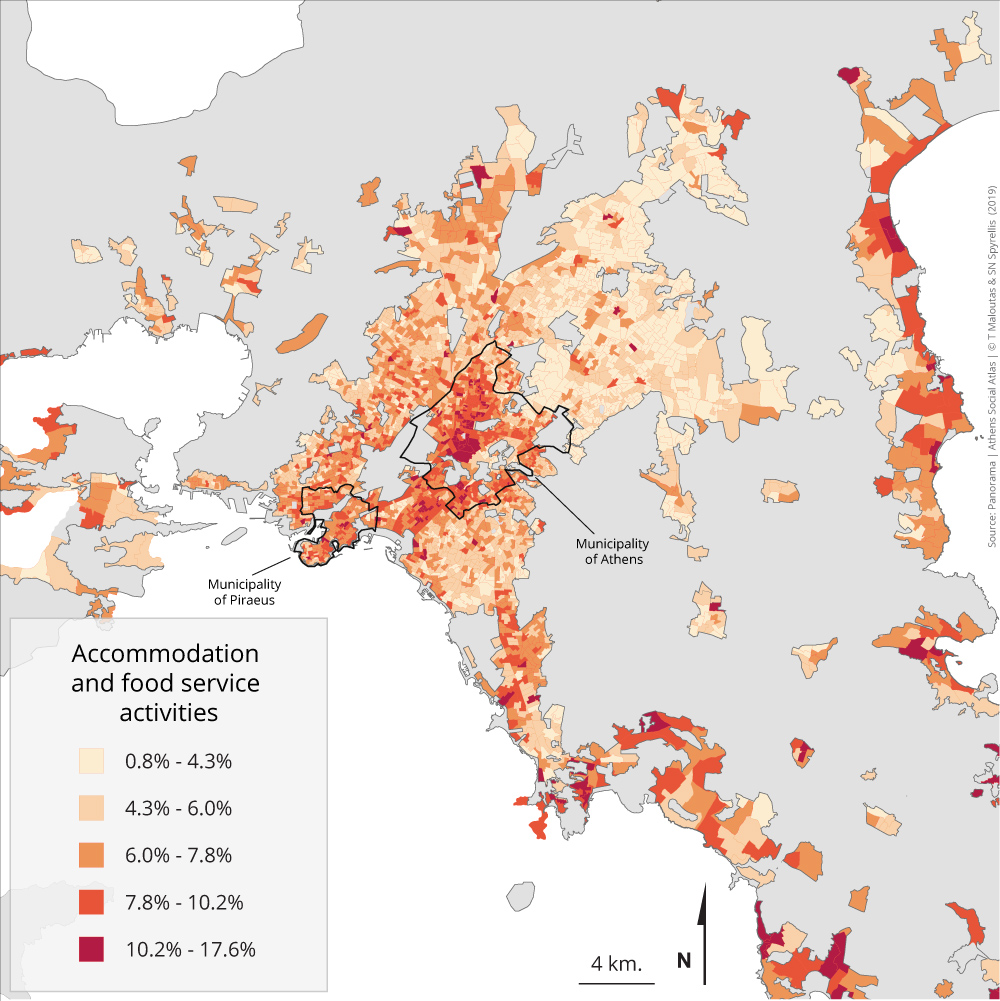
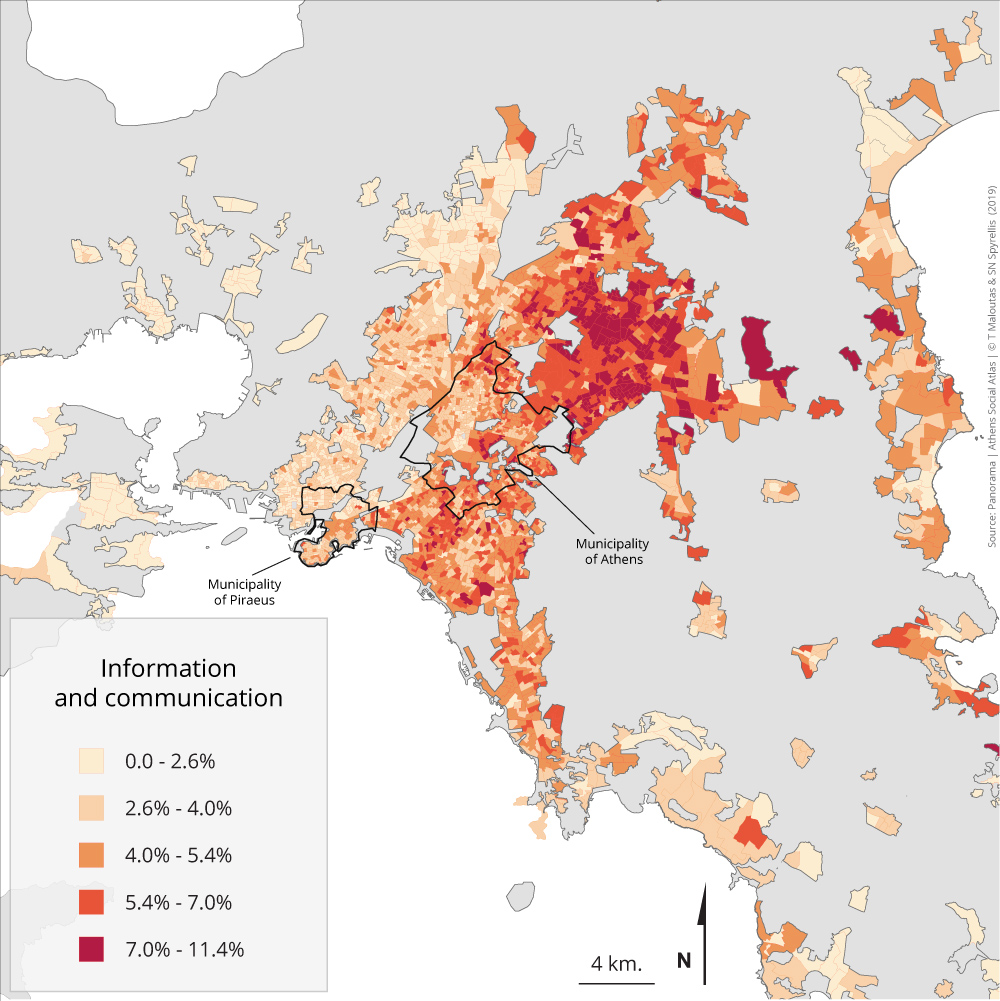
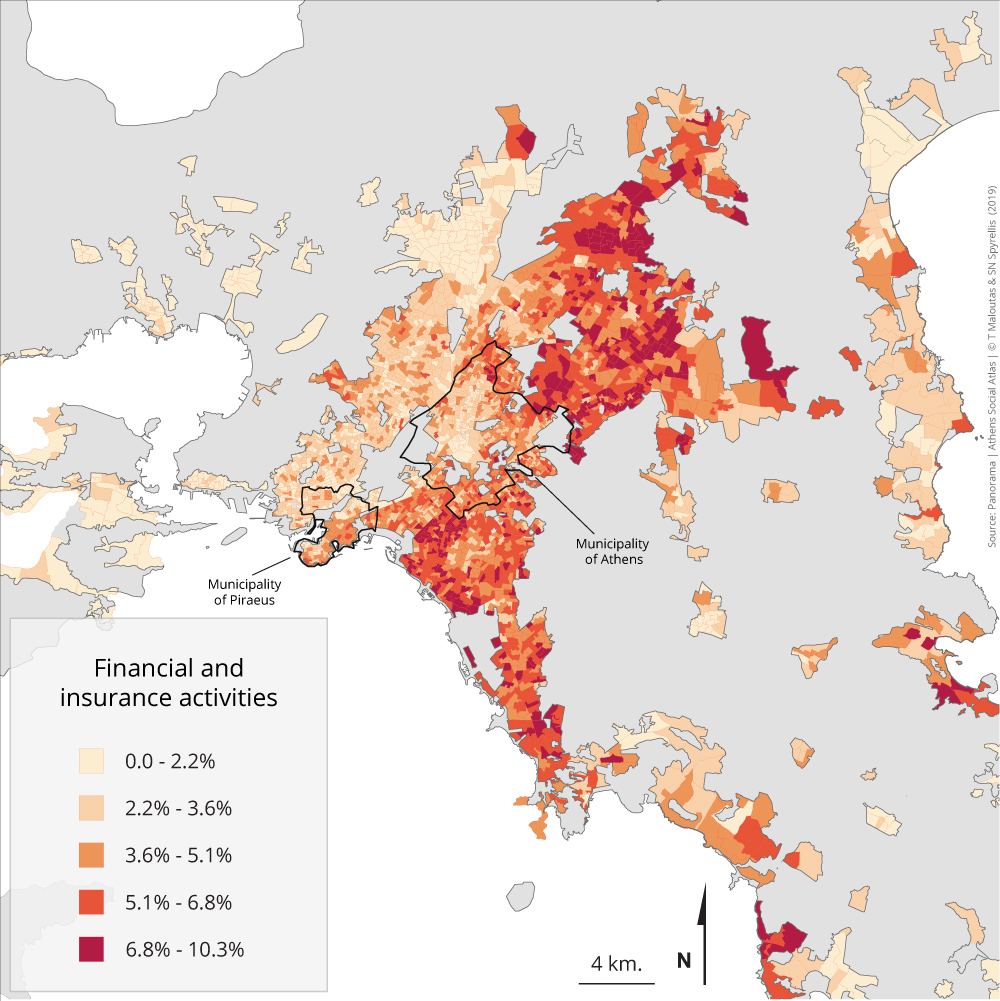
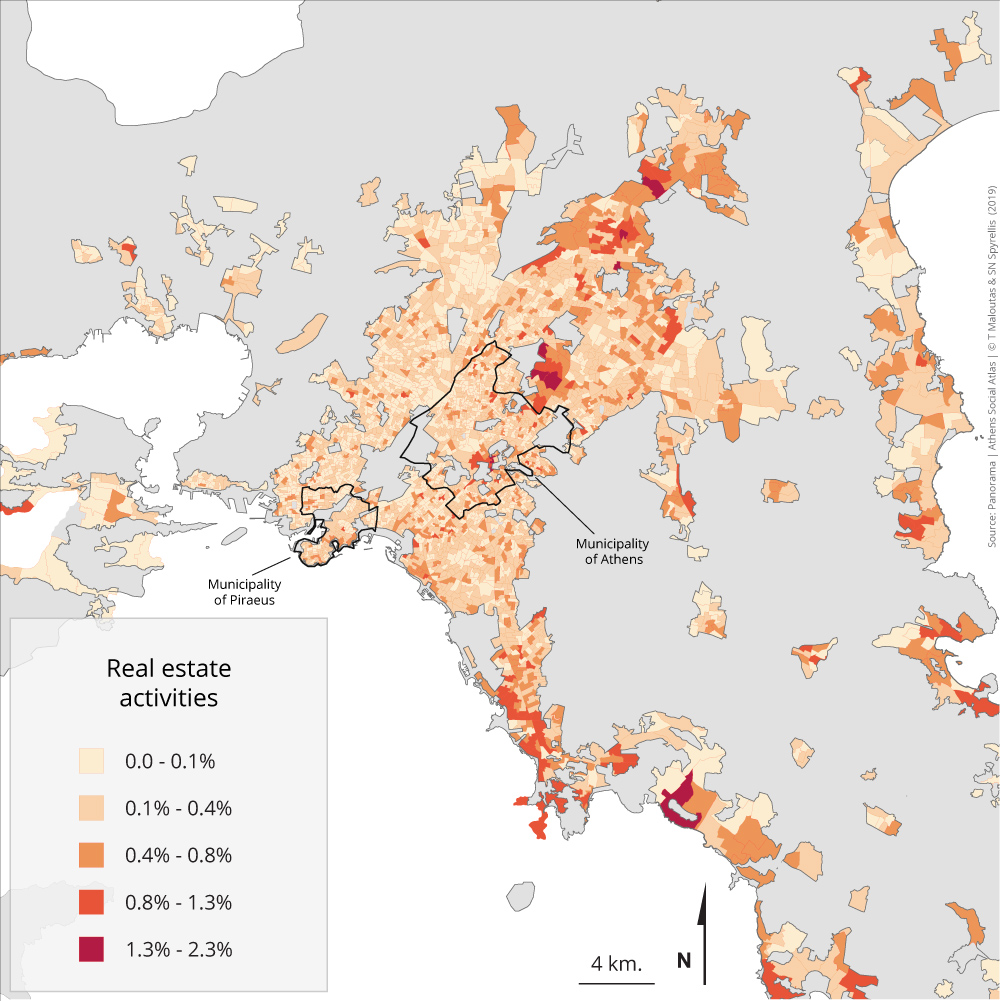
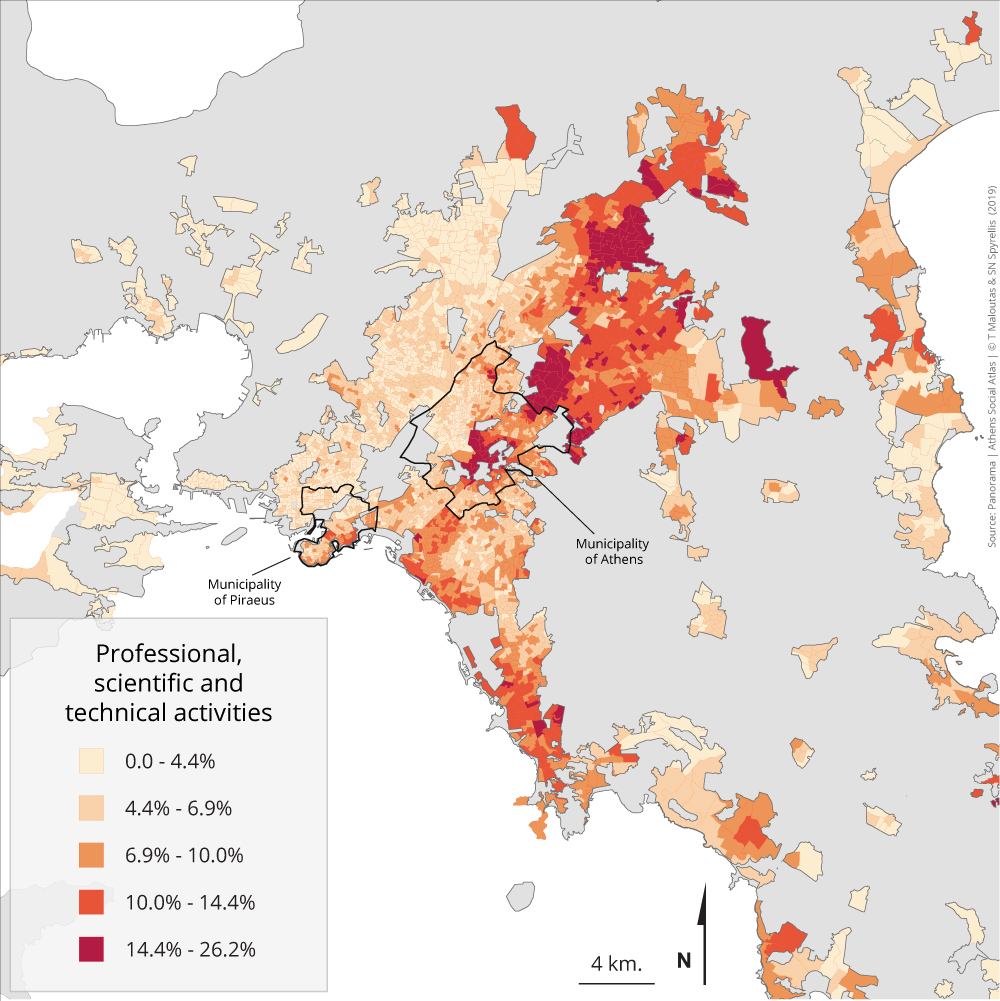
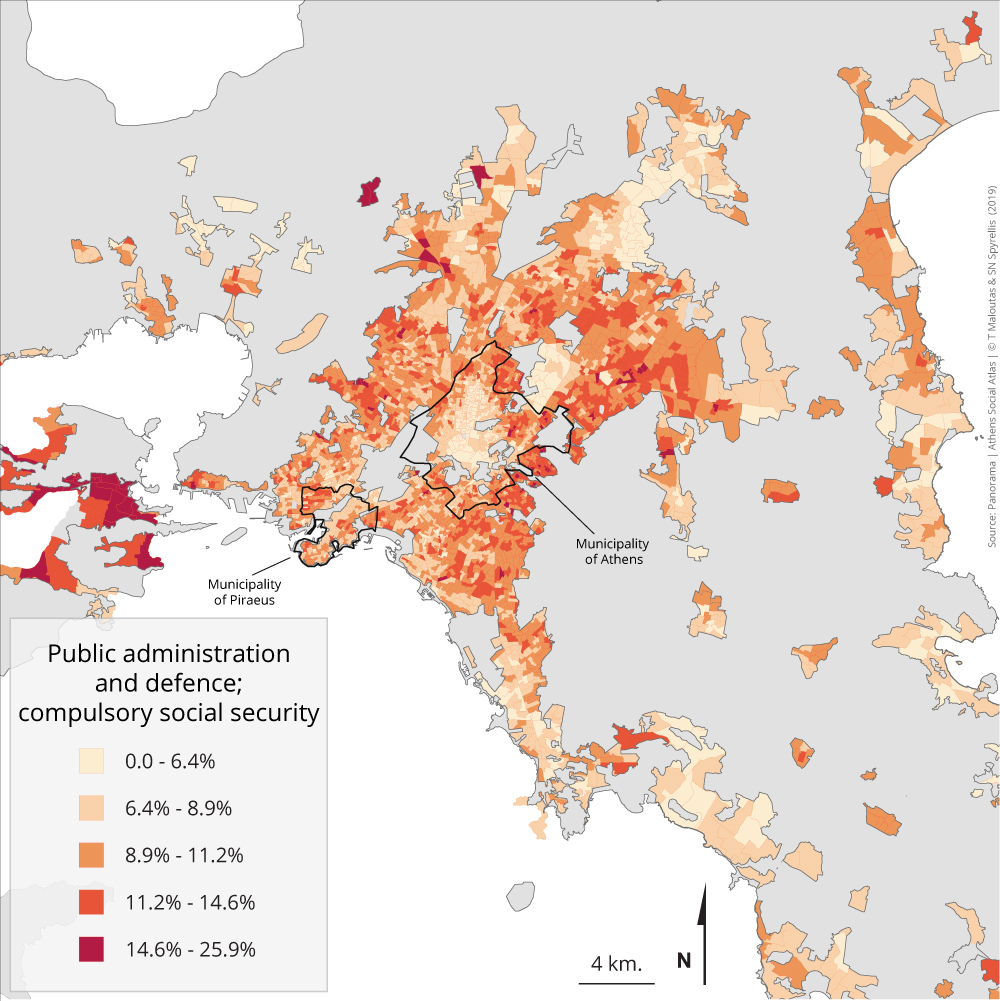
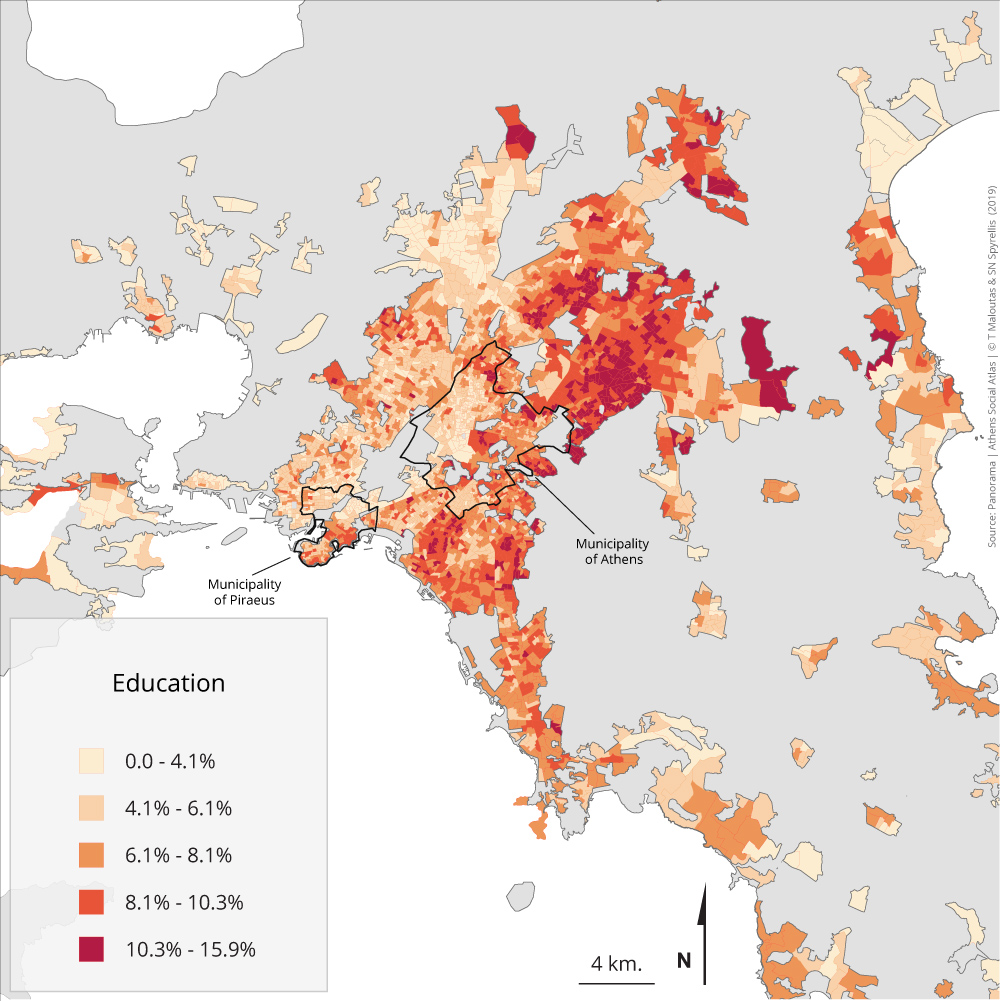
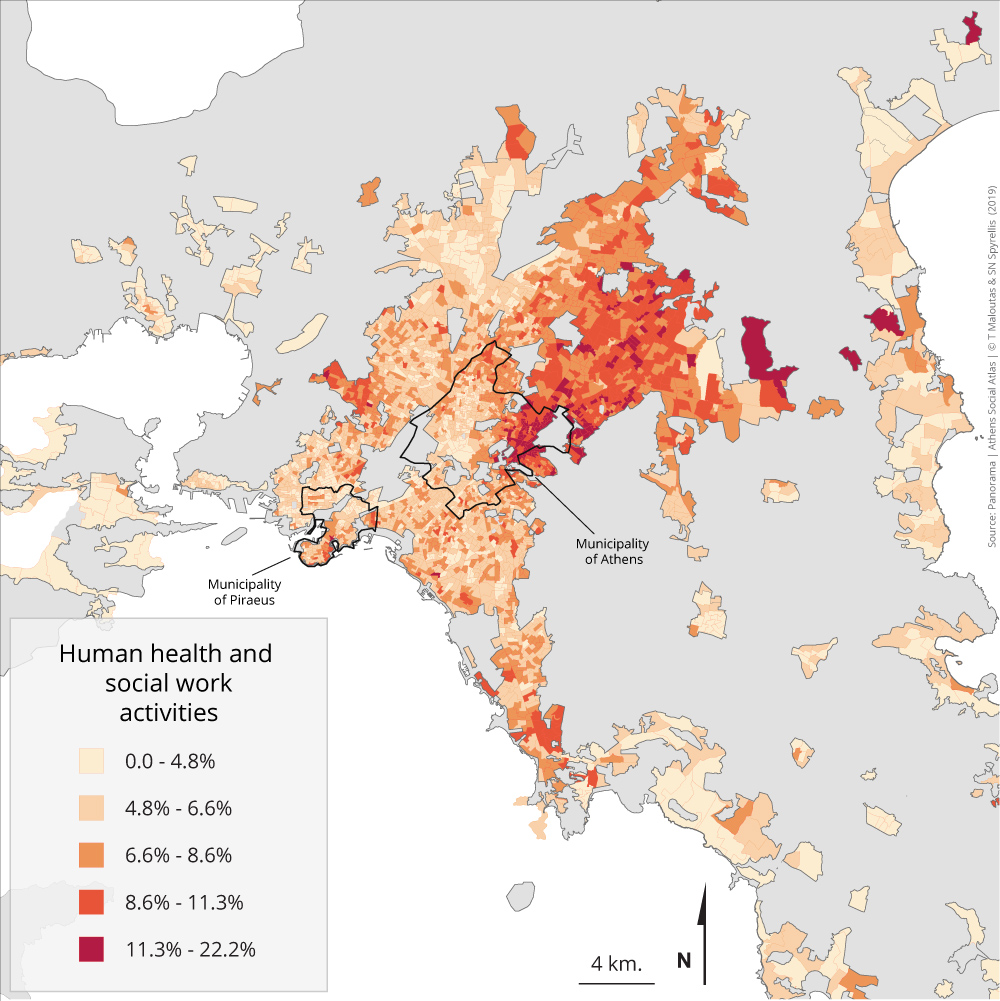
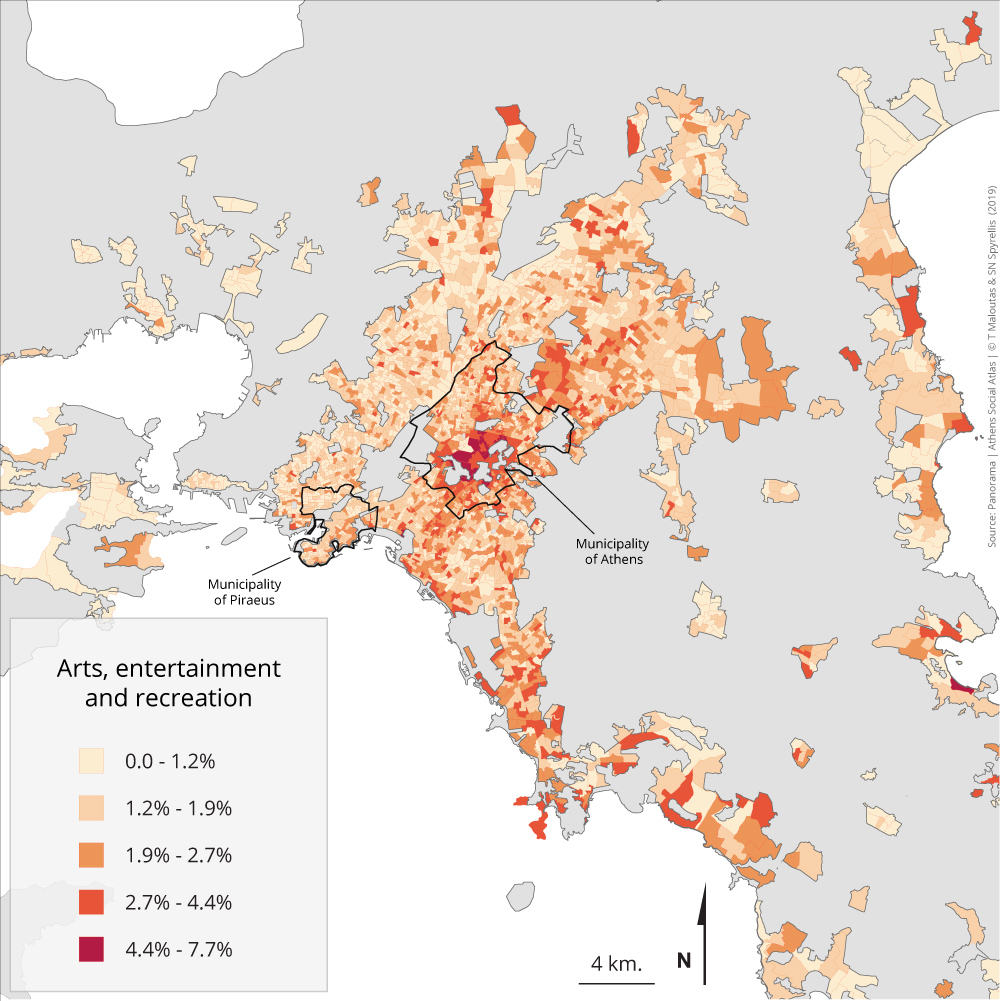
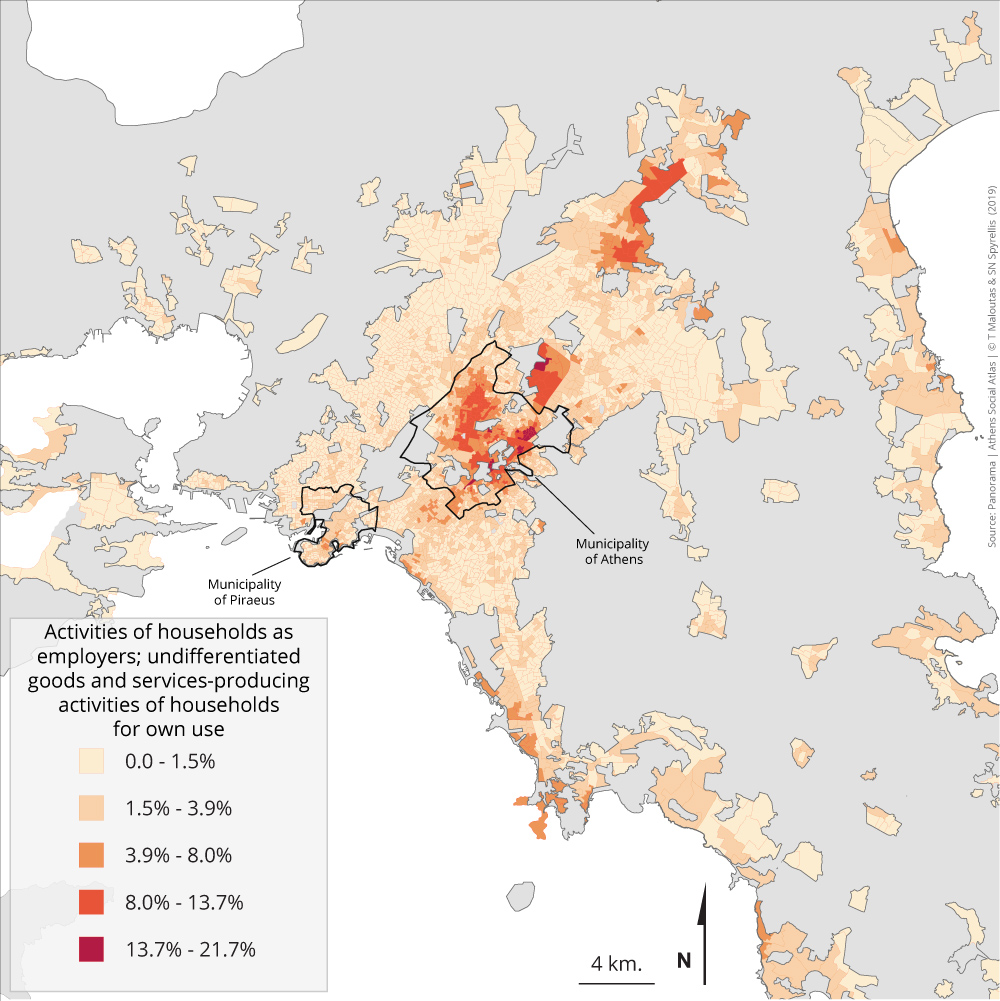
The maps in this section depict the distribution of the active population in the residential areas of the metropolis by branch of economic activity. Those in the two main branches of the secondary sector—industry and construction—are usually located in the western part of the city and in the distant periphery, with those employed in construction being more concentrated in the northwestern part of the agglomeration. Those in retail and wholesale commerce—the largest branch—and in logistics and storage are also located to the west. Logistics and storage are particularly concentrated in and around Piraeus, due to their connection with maritime/shipping activities. Those active in the branches of hotels and restaurants, in administrative and support services, and in the arts and leisure branches are more evenly distributed in throughout the city space. All the other branches of services are primarily located in the eastern part of the city and, particularly, in the suburban residential areas of the upper and upper-middle occupational groups.
Table 3.4: Distribution of the active population of Attiki (except islands) by 1-digit branch of economic activity 2011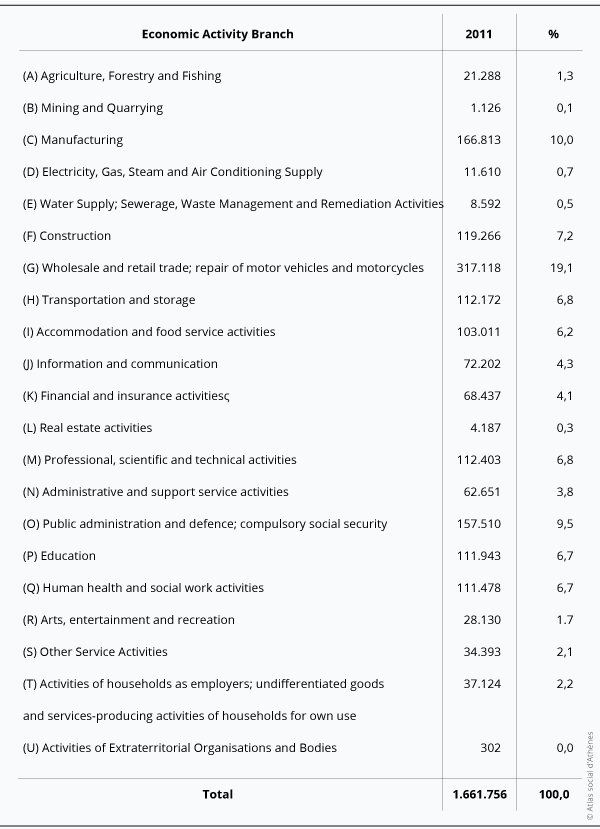
Data source: EKKE-ELSTAT (2015)
Maps 4.1.1 – 4.1.5: Population distribution by main source of income and area of residence (2011)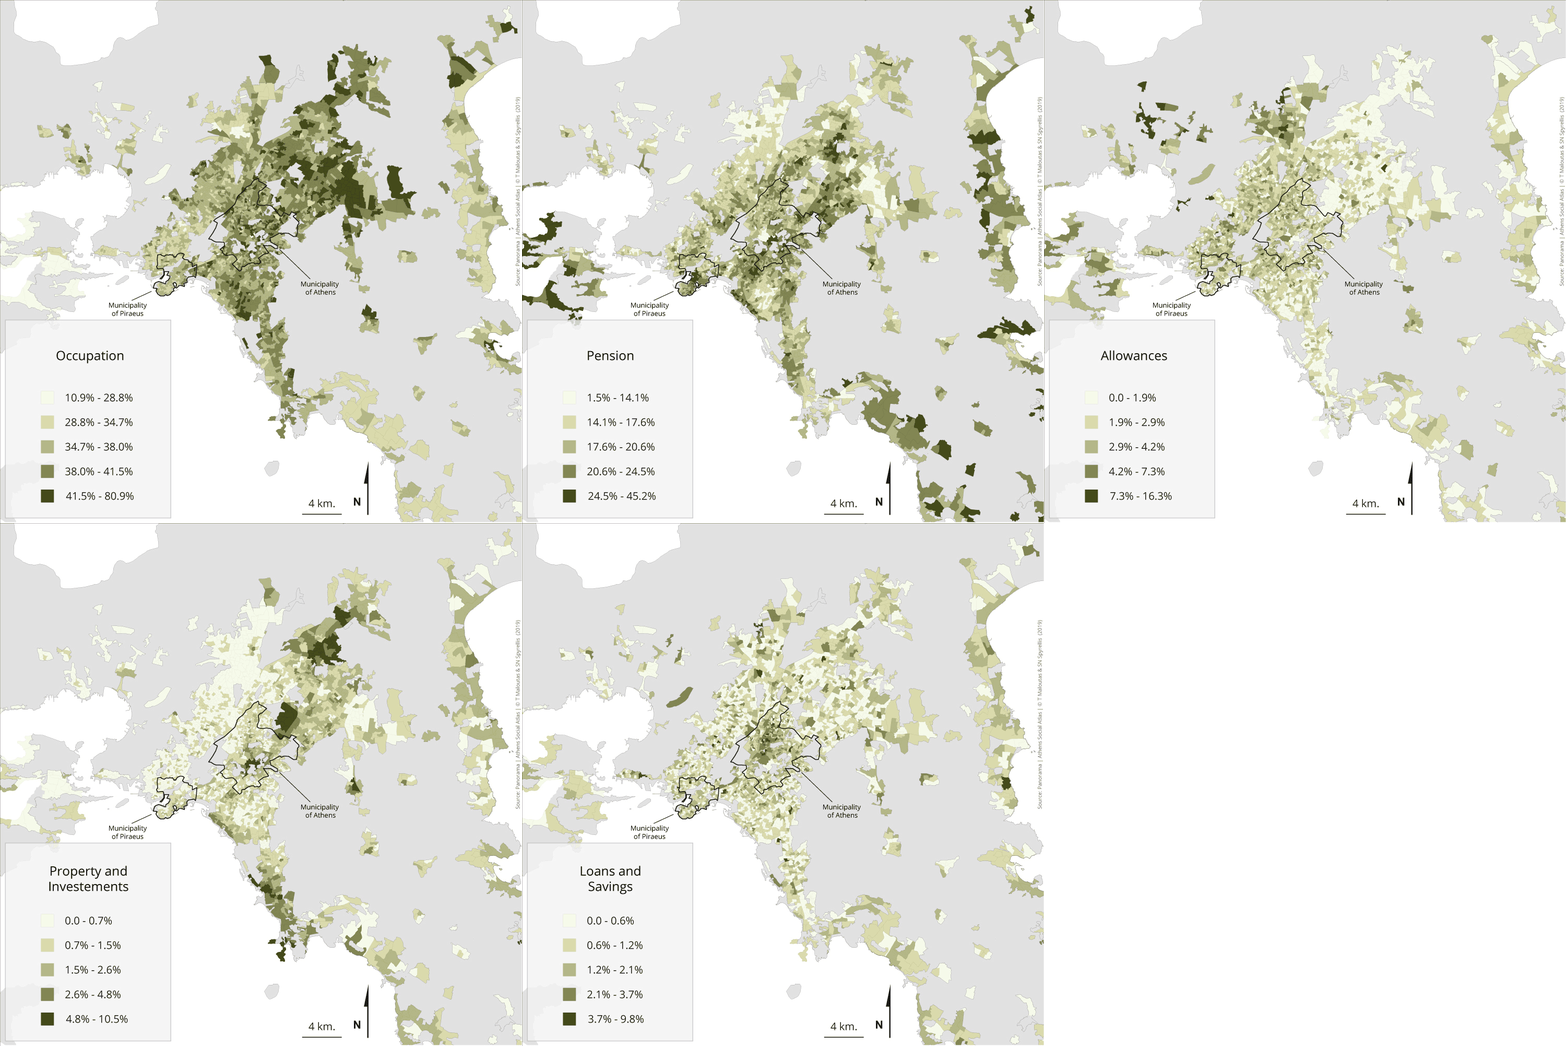
The main sources of income were registered for the first time in the census of 2011. The information about the sources of income is relatively limited since only the main source of income for each household has been registered.
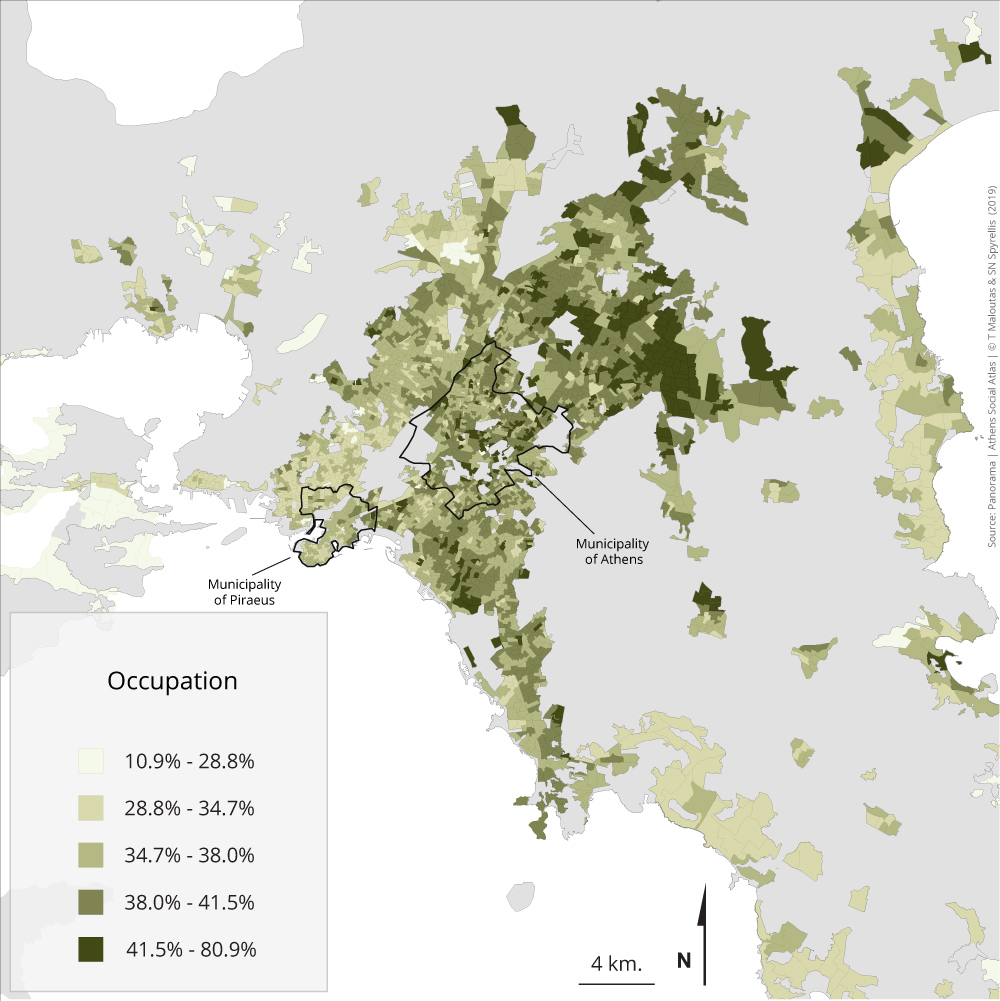
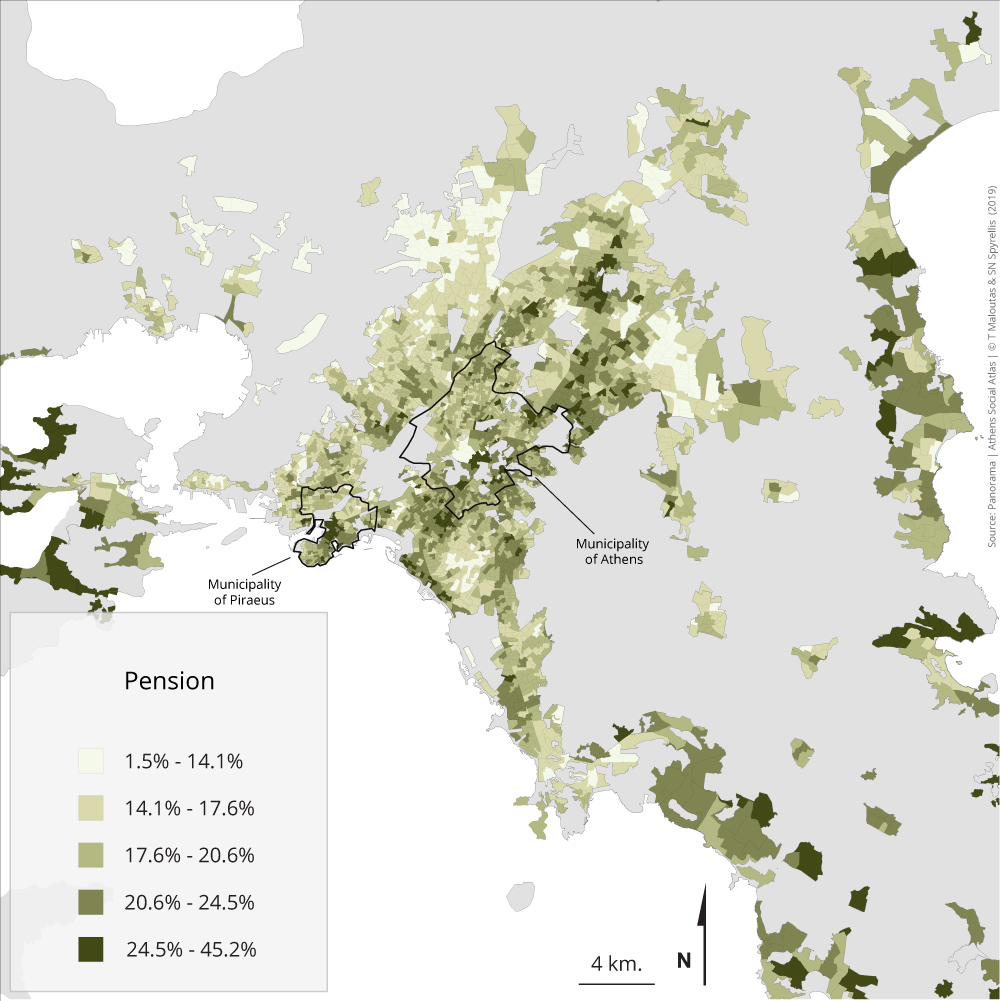
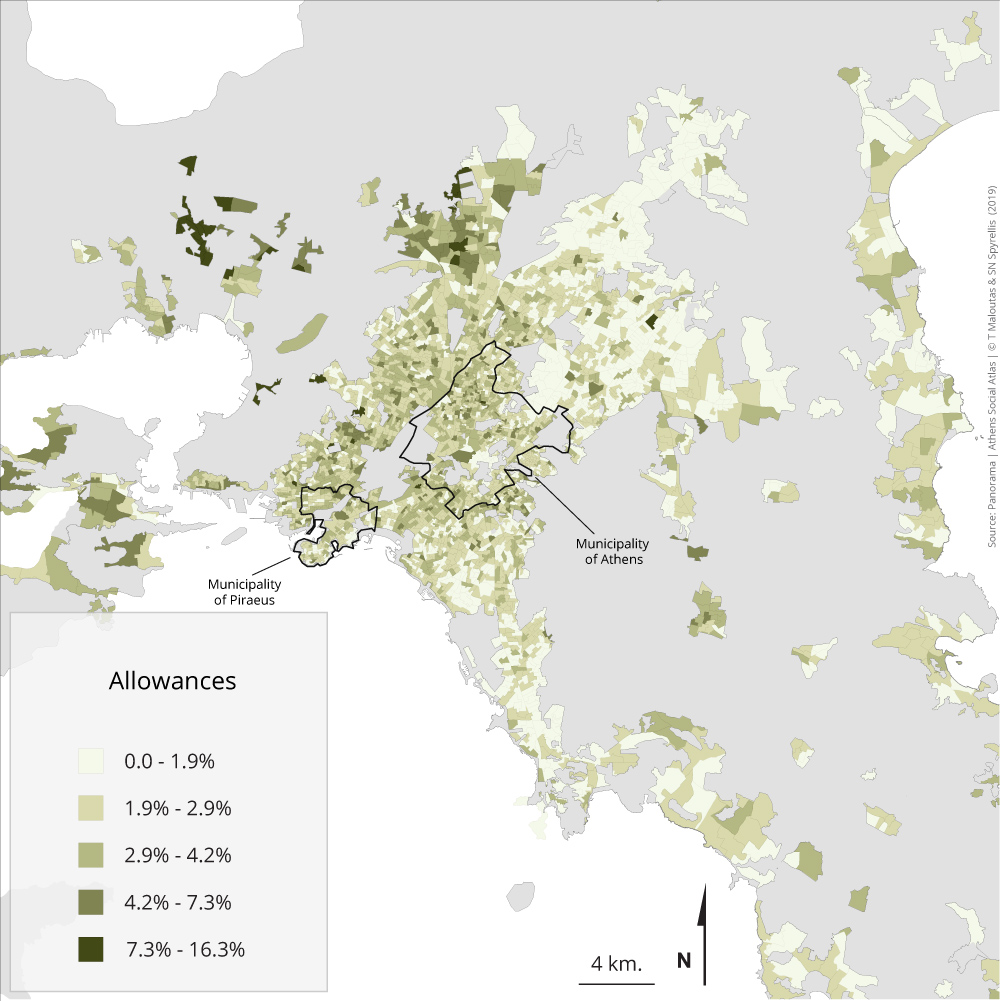
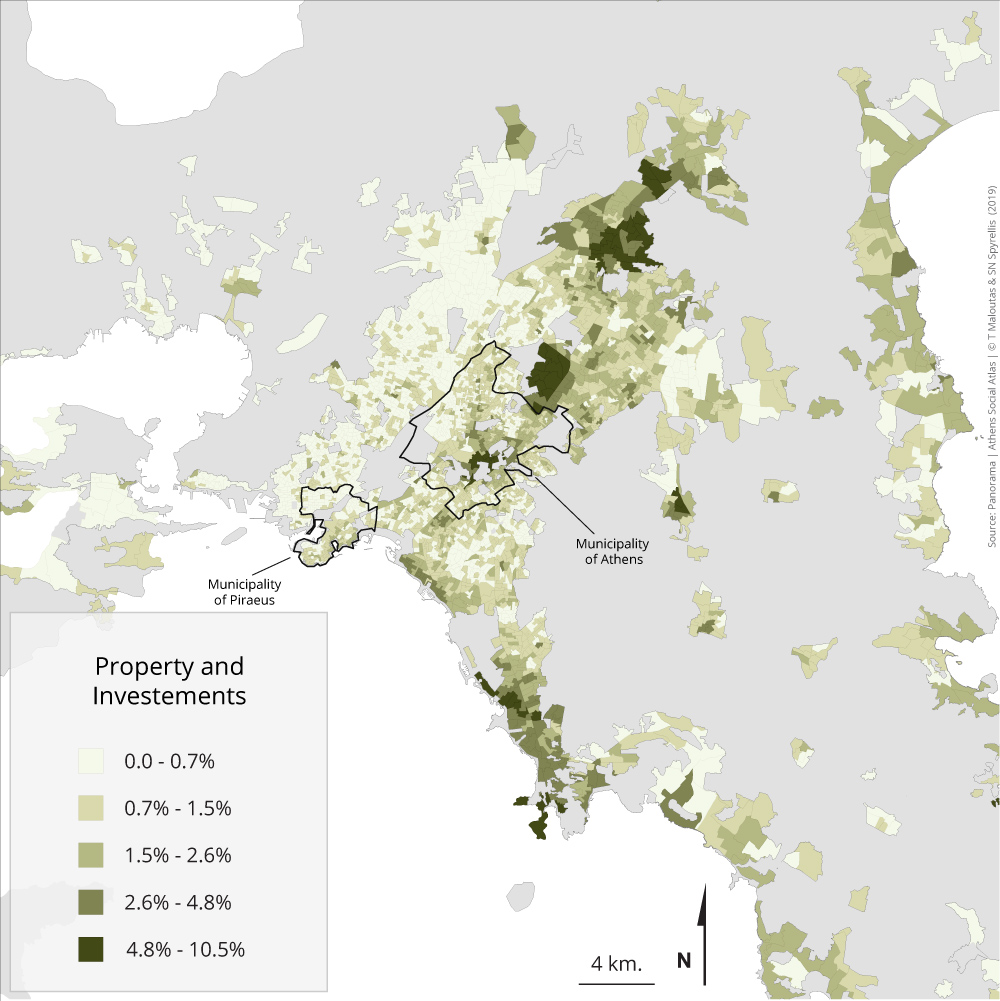
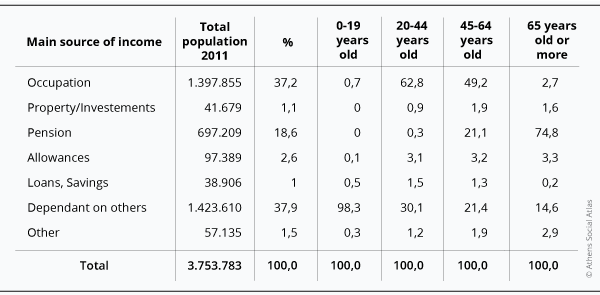
Table 4.1 shows that the most important source of income is remuneration from employment. The category “Dependence from others” refers to members of households without personal resources supported by other members. It can be reasonably assumed that the source of income for those dependent from others is not different from the distribution among the other categories of this table. On the other hand, there are important differences in terms of sources of income among different age categories, as shown in table 4.1. Secondary sources, in terms of specific weight—like fortune and investment, savings or welfare support—appear less important that in actual terms due to the fact that in the census they are registered only if they are the primary source of income.
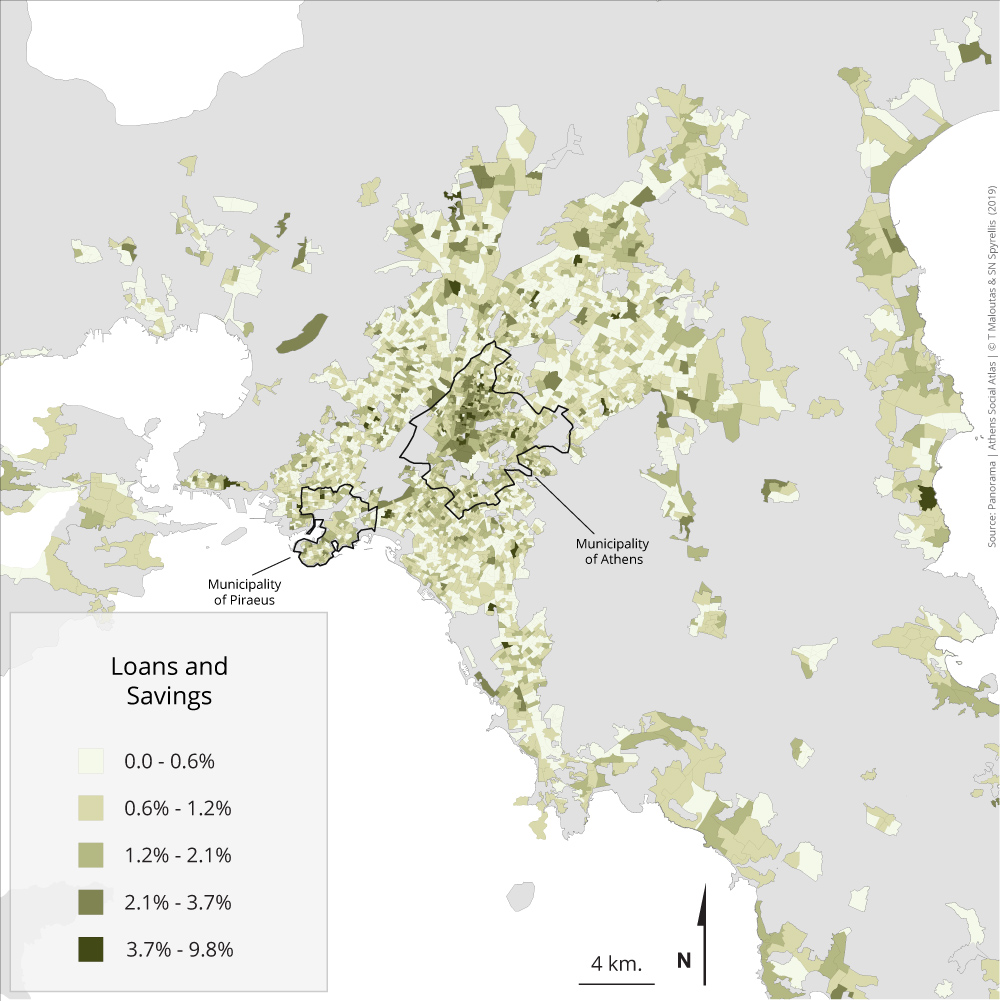
Those for whom revenue from their job is their main source of income are relatively evenly distributed in space, with some higher concentration in the eastern part of the city. For those whose fortune and investments are the primary source of income, residential location is clearly following the overrepresentation pattern of the highest occupational categories. Pensioners for whom pension is the main source of income have a rather even spatial distribution with some concentration in the areas of elderly groups. Those who mainly rely on welfare support are concentrated in the western part of the city and, particularly, in the overrepresentation areas of the lowest occupational categories. Finally, those who mostly depend on savings and loans are also rather evenly distributed in space with some concentration in the densely populated and poor areas of the western part of the city centre. This source of income is related to some extent to the immigrant population, but assumptions are rather weak since it involves relatively small numbers.
Table 4.1: Population distribution by main source of income and by age group in Attiki (except the islands) (2011)
Data source: EKKE-ELSTAT (2015)
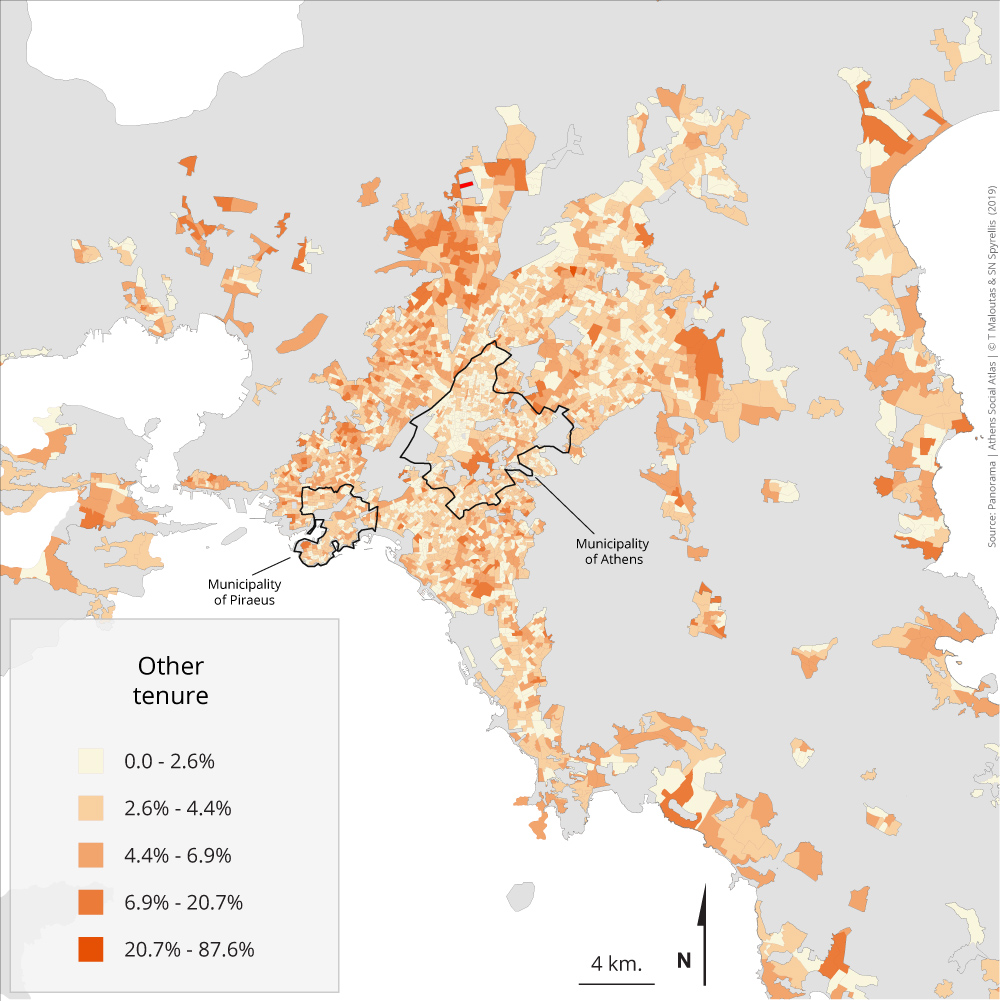
Maps 4.2.1 – 4.2.3: Population distribution by house tenure and area of residence (2011)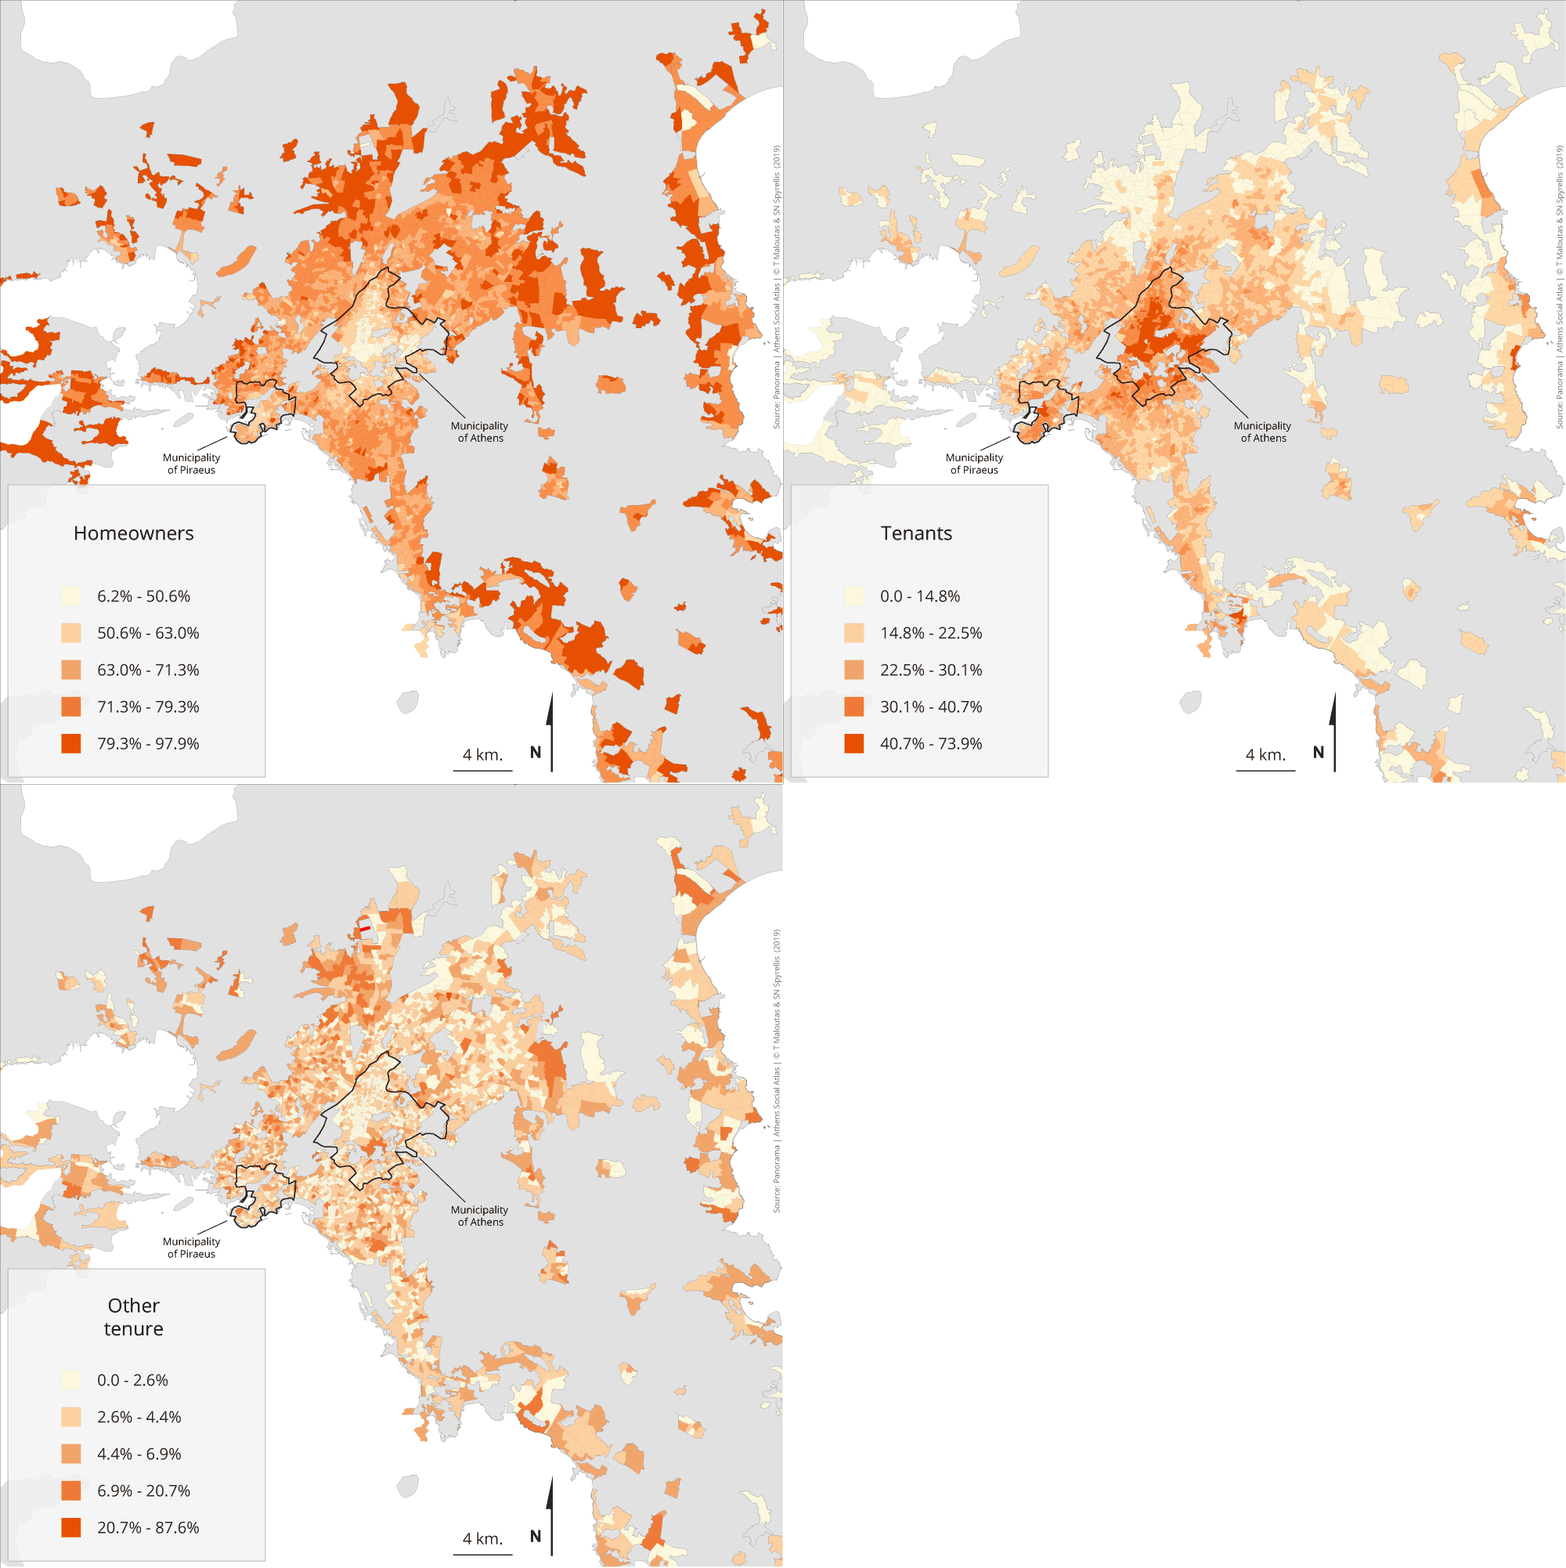
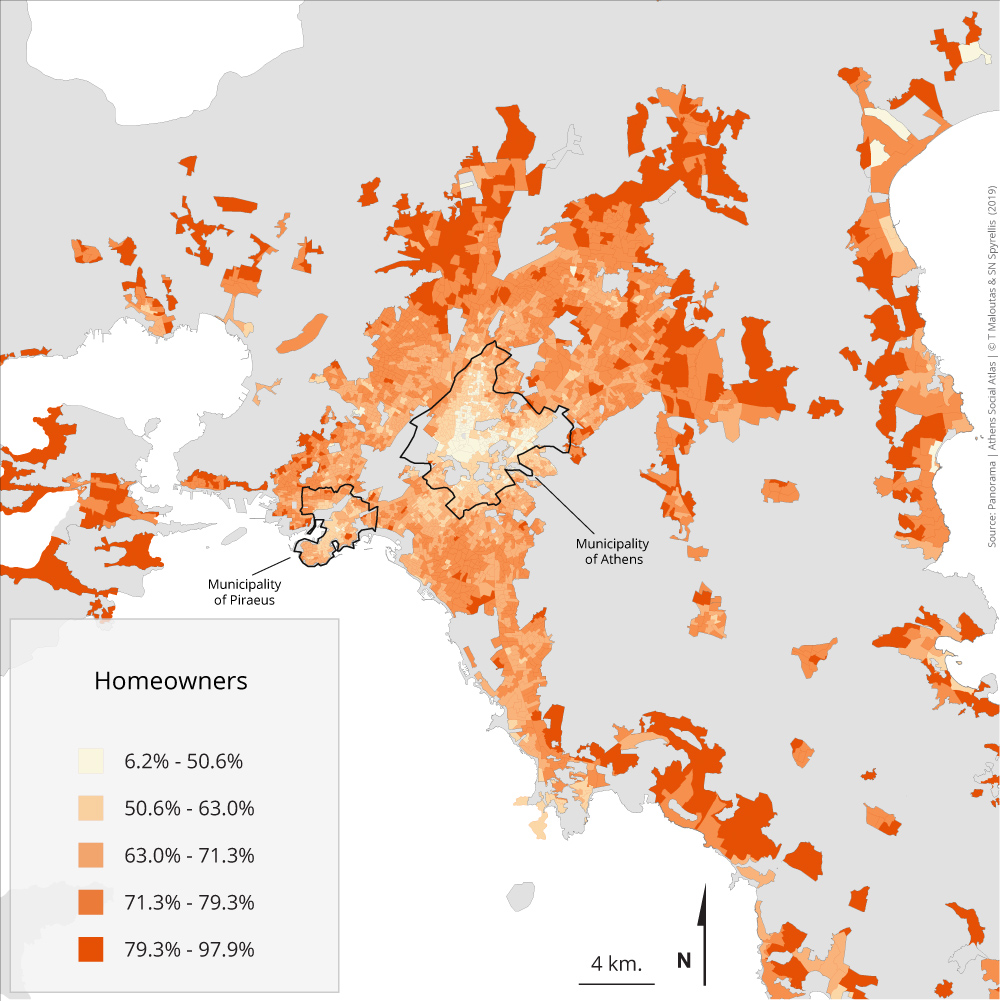
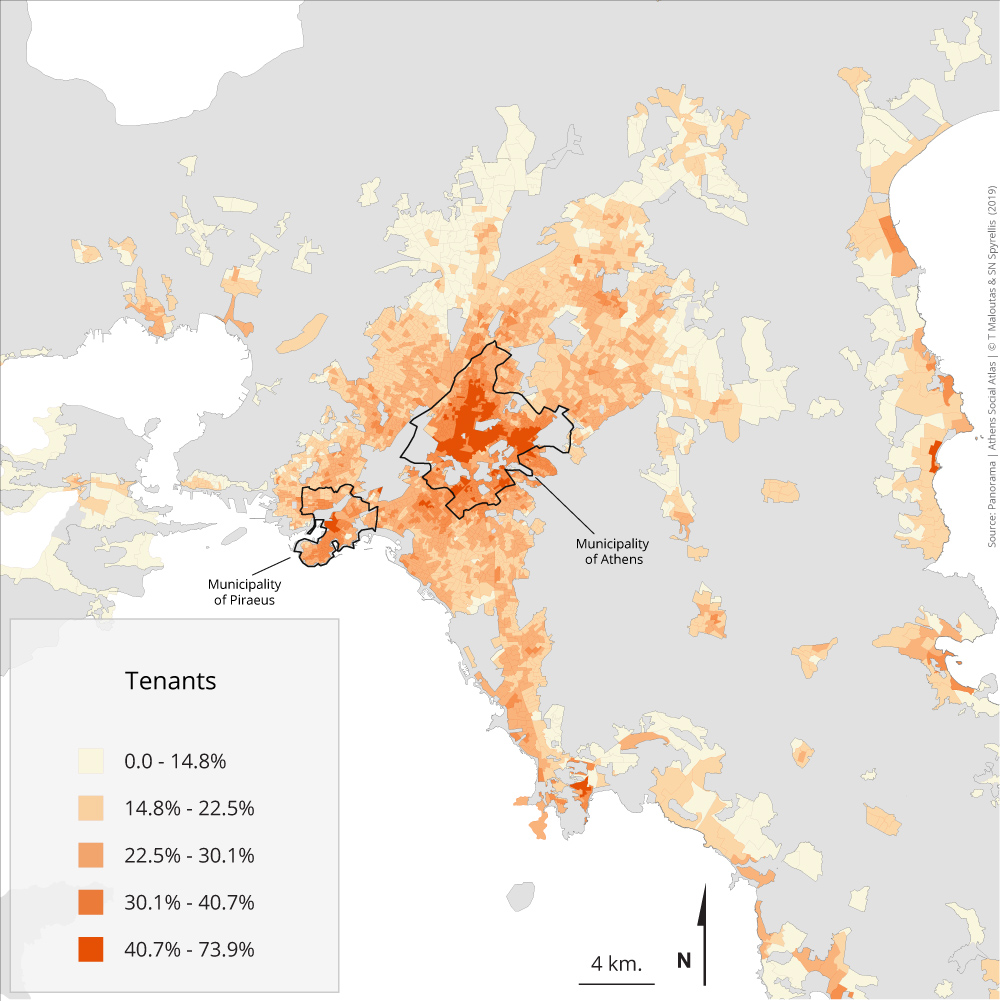
House tenure in Greece and in the other South European countries is less socially differentiated compared to most other European countries. This mainly means that homeownership is not a clear privilege of higher social status compared to rent. The maps in this section show that homeowners are much more concentrated at the periphery of the city, especially in the outskirts, without any clear division between affluent and low-income suburbs. Tenants, on the contrary, are overrepresented in the city centre and in Piraeus, while ‘other tenure’—usually meaning free use of housing provided by some other family member—is much more evenly distributed throughout the city’s residential areas.
Table 4.2 shows the specific weight of the main types of housing tenure and the way they evolved from 1991 to 2011.
Table 4.2: Population distribution by house tenure in Attiki (except islands) 1991-2011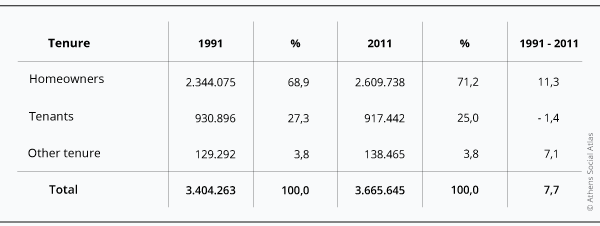
Data source: EKKE-ELSTAT (2015)
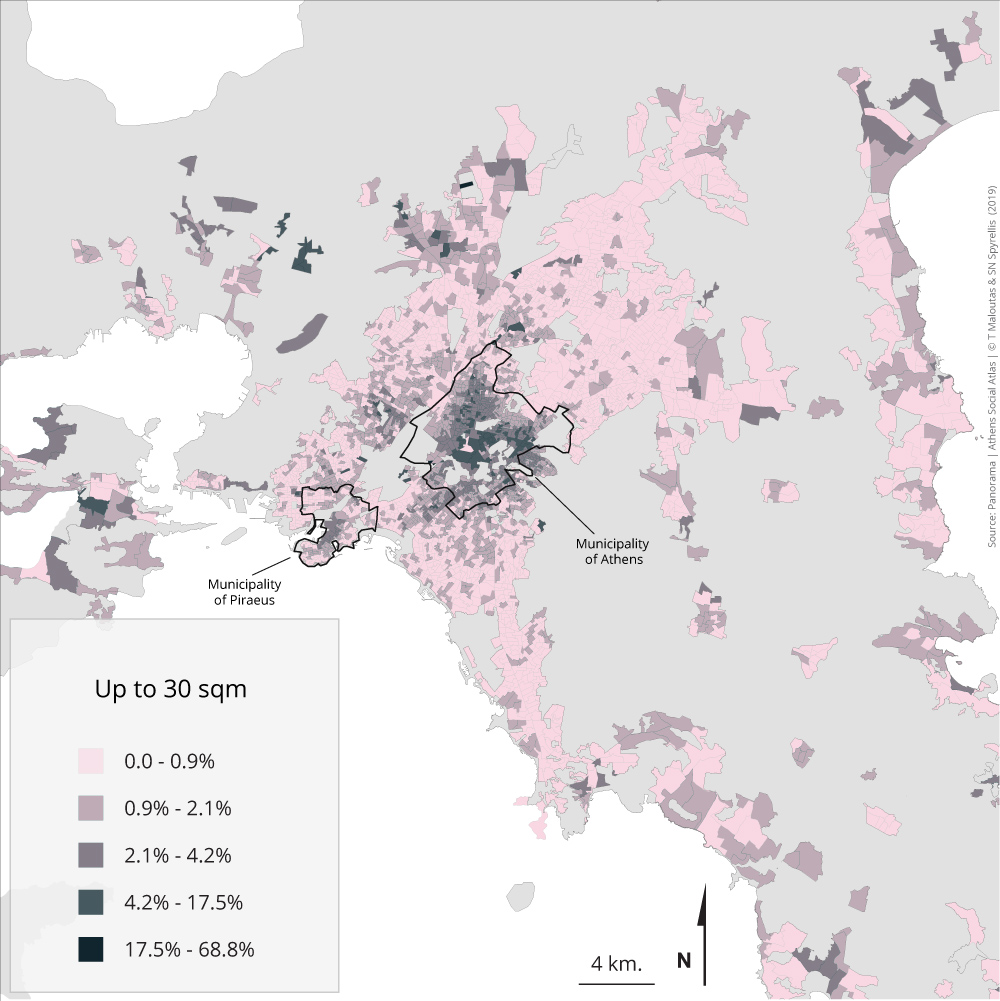
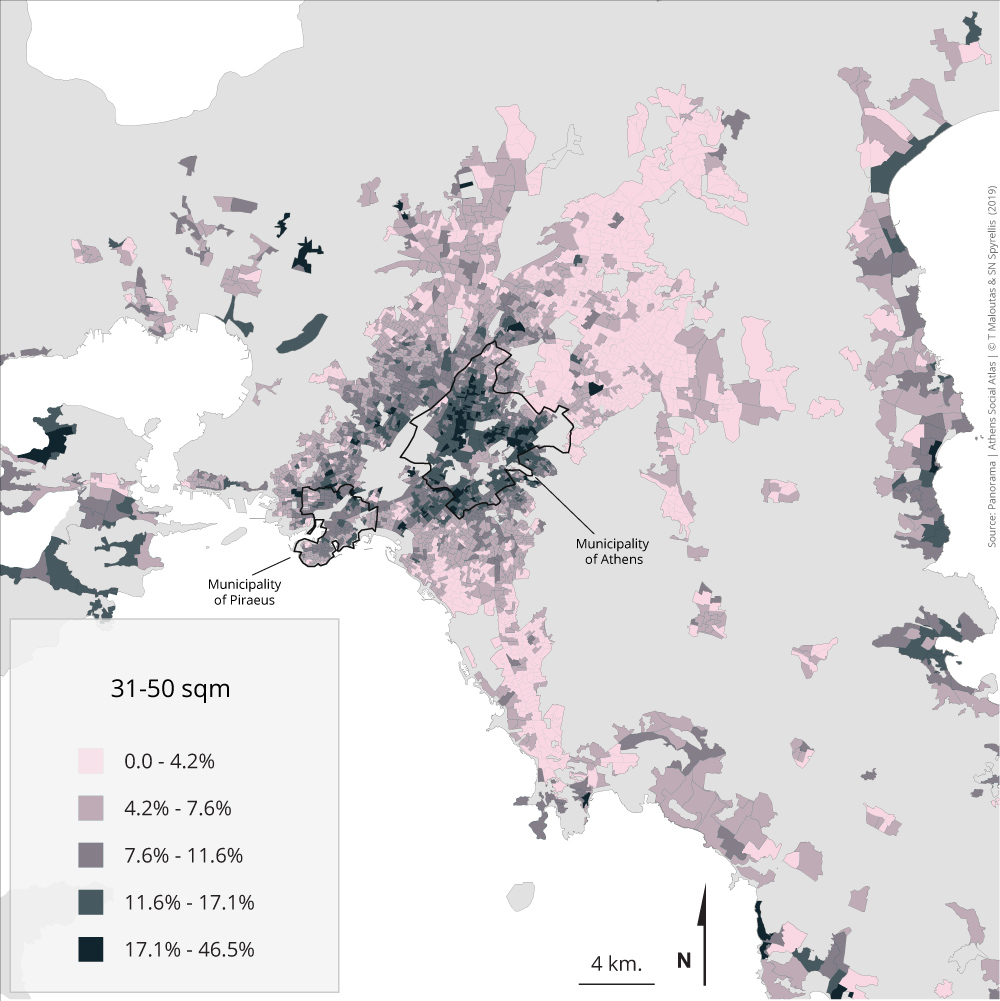
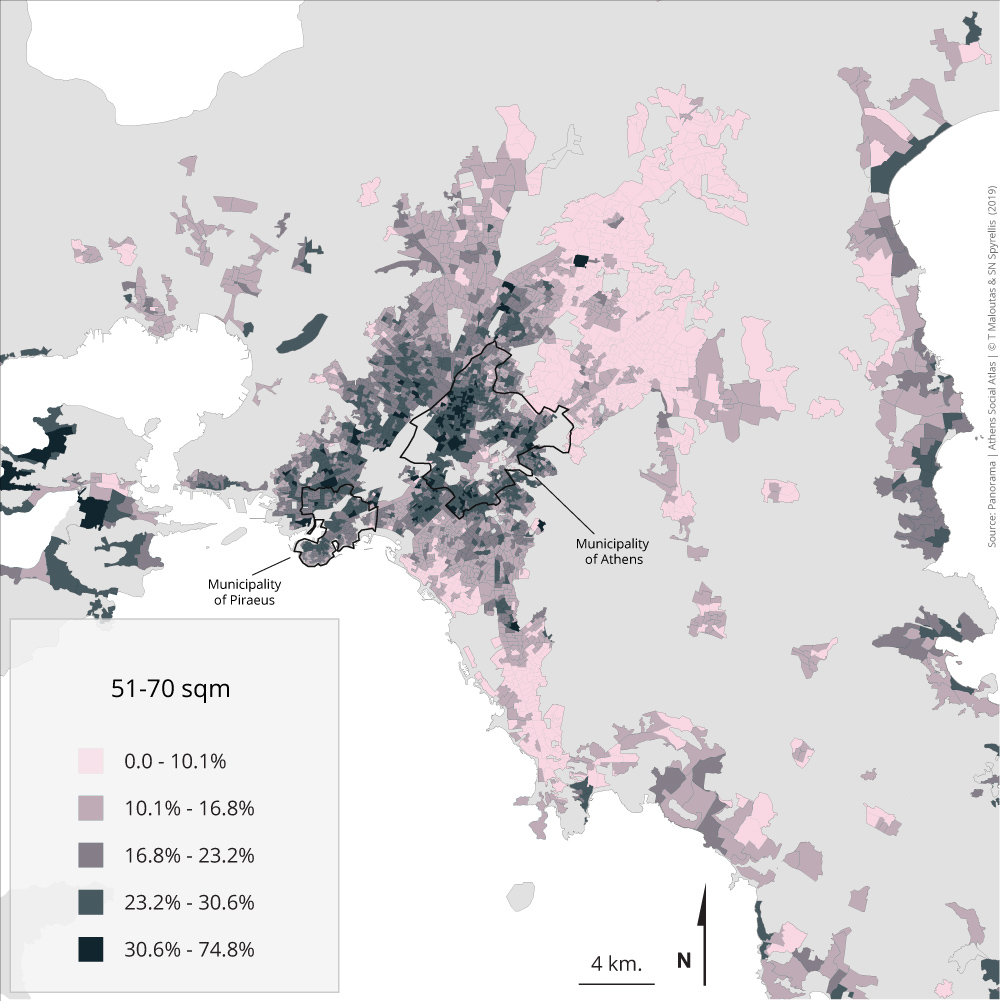
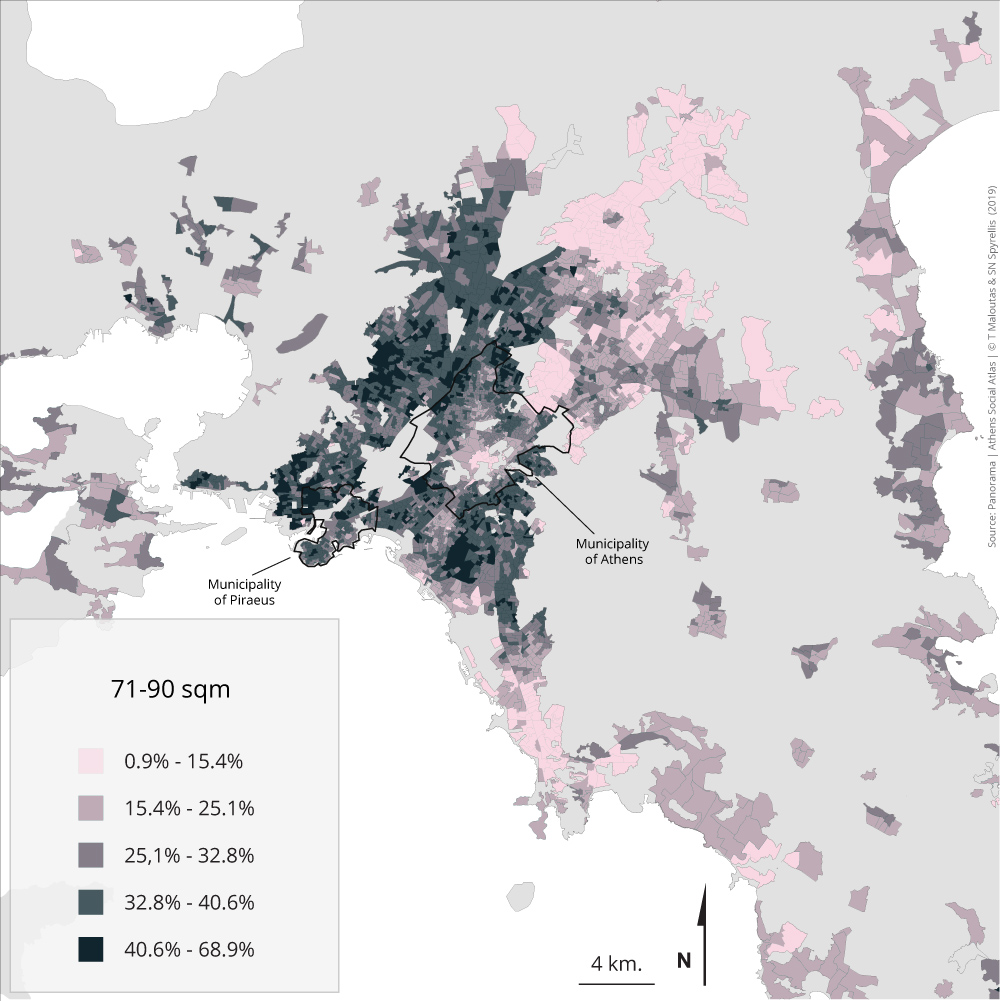
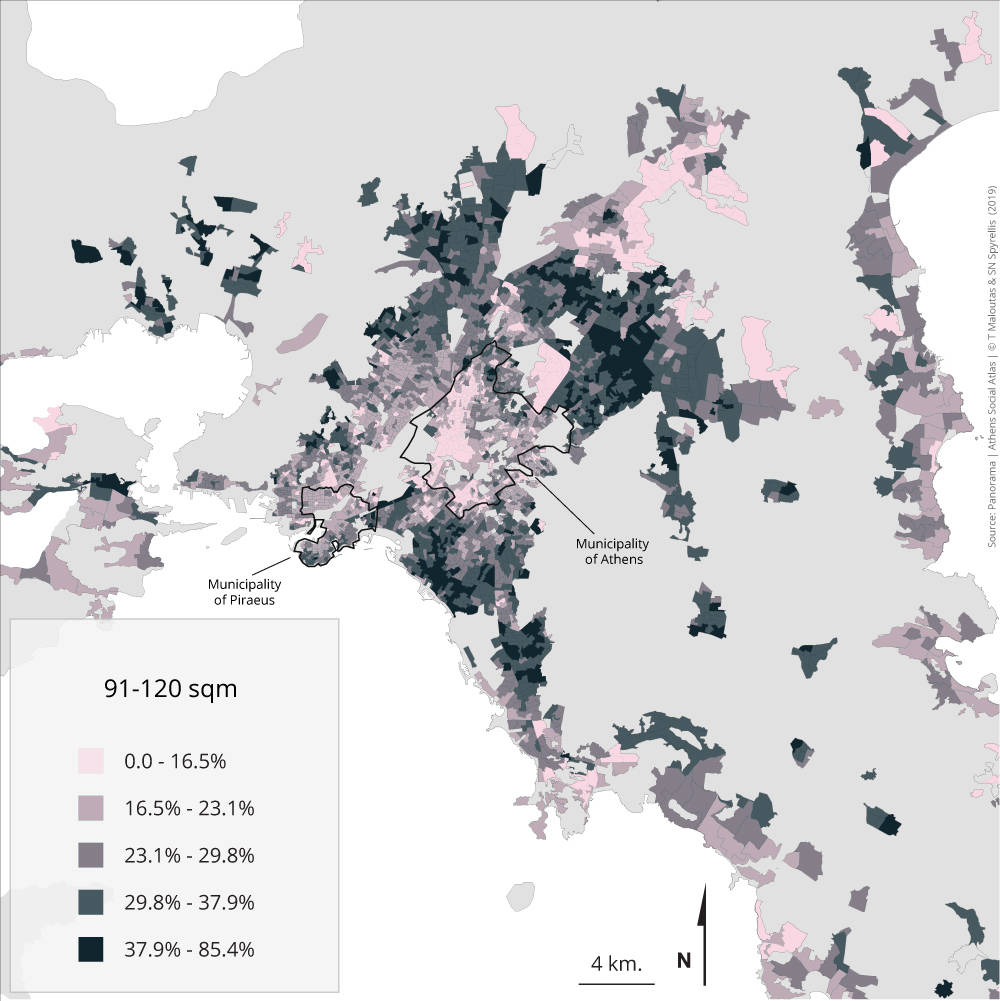
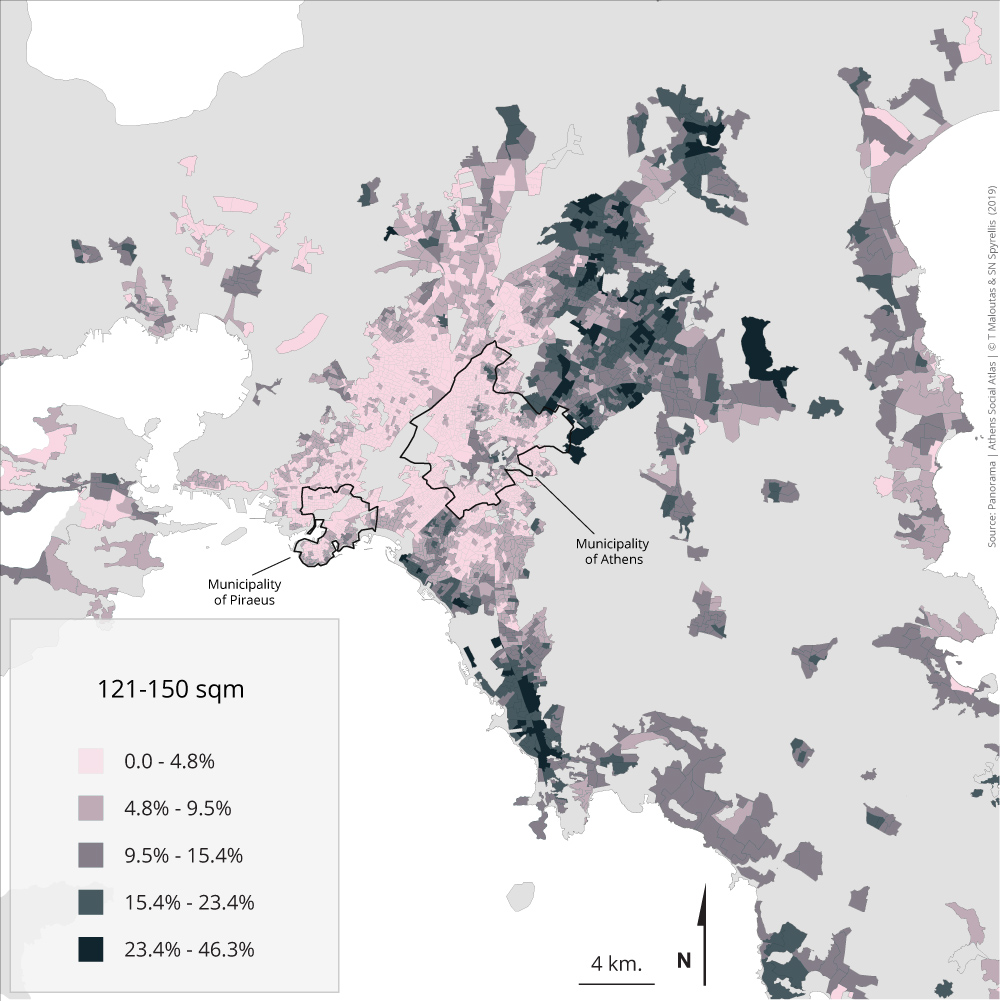
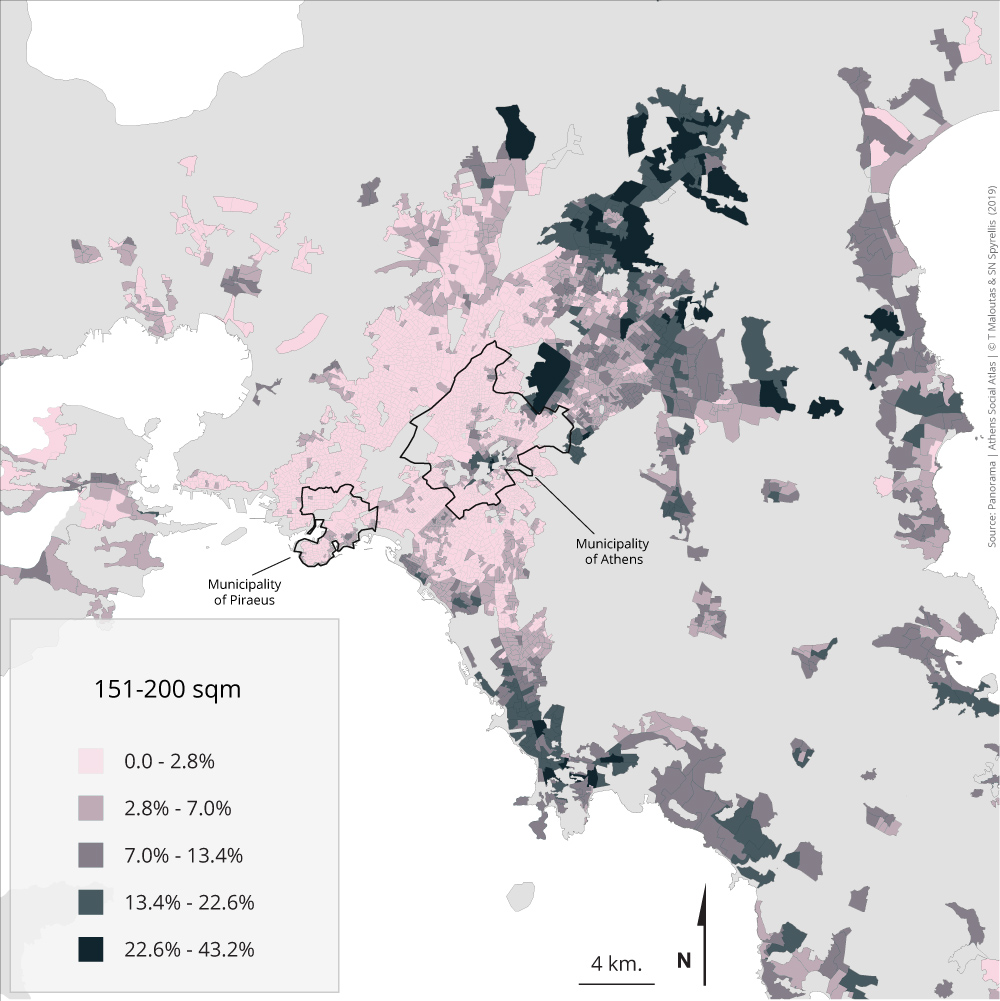
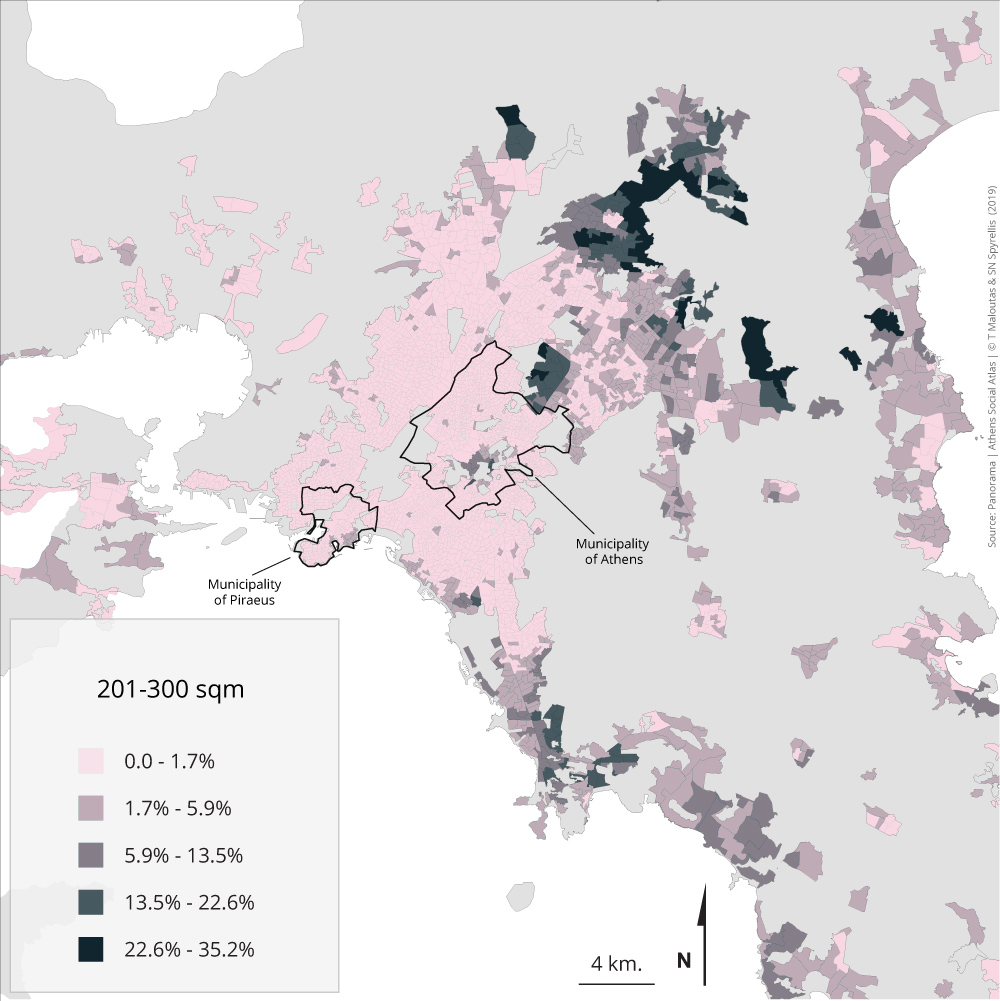
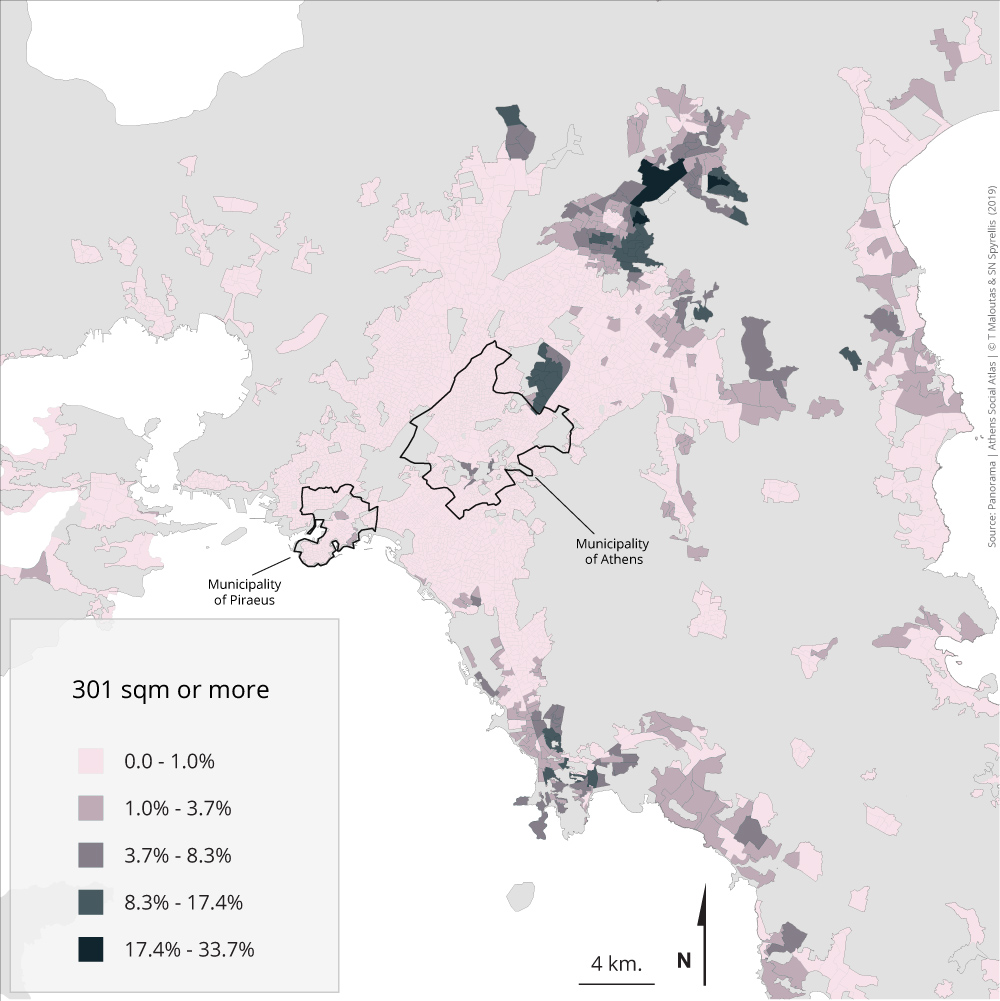
Maps 4.3.1 – 4.3.9: Population distribution by housing unit size and area of residence (2011)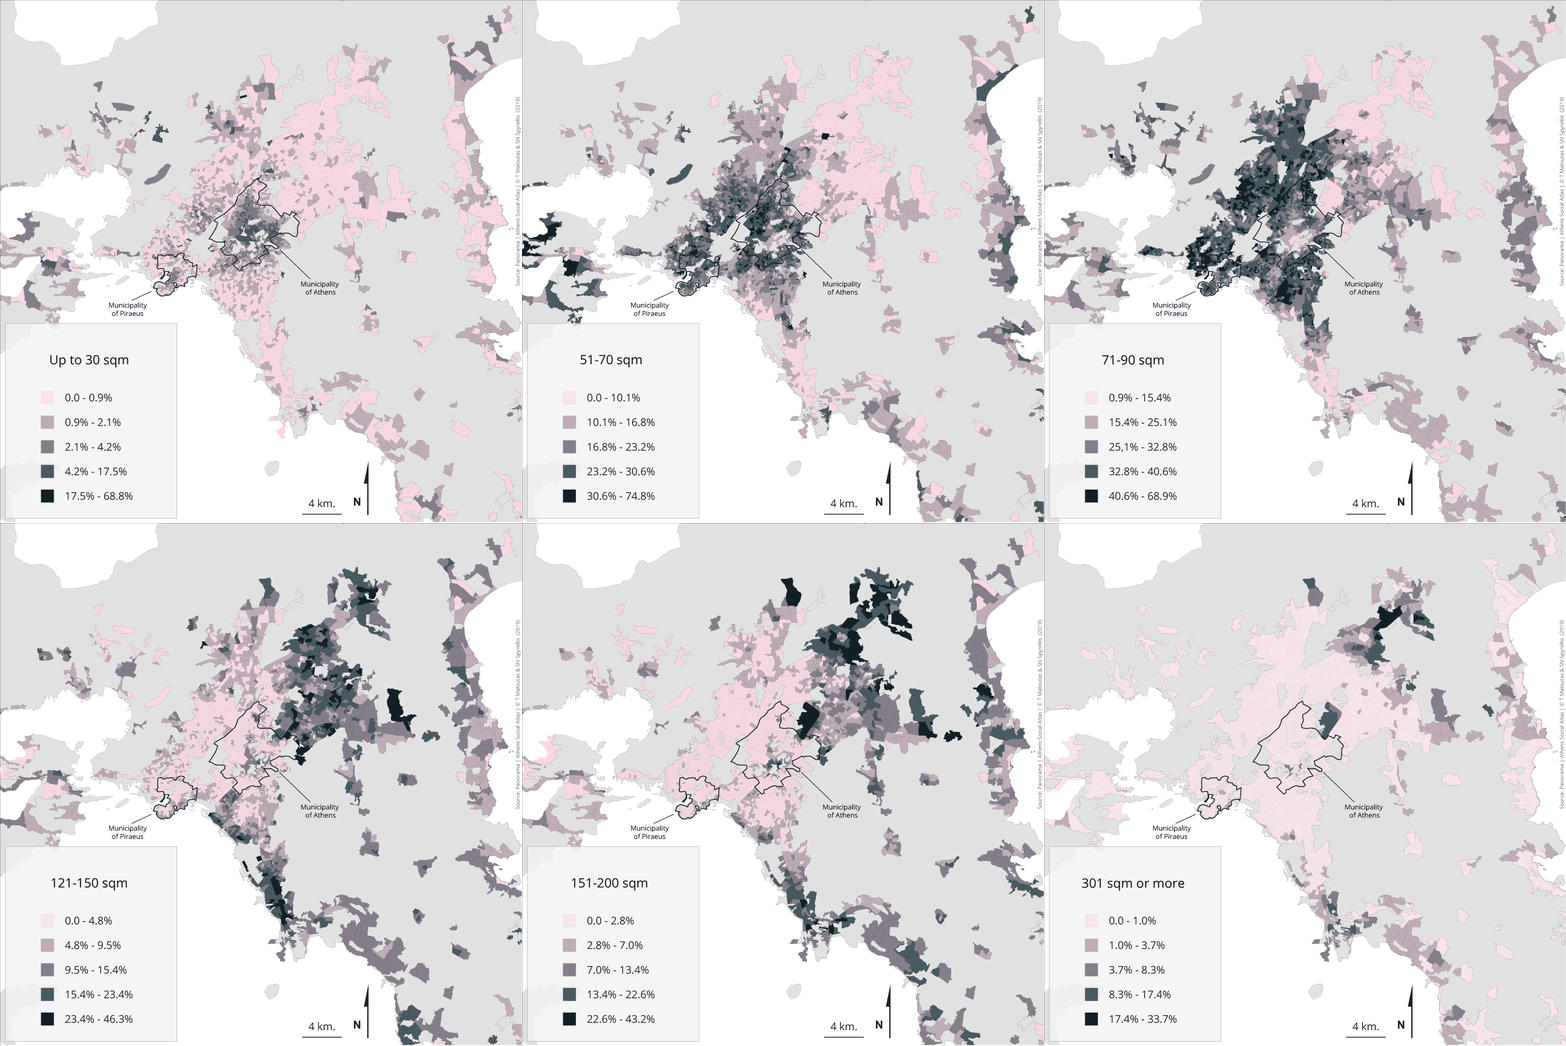
The subject of these maps is quite similar to that of the next section, which deal with the available housing space per household member. The difference is that in the case of housing space per capita the focus is on inequalities among consumers of housing space, while this section is focused on the physical structure of the built environment, i.e. dwellings and the distribution by size and residential area. The presented measure is indirect since for each spatial unit the percentage calculated corresponds to the population living in different categories of house size. This reveals, although indirectly, the geography of housing size in the Greek capital.
The partition of the space of the city according to housing size follows the double movement from east to west and from centre to periphery. Smaller houses (up to 30m2) are mainly concentrated in the city centre and in some poor neighbourhoods of distant suburbs of the western periphery. The next level (31-50m2) follows a similar pattern, but is also expanded in a large part of western suburbs. This is also true for the next level (51-70m2). The next size category (71-90m2)—the largest one—is concentrated at the outskirts of the central municipality and in the adjacent quarters of its neighbouring municipalities, except the part towards the east, as well as in Piraeus and its surroundings. The next category (91-120m2)—the second largest—is concentrated mainly in the close middle-class suburbs to the north and south, while the largest size categories are overrepresented in the most exclusive strongholds of the highest occupational categories.
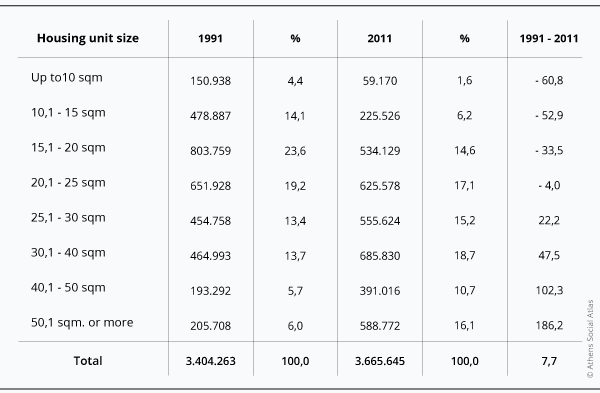
Table 4.3: Population distribution in Attiki (except islands) by housing size (2011)
Data source: EKKE-ELSTAT (2015)
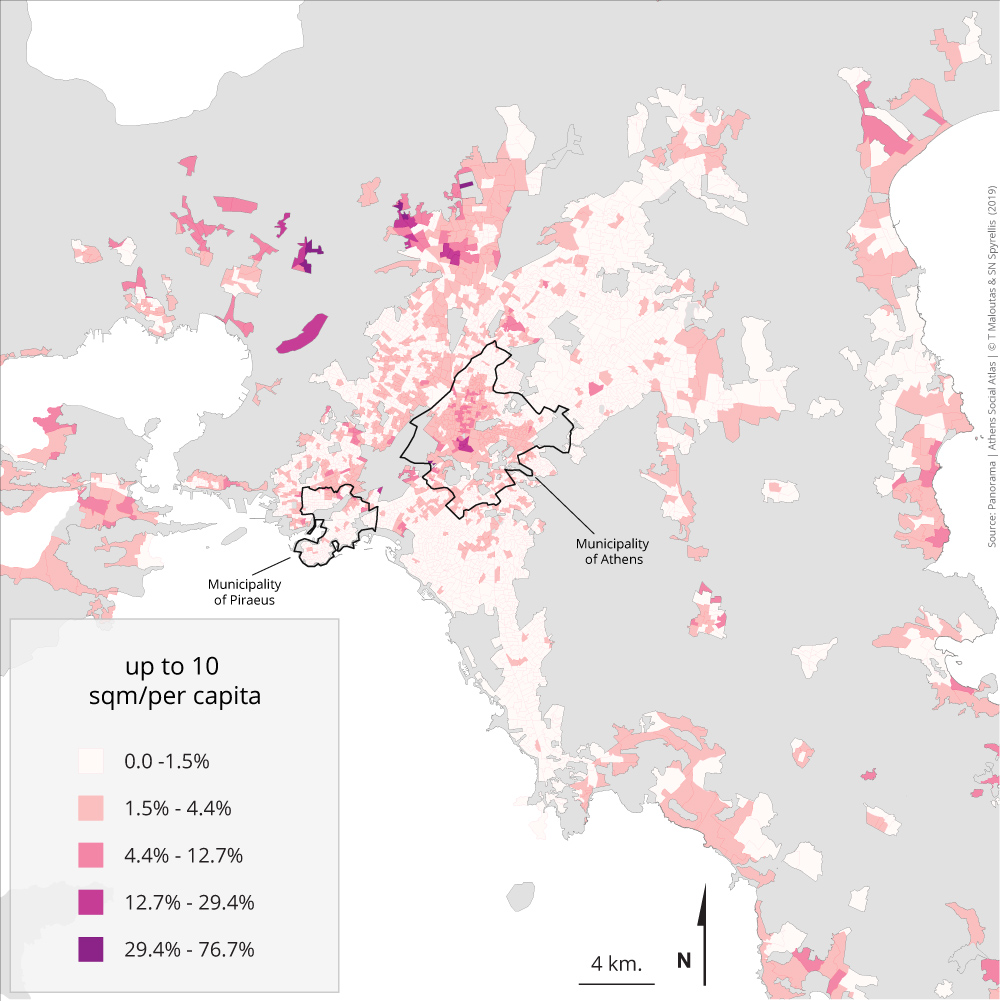
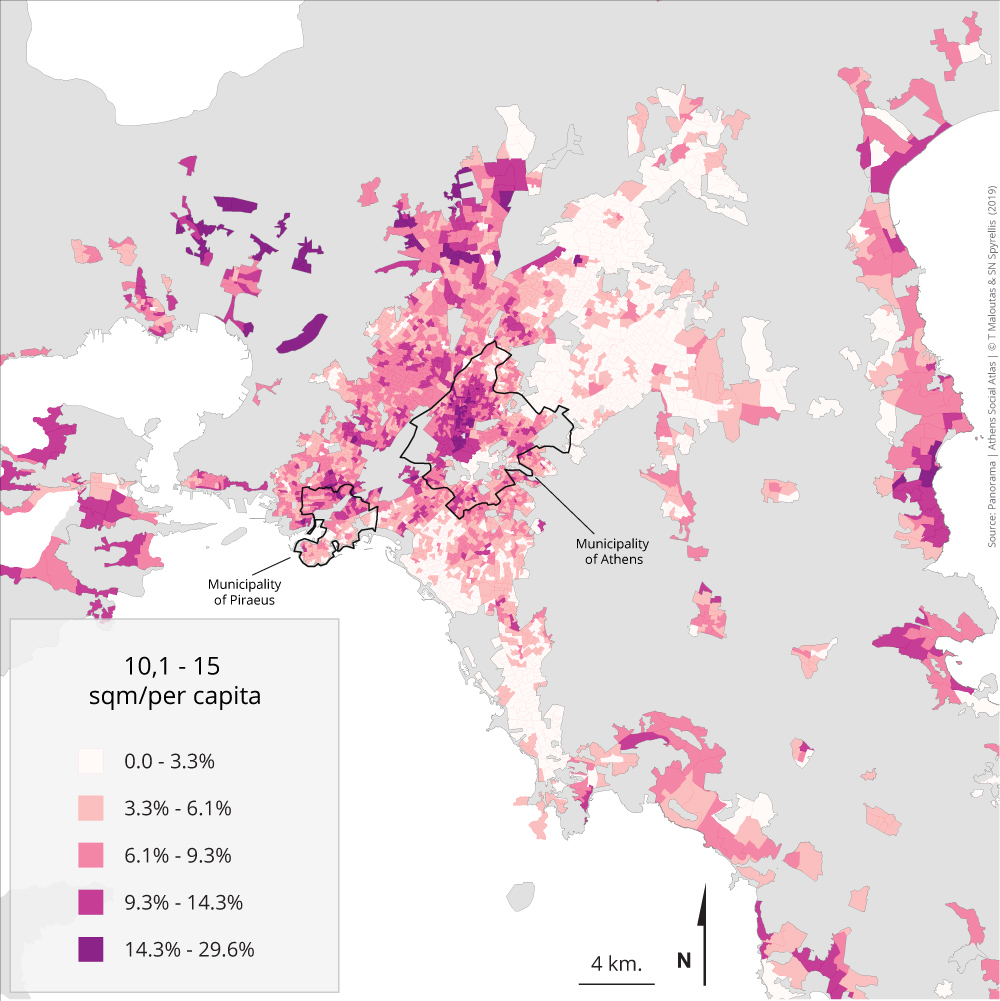
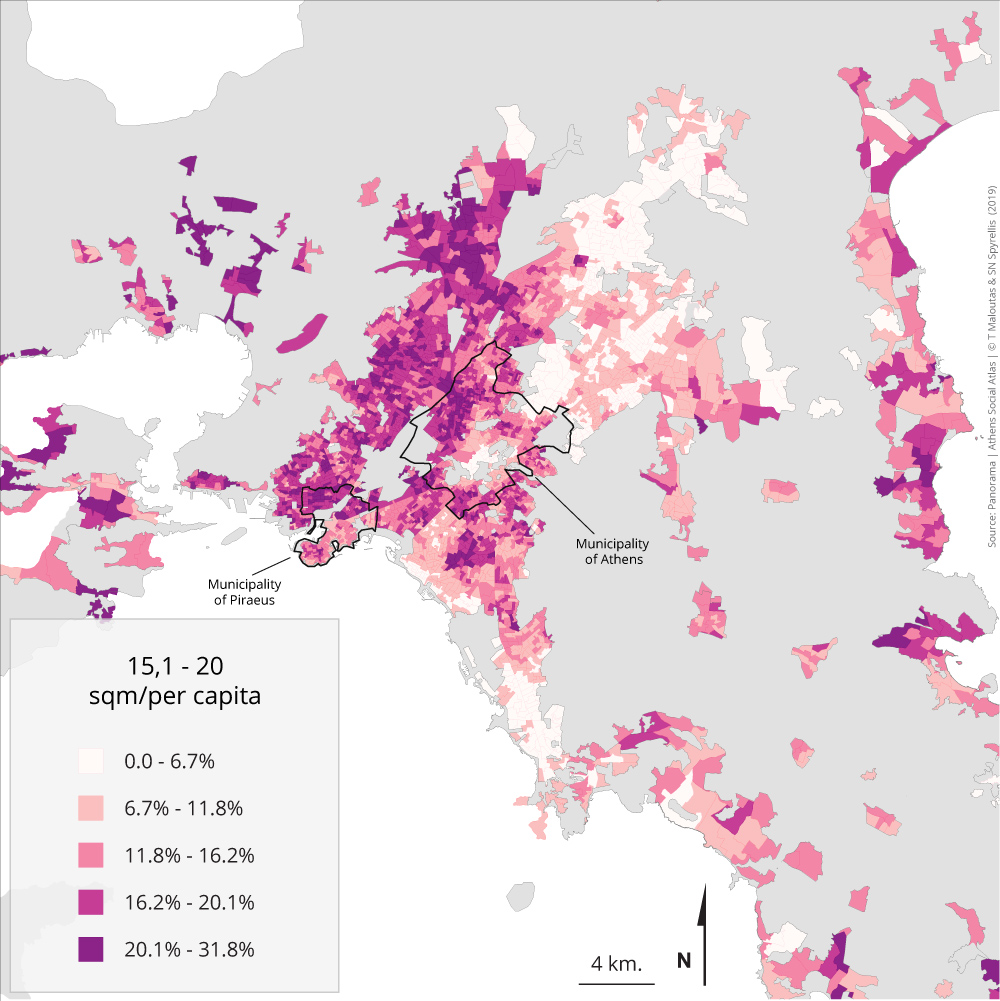
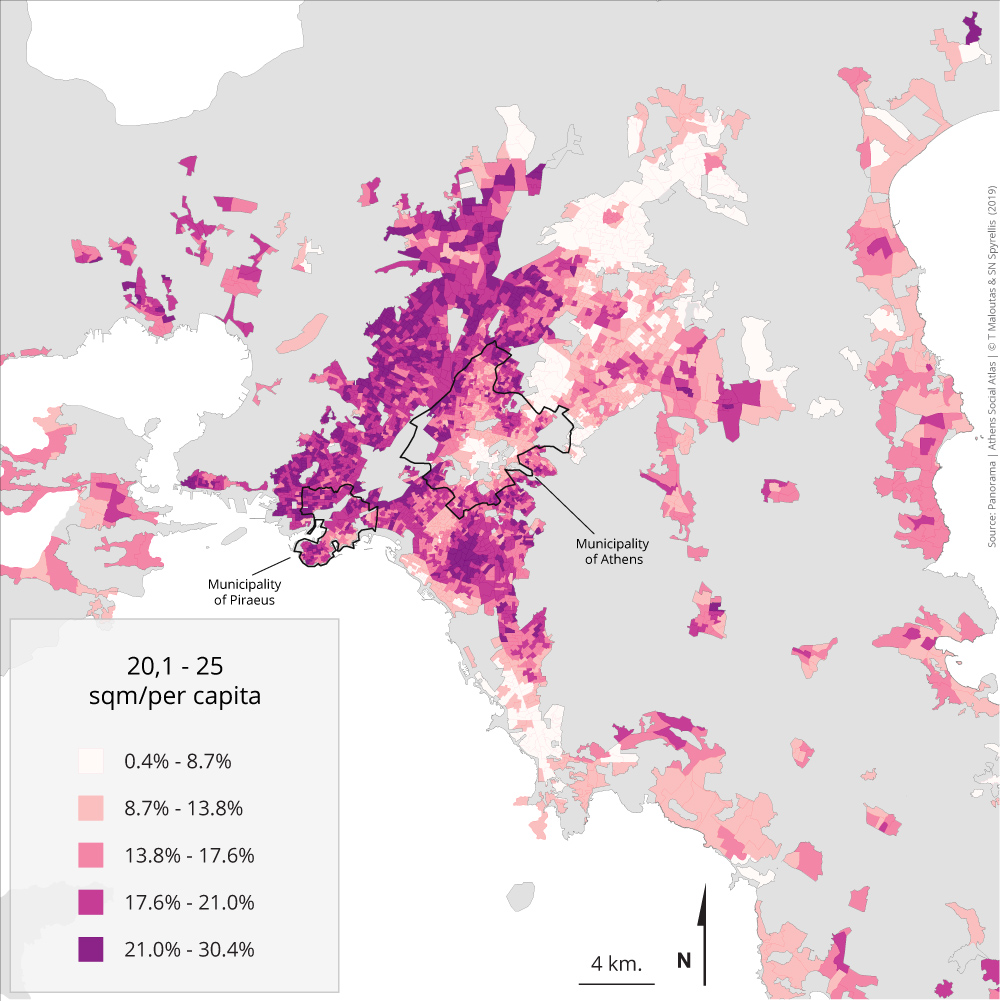
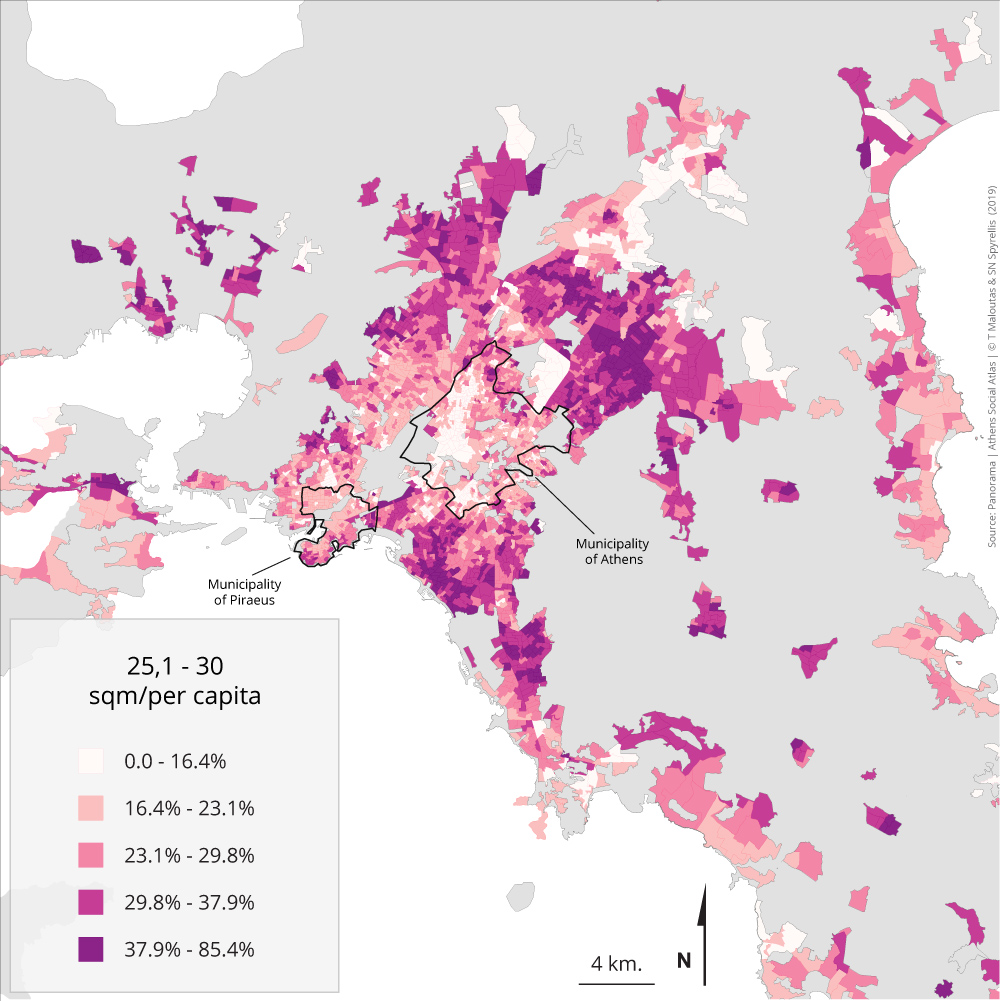
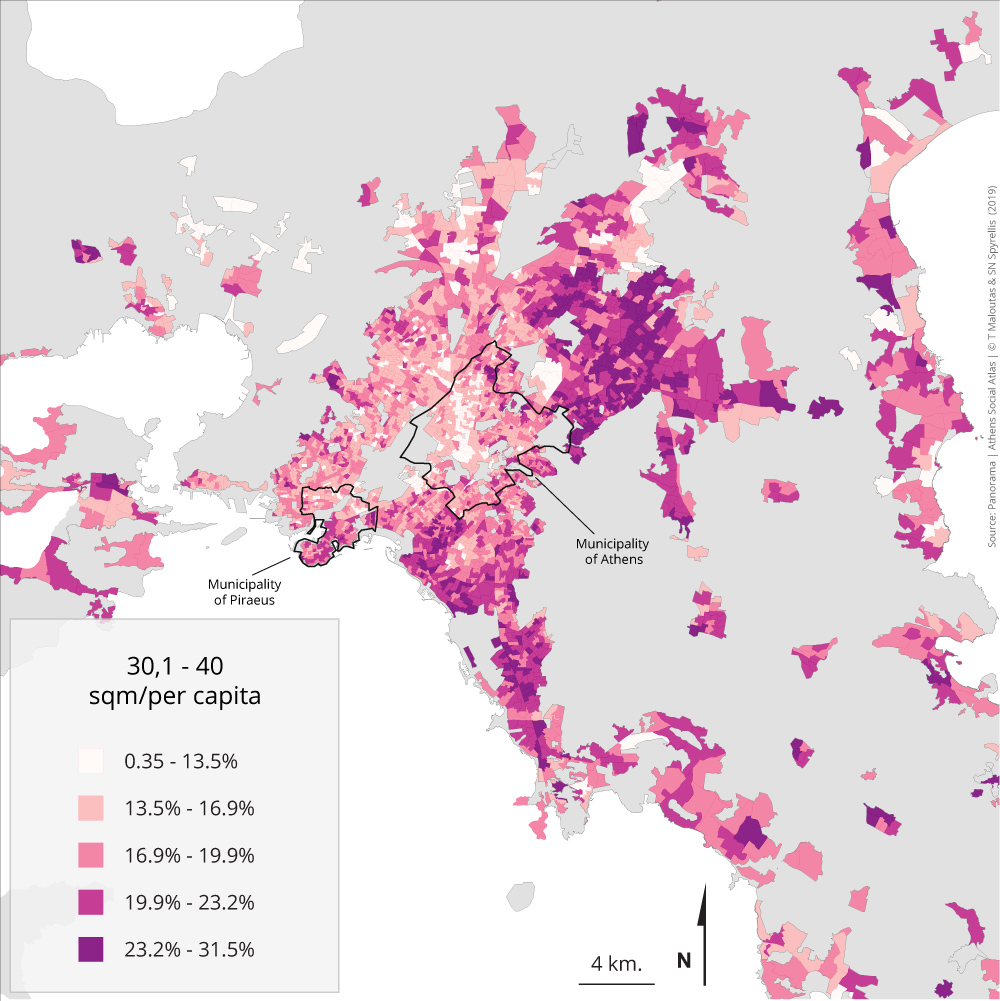
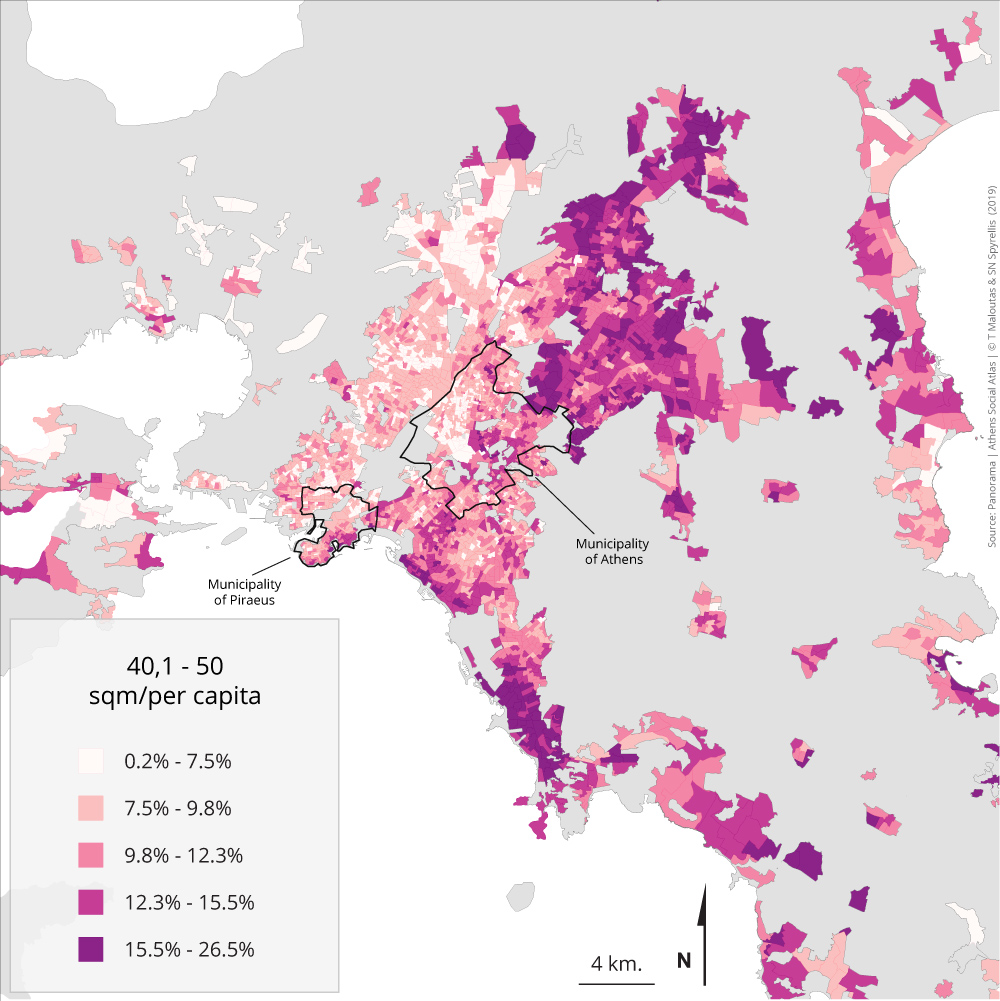
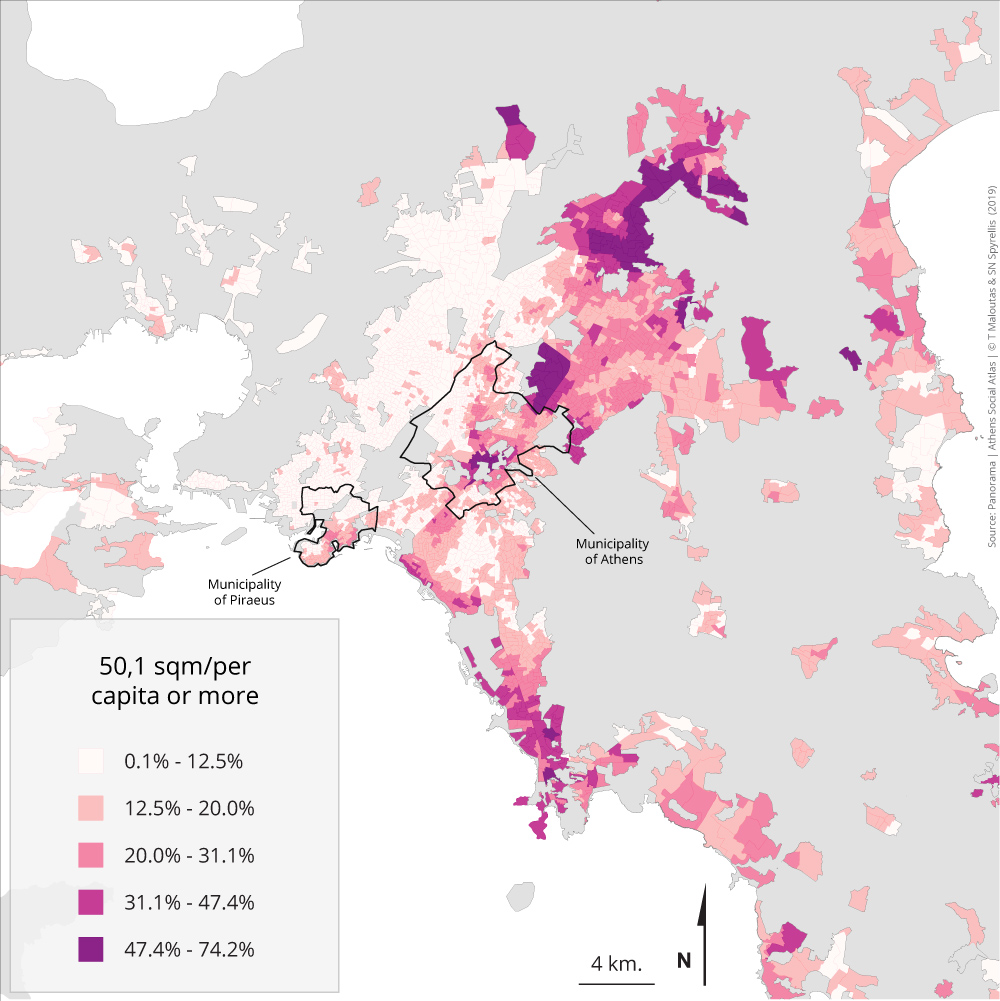
Maps 4.4.1 – 4.4.8: Population distribution by housing surface per household member and residential area (2011)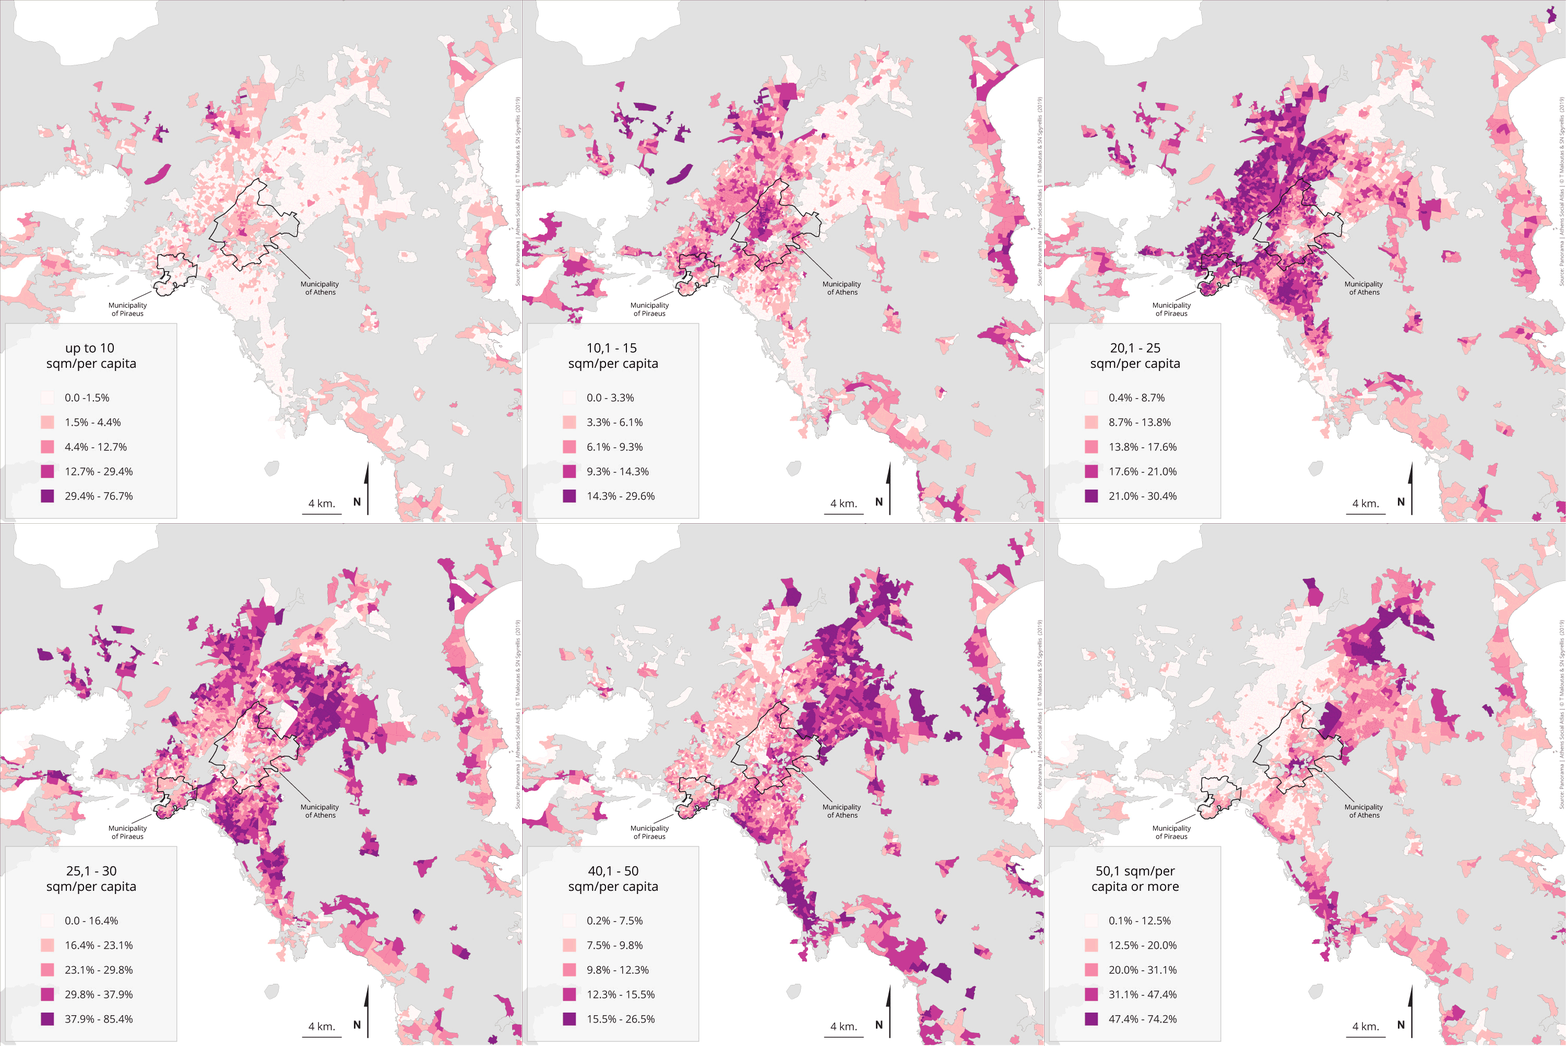
The available housing surface per household member is the most reliable indicator for the abundance/lack of everyday living space. Moreover, since censuses do not comprise data on income and wealth, this indicator can be used as a proxy for economic capital.
Maps in this section depict situations ranging from serious lack of space (<10m2 per person) to abundance (>50m2 per person). The gradual transition from residential areas where groups with serious lack of housing space are concentrated, to areas where those living in abundant housing space are overrepresented reveals patterns that are very similar to those related to other hierarchical variables, like the level of education.
The main observation we can make following the eight maps of this section is that as we move from areas with concentrated lack of housing space to areas of concentrated abundance, we are moving from west to east and from the outer periphery to the first suburban zone within the central part of the agglomeration. Up to the limit of 20m2 per person—which corresponds to the limit of “housing space poverty” for the region of Attiki since it corresponds to 60% of the median of this variable—the large concentrations of the corresponding population are observed exclusively in the western part of the city and in parts of the outer periphery. Intermediate situations (20 to 25 and 25 to 30m2 per person) are more evenly distributed, with the former however located more to the west and the latter to the east. The following categories (30 or more m2 per person) are increasingly concentrated to the east. Finally, the two polar categories comprising the most extreme conditions in terms of this variable, depict neighbourhoods of concentrated poverty and wealth respectively: Neighbourhoods of the centre near Omonia square, Zefyri, Ano Liosia and Aspropyrgos for the former and Psychico, Filothei, Kolonaki, Kifisia, Nea Erythrea, Ekali and the coastal zone from Palaio Faliro to Vouliagmeni for the latter.
Table 4.4 shows the population percentage in the region of Attiki in each category of available residential space per household member. Changes between 1991 and 2011 indicate that the available housing space per capita increased considerably during that period. The percentage of those living in less than 20m2 per person were reduced from 32,1% to 22,4%, while the percentage of those living in more than 40 m2 increased from 11,7% to 26,8%.
Table 4.4: Population distribution in Attiki (except islands) by available housing surface per capita (1991-2011)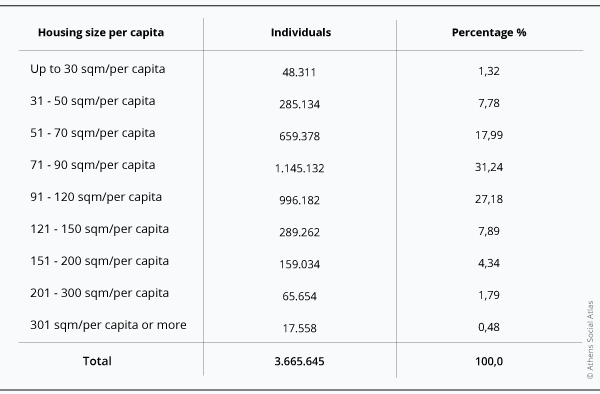
Data source: EKKE-ELSTAT (2015)
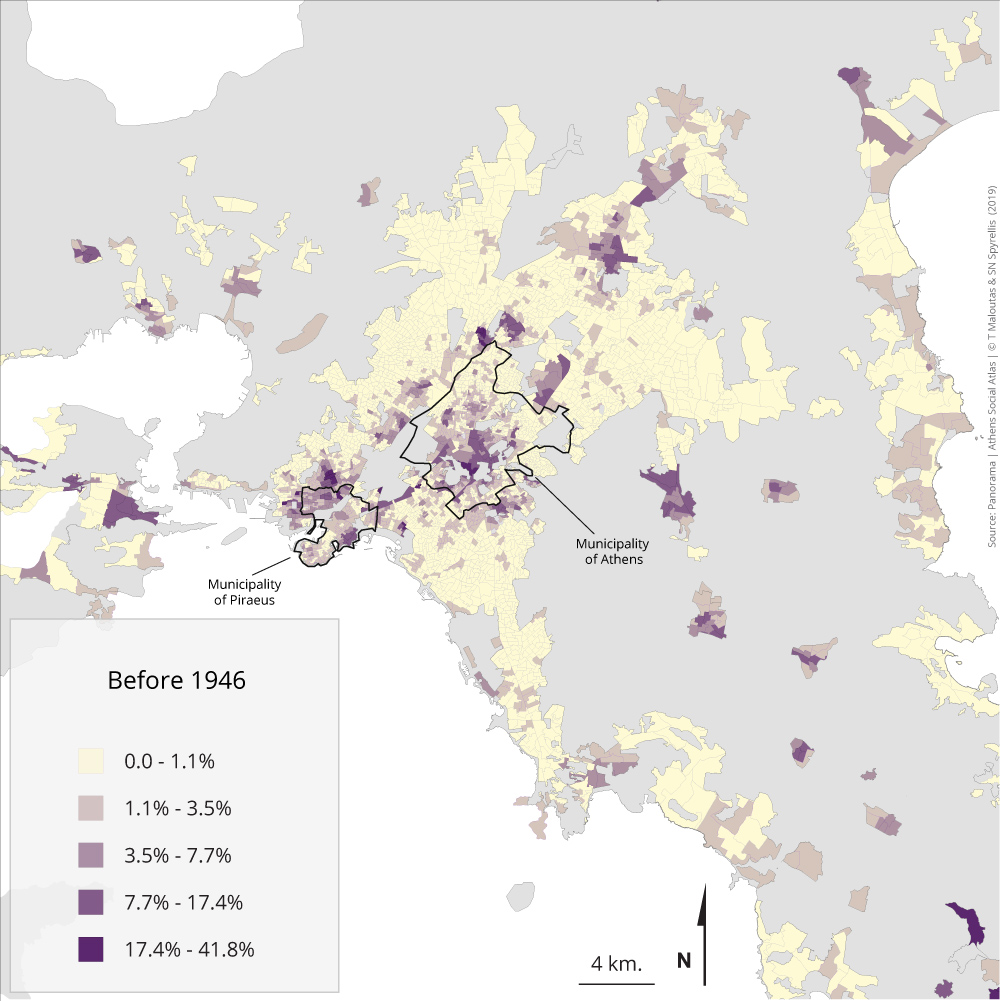
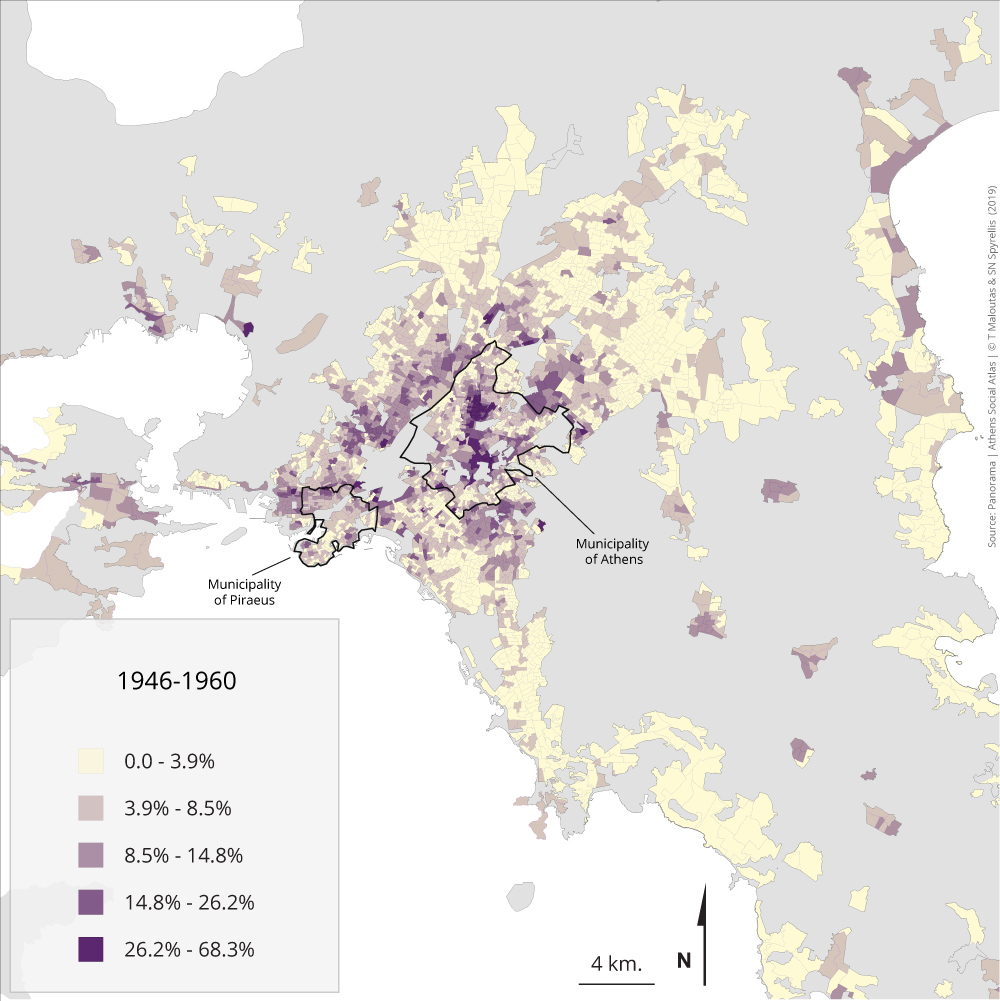
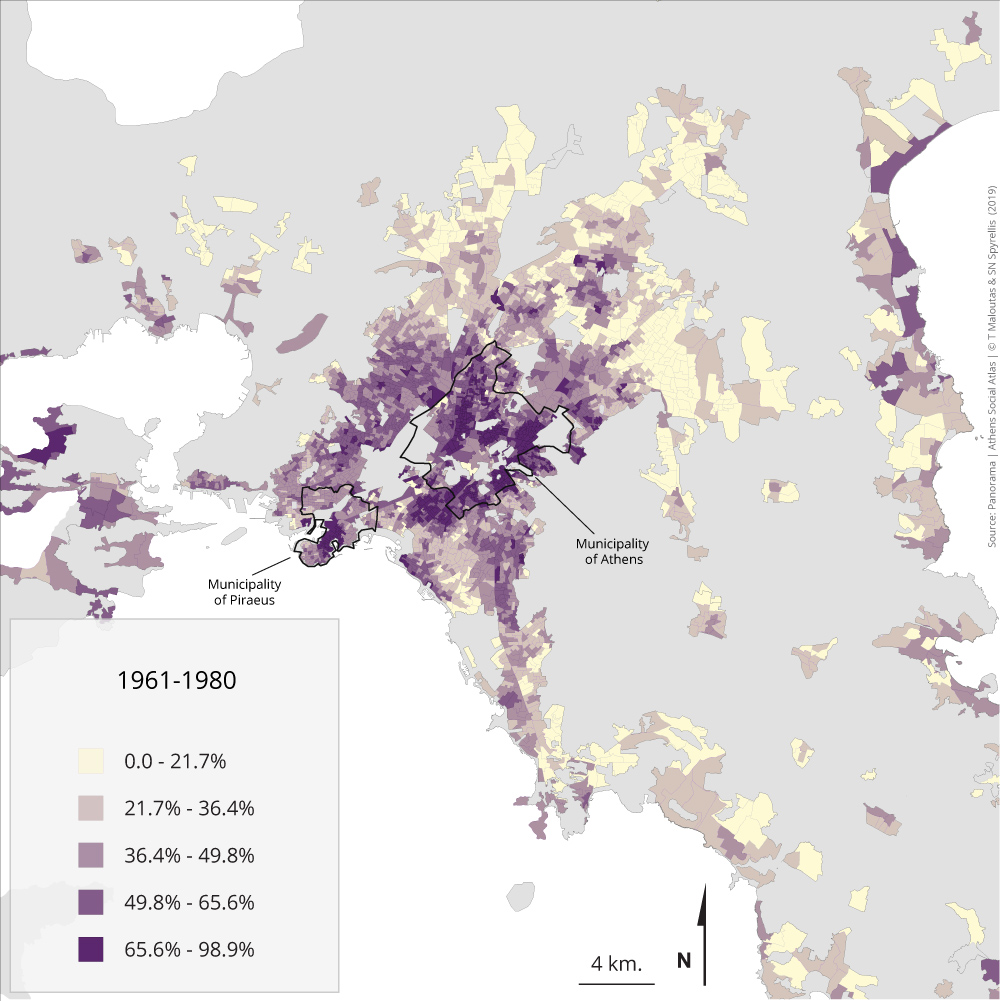
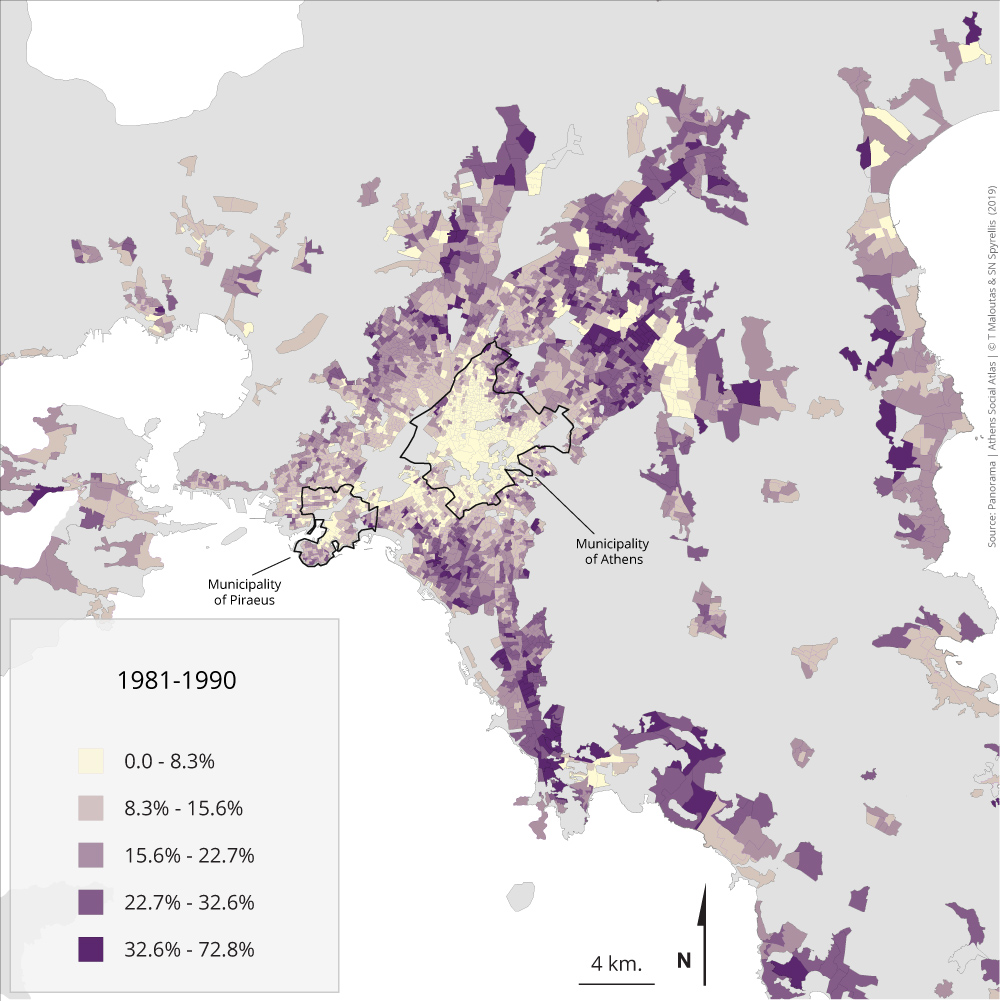
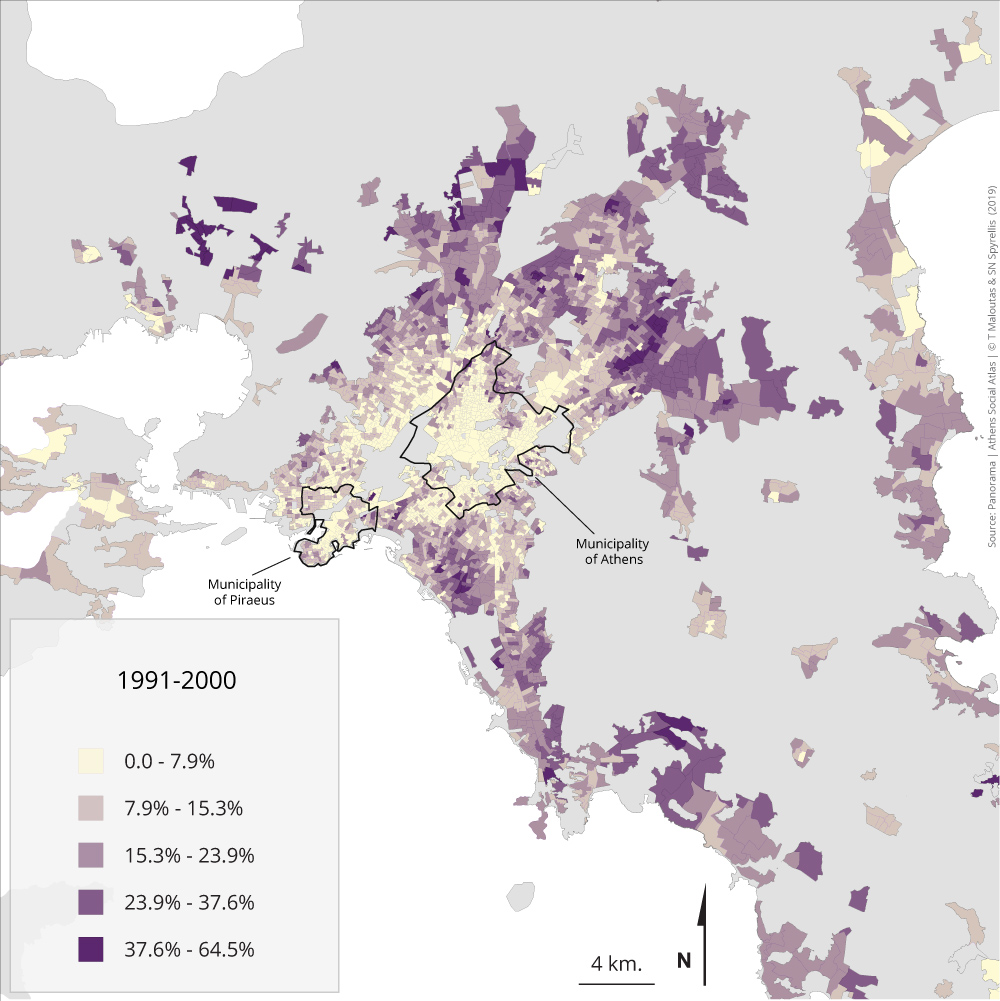
Maps 4.5.1 – 4.5.6: Population distribution by age of housing stock and area of residence (2011)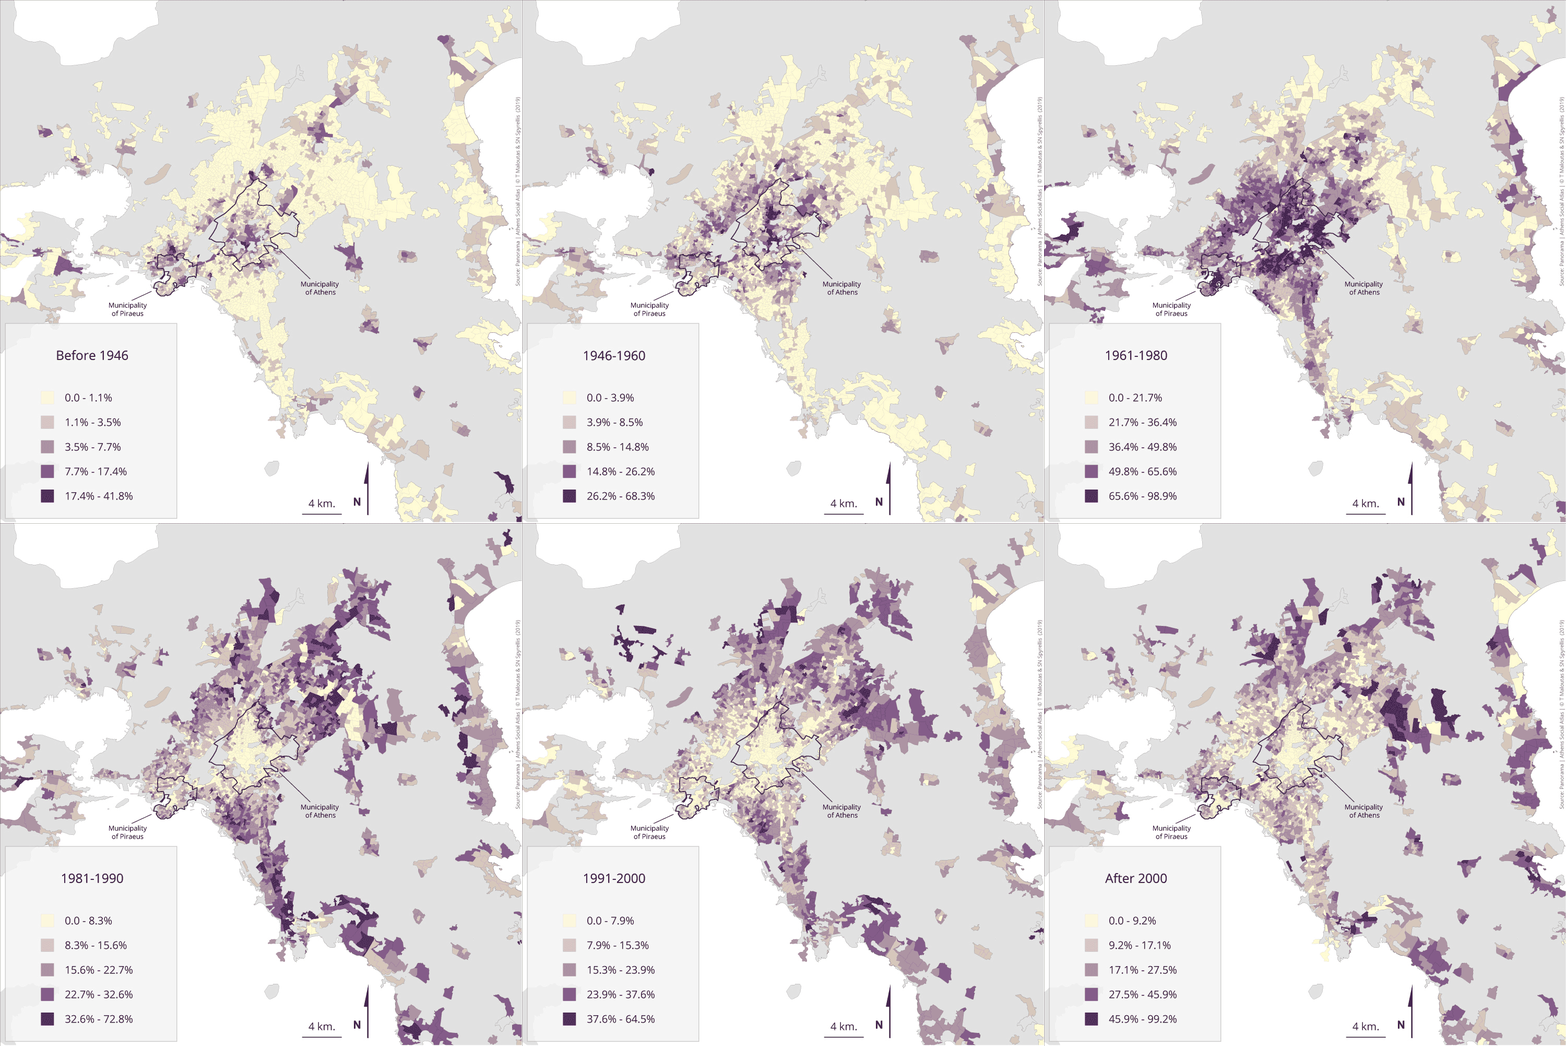
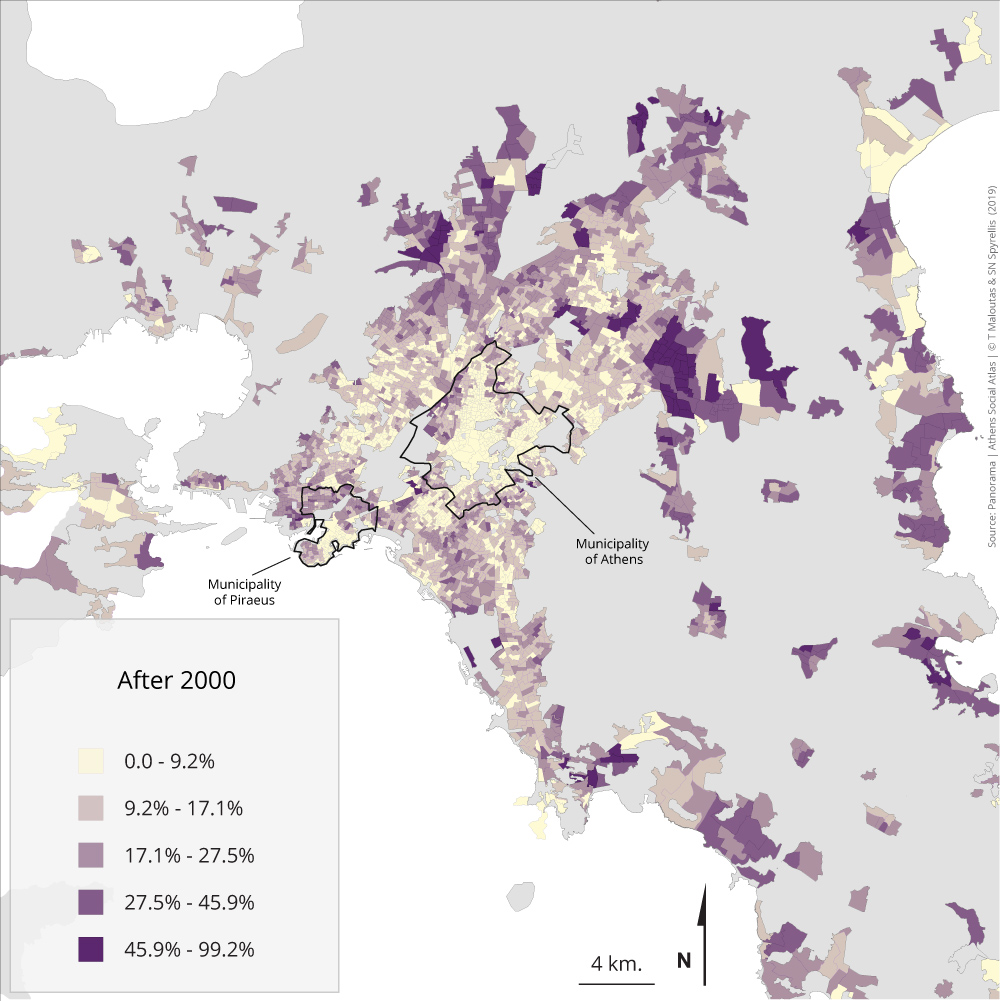
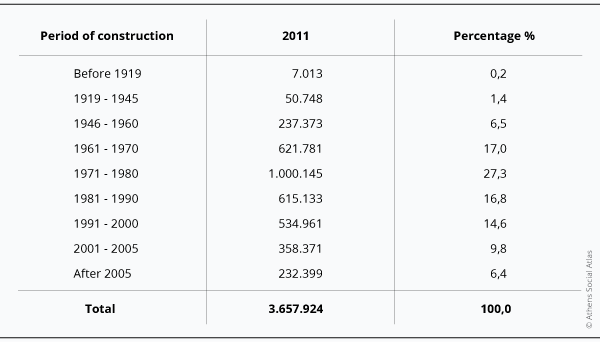
The maps in this section illustrate the periods when the city’s housing stock was build, with an emphasis on the post-war period of the building frenzy. Between 1951 and 1981 the population of Athens more than doubled and this greatly affected the increase of the housing stock. The situation depicted by the following maps is more or less expected. Old housing units, built before 1946, are mainly concentrated in the centres of the municipalities of Athens and Piraeus, as well as in peripheral places, where they were part of distant agglomerations, at the time totally independent from the metropolis. Dwellings built from 1946 to 1960 are comparatively more spread around the two centres, following the expansion of the urban tissue during that period. The same areas concentrate house buildings of the next 20 years (1961-1980) when the city’s space was densified by the rapid construction of apartment blocks through the land-for-flats system. Since the 1980s, there was a serious reduction of building activity and new constructions are mostly located in the suburbs and the outer periphery.
Table 4.5 presents the distribution of the city’s population in the different parts of the housing stock according to its construction period.
Table 4.5: Population distribution in Attiki (except islands) by age of the housing stock and area of residence 2011
Data source: EKKE-ELSTAT (2015)
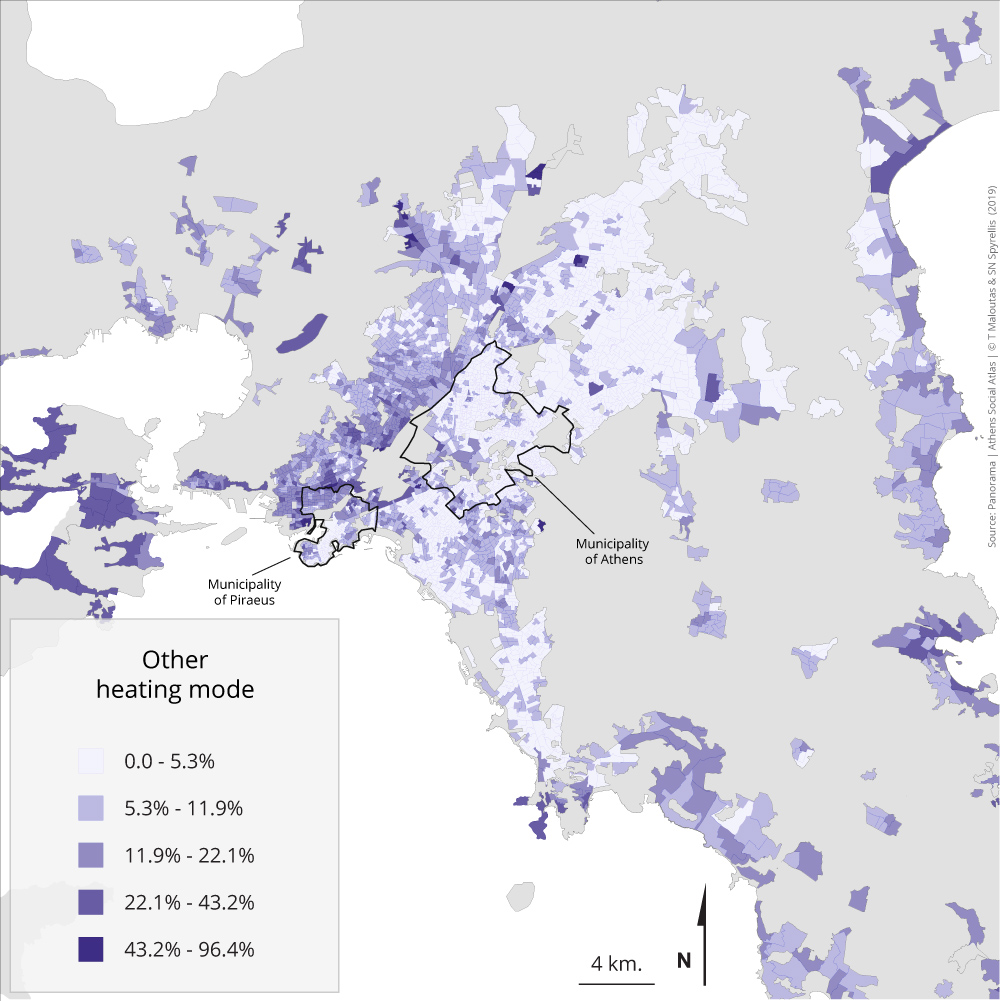
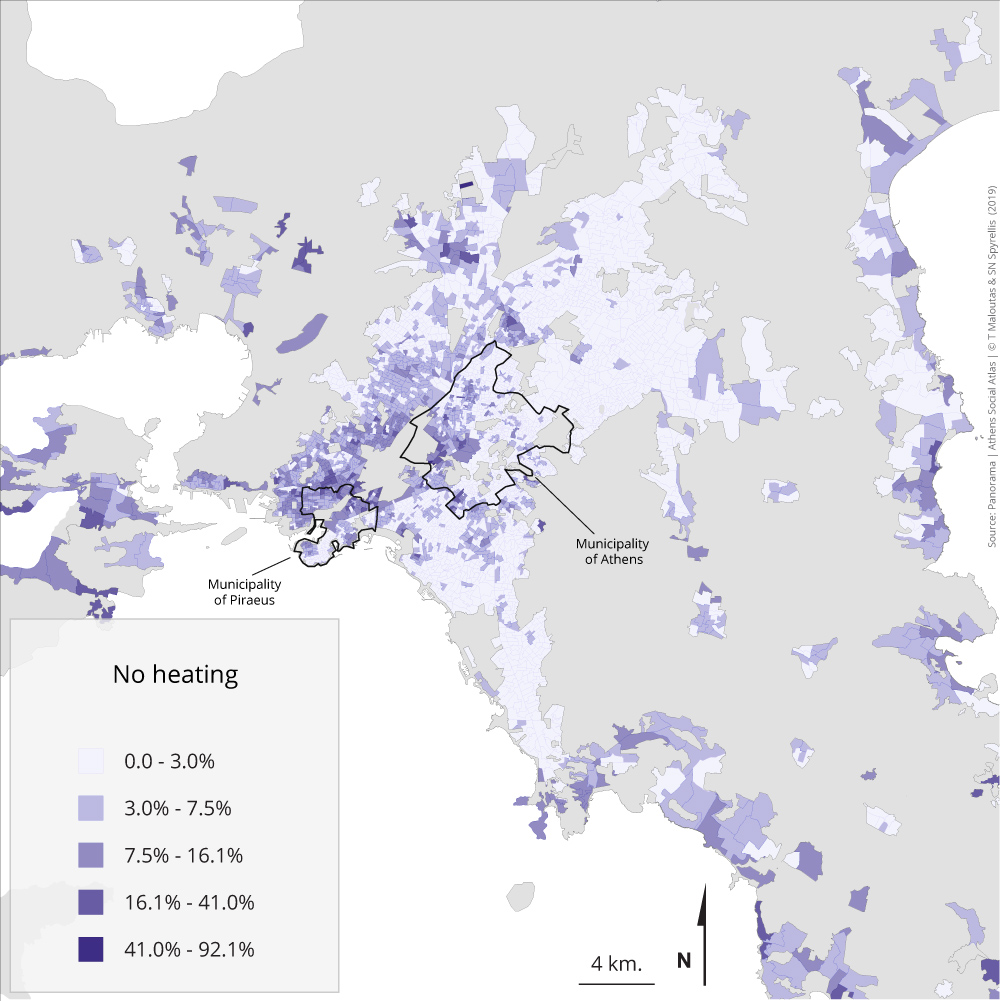
Maps 4.6.1 – 4.6.4: Population distribution by heating system and residential area (2011)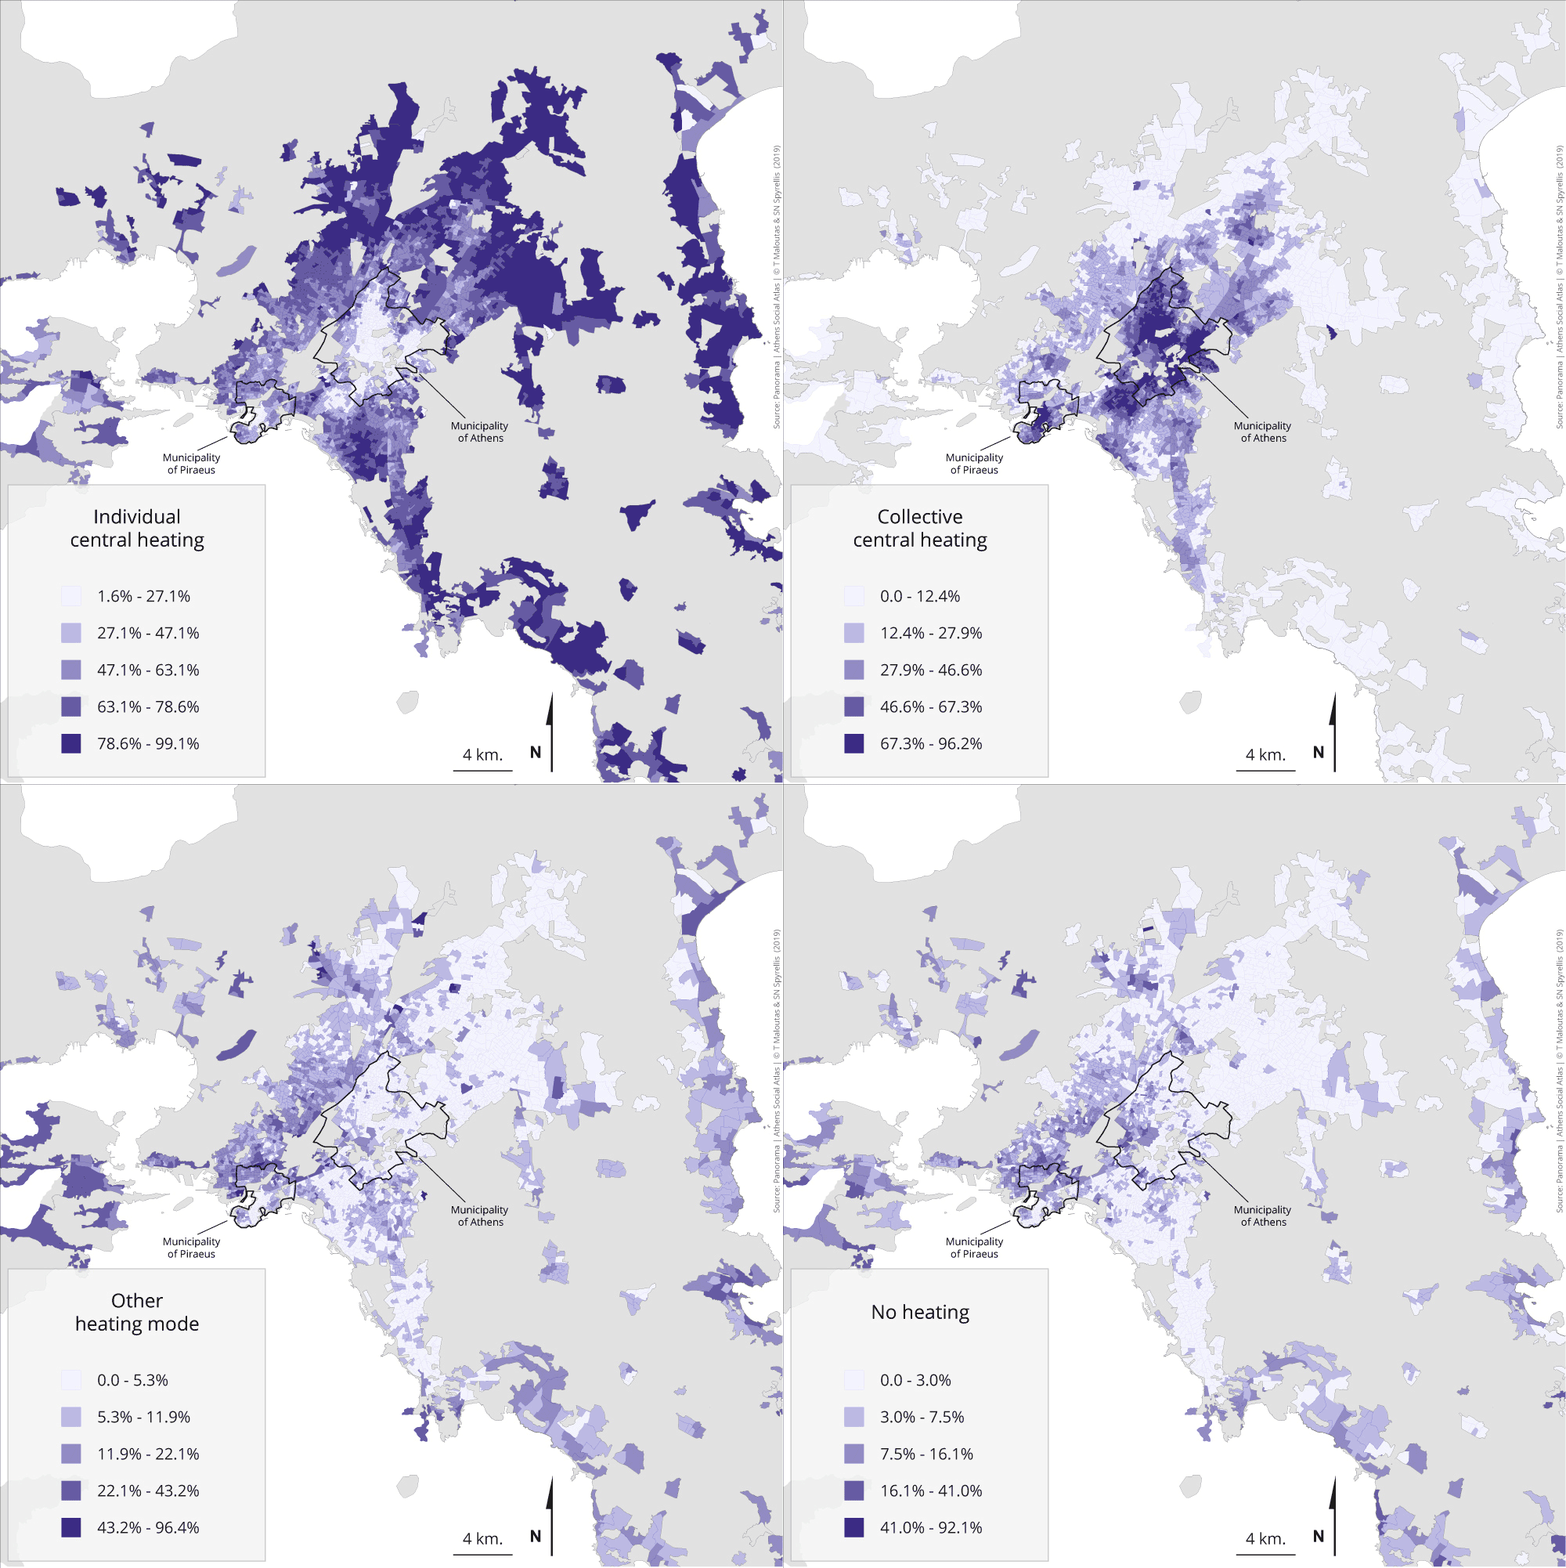
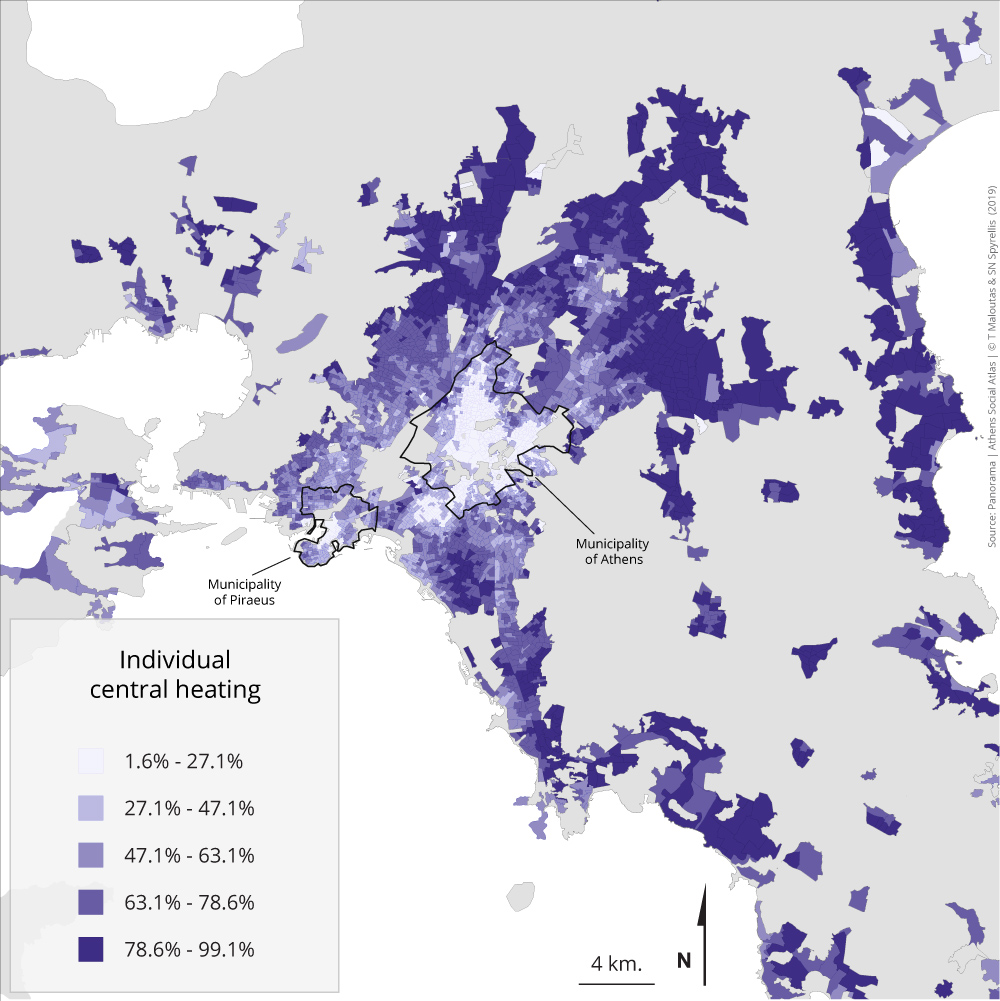
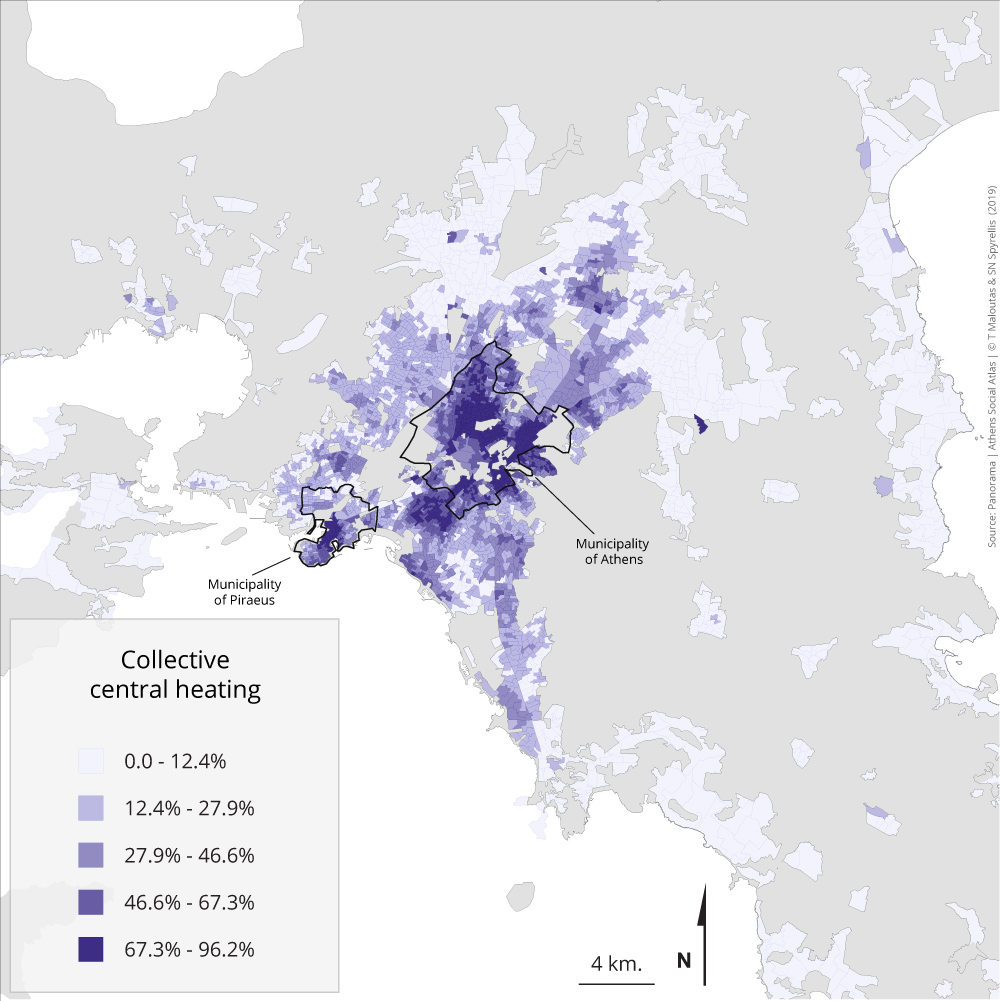
The spatial distribution of heating systems for dwellings in Attiki is clearly related to the age of the housing stock in different parts of the city and to the spatially differentiated possibility of their residents to install particular systems.
Independent central heating is overrepresented in areas of recent construction (mainly suburban) and in distant peripheral areas, where independent housing dominates. The considerable presence of this system in the north-western and western part of the metropolis—i.e. the part where lower status groups are overrepresented—reveals the diversity of housing quality and building types. The older collective central heating system is overrepresented in and around the city centre and in Piraeus, where the building stock consists mainly of apartment blocks built before the early 1980s.
The other ways of heating—usually of inferior quality and less effective—are concentrated in the western part of the city and in the distant periphery. Finally, the complete lack of heating is mainly present in the western part of the Municipality of Athens, in the oldest neighbourhoods of working class suburbs and in poor municipalities like Zefyri, Ano Liosia, Salamina, as well as in some distant parts of the metropolitan region.
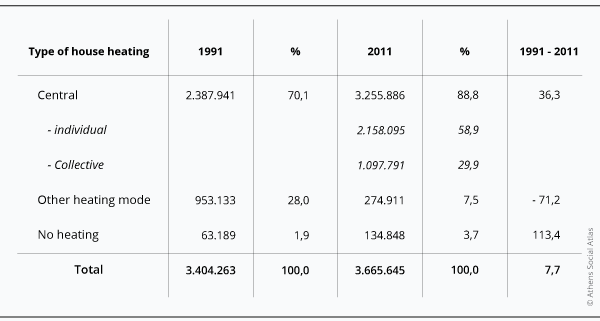
Table 4.6 shows the way the resident population is distributed according to the different heating systems they use. Between 1991 and 2011, central heating has increased considerably at the expense of other heating systems, while there was also a noticeable increase of those who live without heating. The latter is related to the low living standards of most vulnerable groups—mainly immigrants—whose number increased considerably during that period and, partly, to the first impact of the crisis of the 2010s registered in the 2011 census.
Table 4.6: Population distribution in Attiki (except islands) by heating system of their residence 1991-2011
Data source: EKKE-ELSTAT (2015)
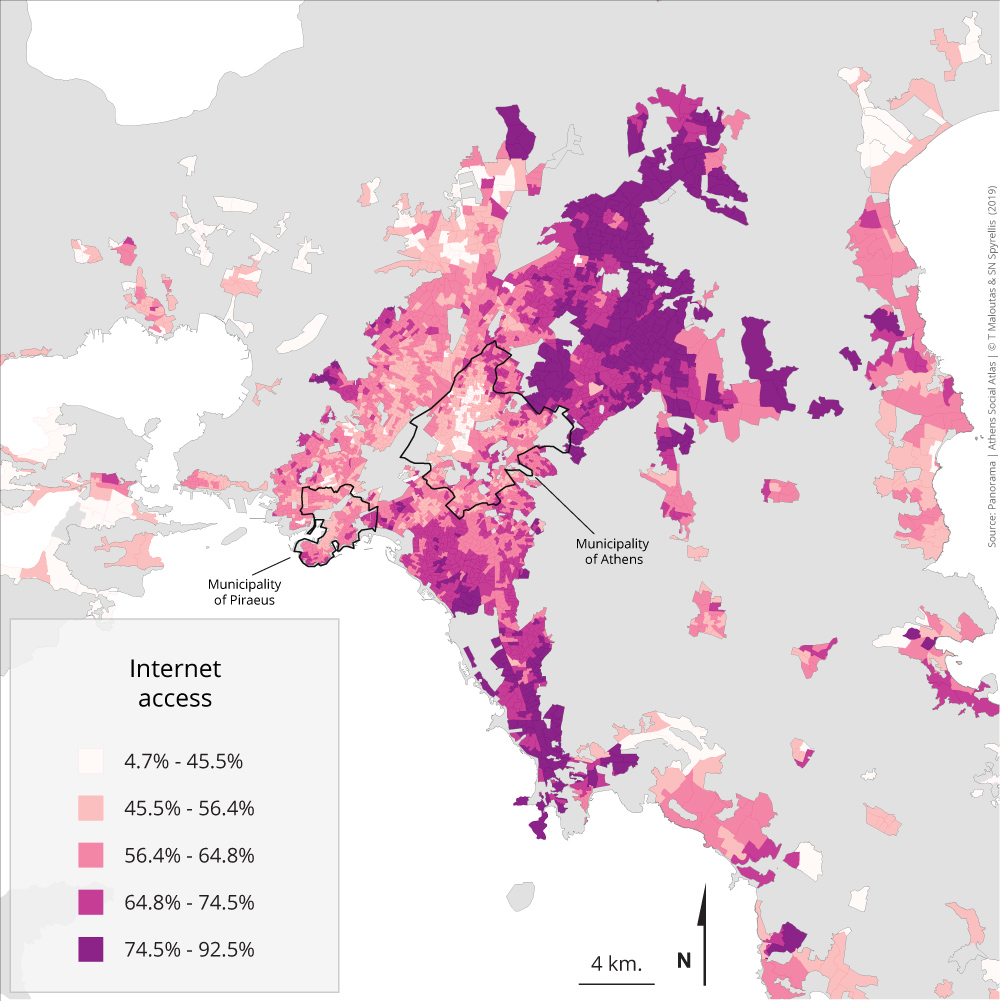
Map 4.7: Population distribution with internet access and area of residence (2011)
Access to the internet has become a necessary tool for everyday life. The spatial distribution of this access followed closely the social hierarchy of the areas of residence. Higher percentages of access were concentrated in the north-eastern and southern suburbs with the highest social profiles, but also in certain neighbourhoods of the western suburbs, like Ano Peristeri, Petroupoli and Haidari, with the highest social profile within the working class part of the city.
This map of access to the internet must have changed considerably since 2011 due to the proliferation of new technologies for online access and the increasing share of mobile internet. However, the socio-spatially unequal access to the internet probably still remains, at a decreased scale.
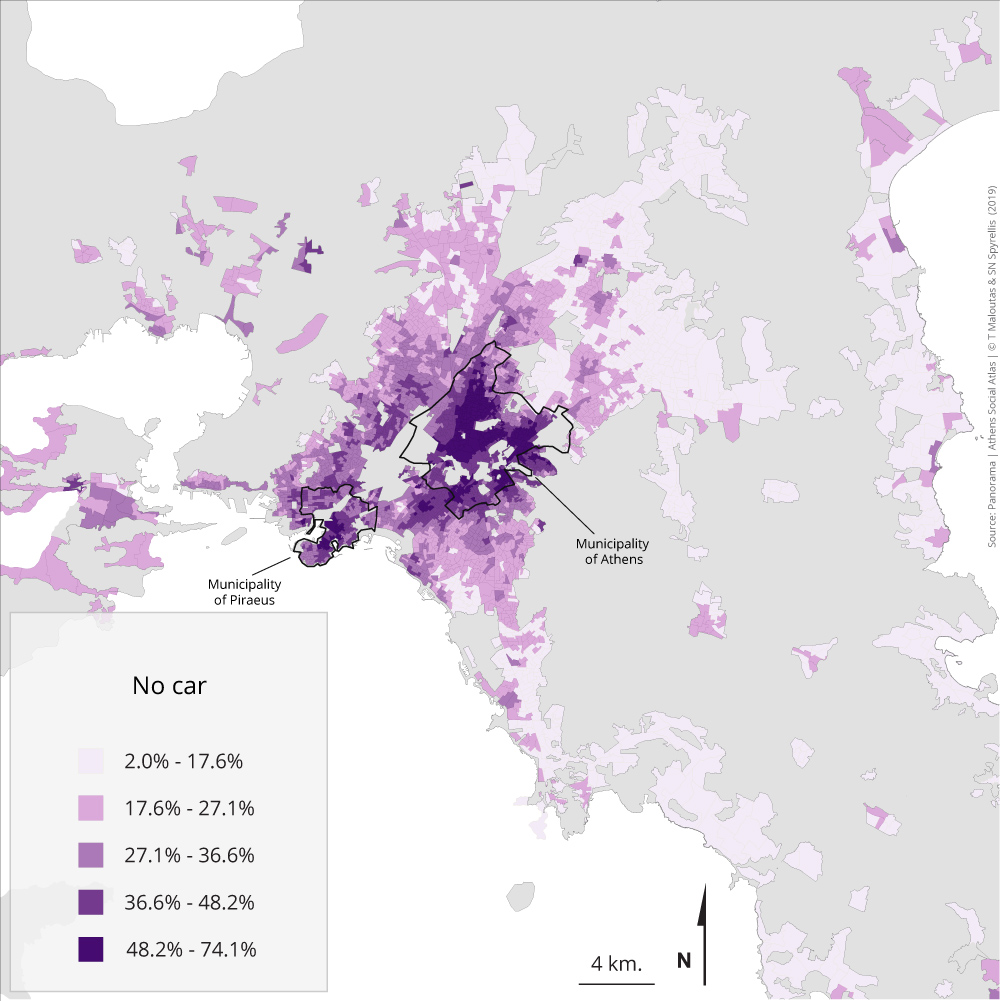
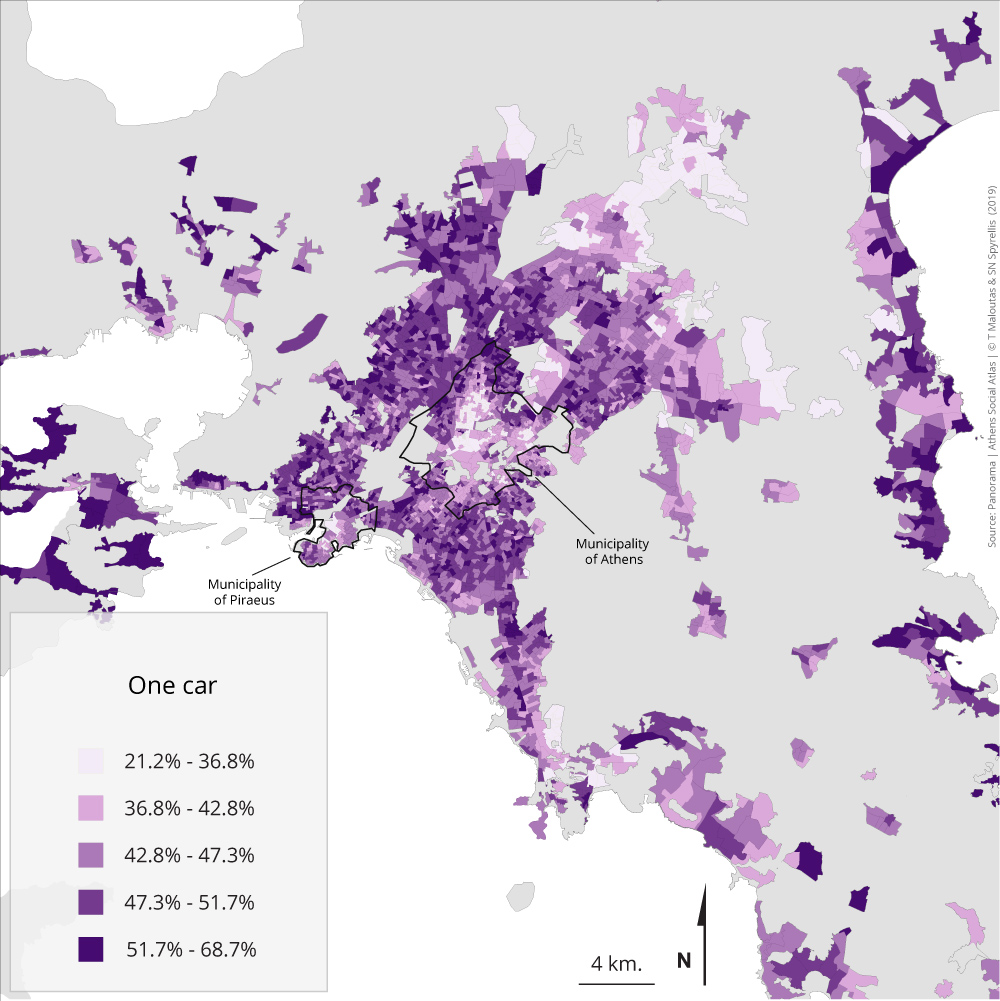
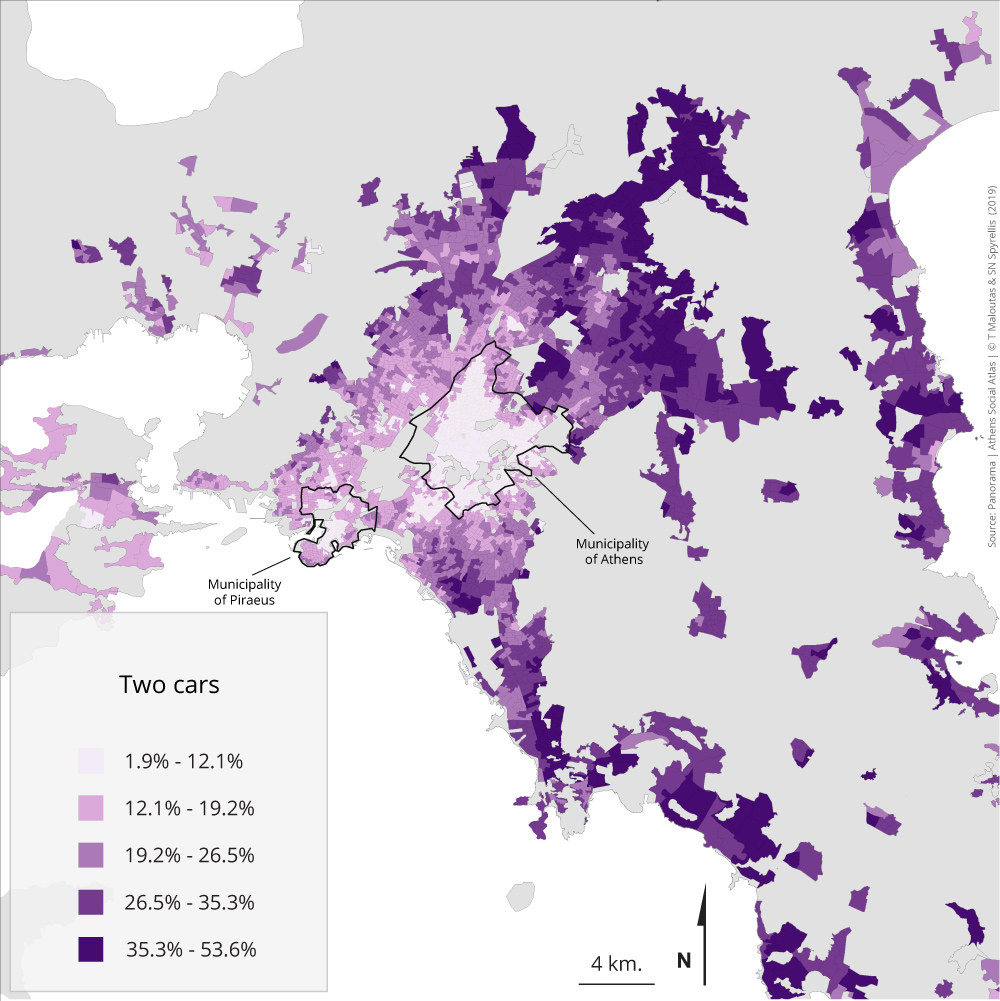
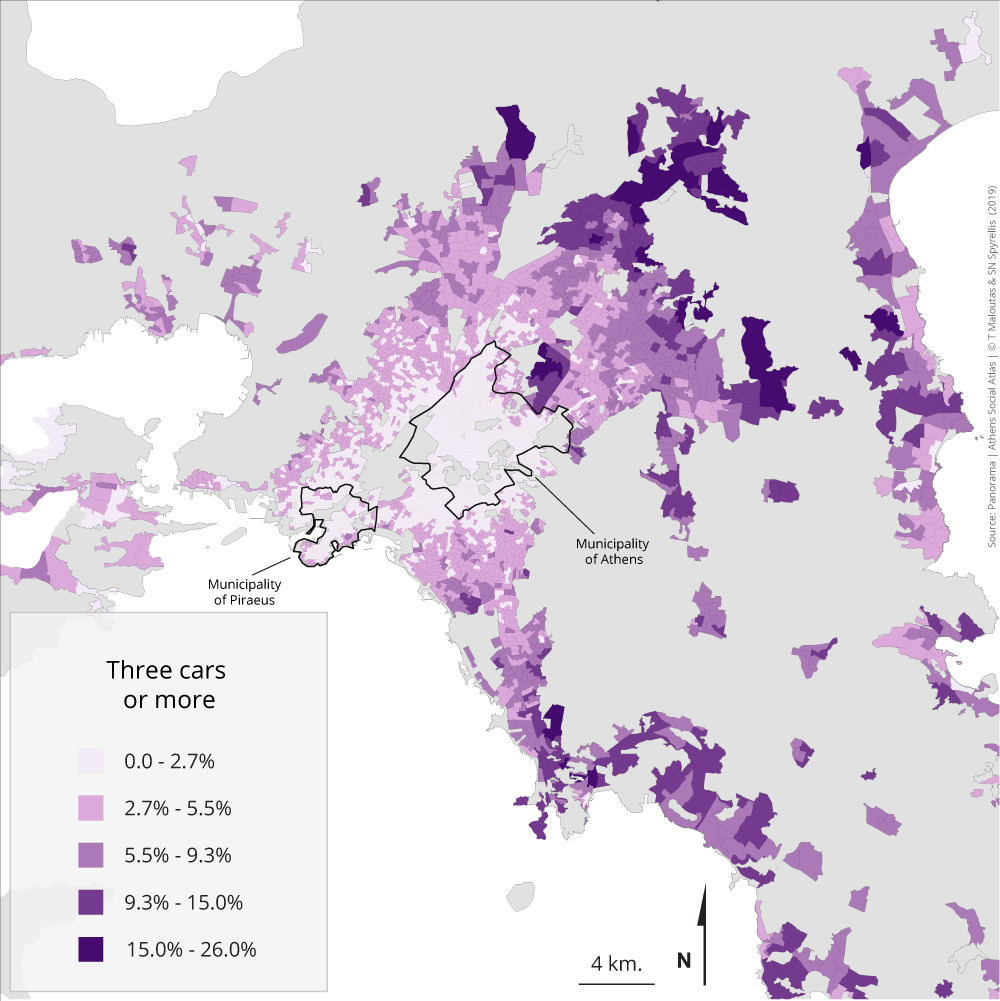
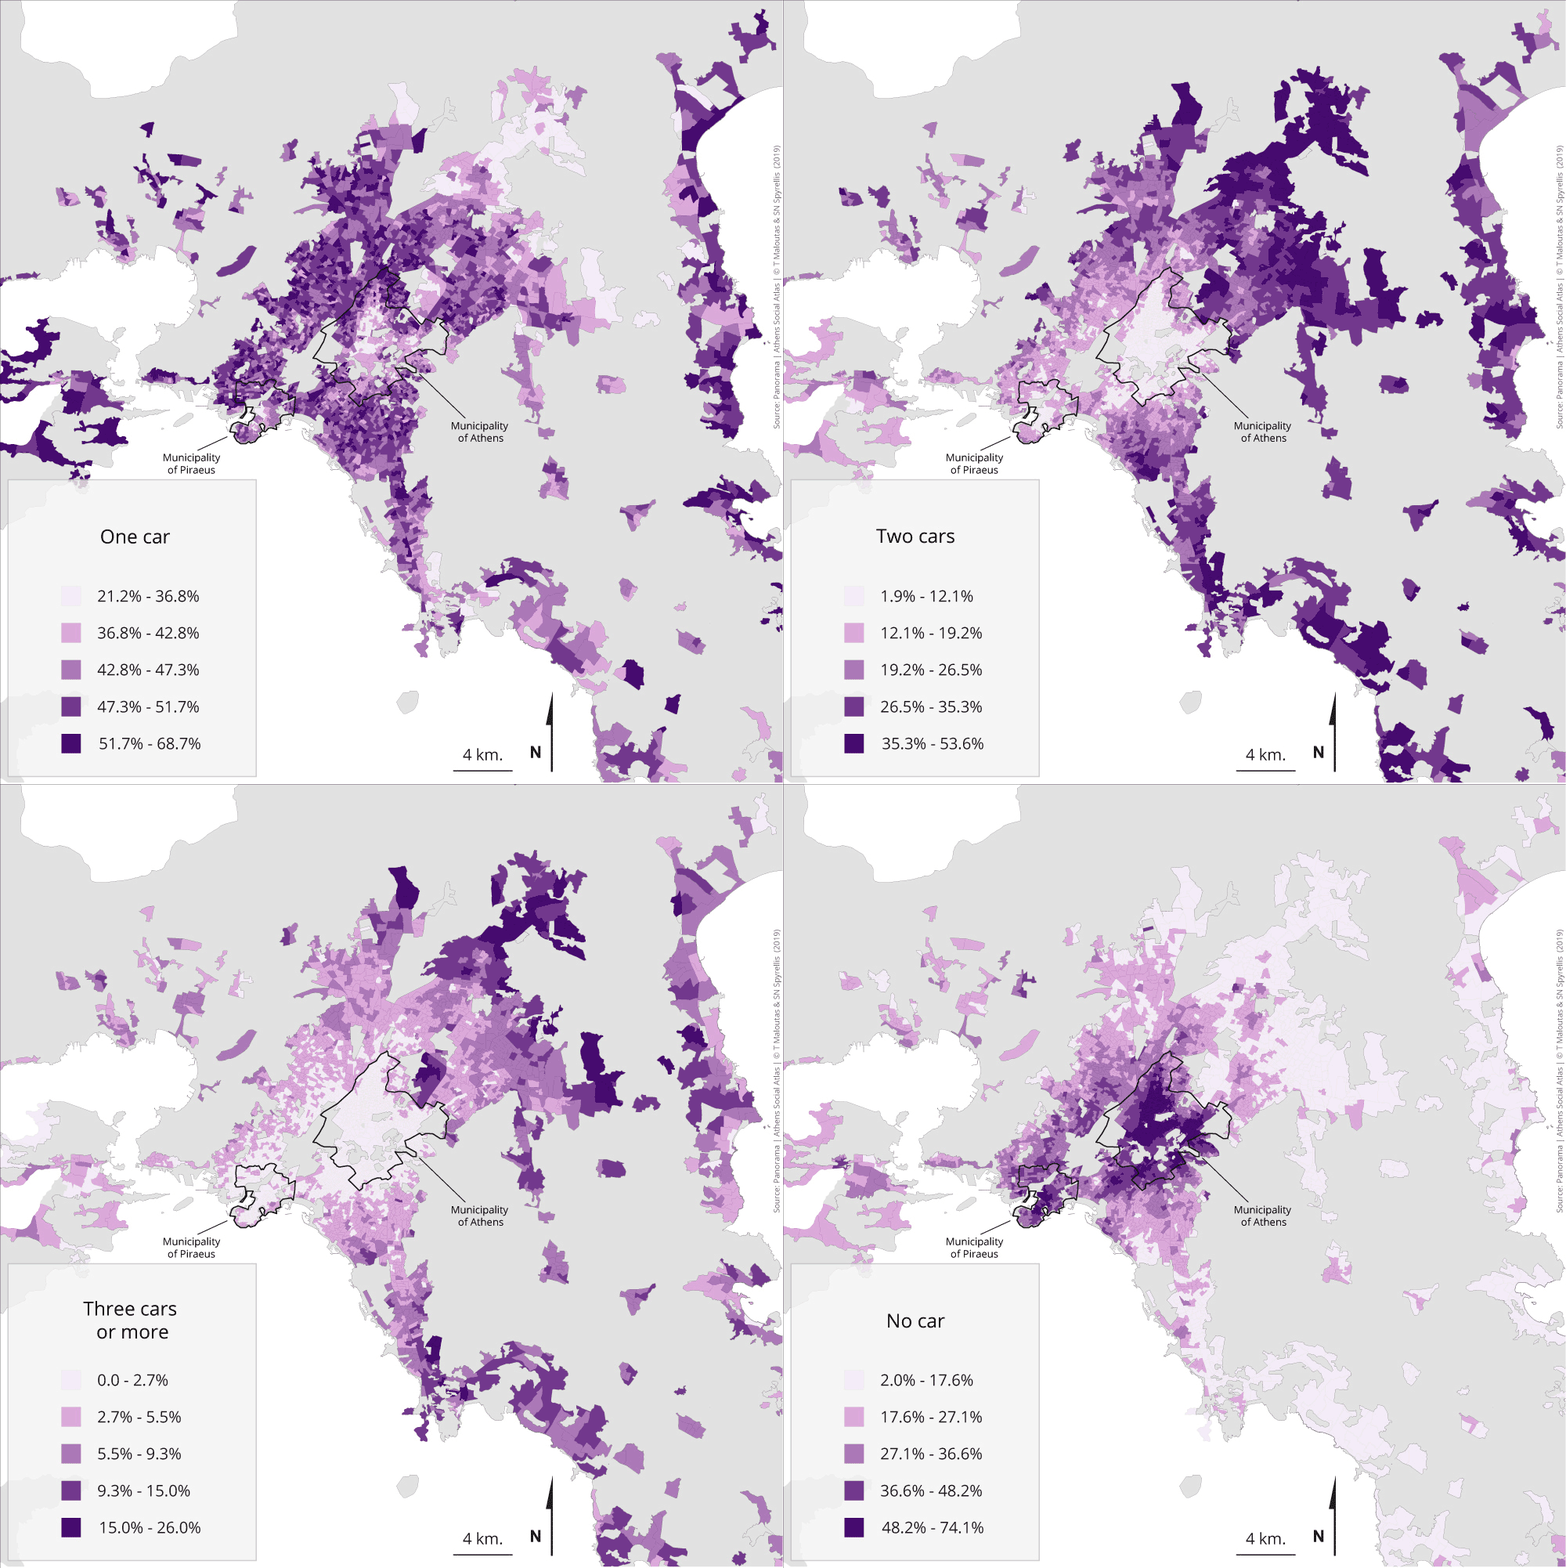
Maps 4.8.1 – 4.8.4: Population of households by ownership of private cars and area of residence (2011)
The ownership of private cars is closely related to the distance of households’ residential location from the city centre. Households without a car are overrepresented in and around the city centre. On the contrary, households with a car are usually located outside the broader centre and the higher the number of cars per household, the longer the distance of their residential location from the centre.
Table 4.8 shows the population in each category of households in terms of the number of cars they owned in 2011.
Table 4.8: Population distribution in Attiki (except islands) by the number of private cars per household (2011) 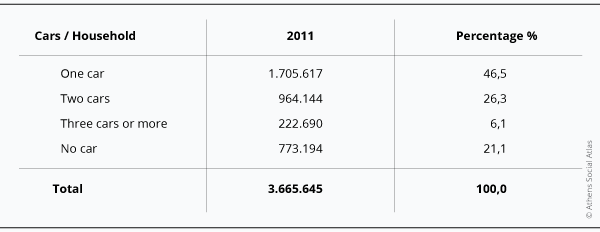
Data source: EKKE-ELSTAT (2015)
The aim in this section is to group residential areas in Athens in a way that reveals similarities and differences in the profiles of their population. This grouping is synthetically illustrated by the map of socio-professional typology of the metropolis at the end of this section.
The method used to depict this typology for 2011 is quite common and well documented. It belongs to the tradition of factorial ecology (Knox and Pinch 2006: 78-83) and different versions have been used through the years to study segregation in many cities (Robson 1969, Timms 1971, Préteceille 2015, Tabard & Aldeghi 1990, Μαλούτας, Πανταζής κ.ά. 1999, Maloutas 1997, Spyrellis 2013). It consists of a combination of a factor and a cluster analysis (principal components analysis and k-means clustering in this case), that produced a typology of the city’s residential areas according to the socio-professional characteristics of their residents.
The factor analysis combines the socio-professional variables according to the similarities/dissimilarities of their distribution in the 3.000 URANUs (Urban Analysis Units) of Athens, whose average population is about 1.200. A small number of composite new variables (components) is created as a result of the analysis. These new variables account for a large part of the information contained in the initial dataset, due to the frequently common distribution patterns among the initial variables. The effective content of each component can be deduced from its relation to the initial variables (table 5.1.2).
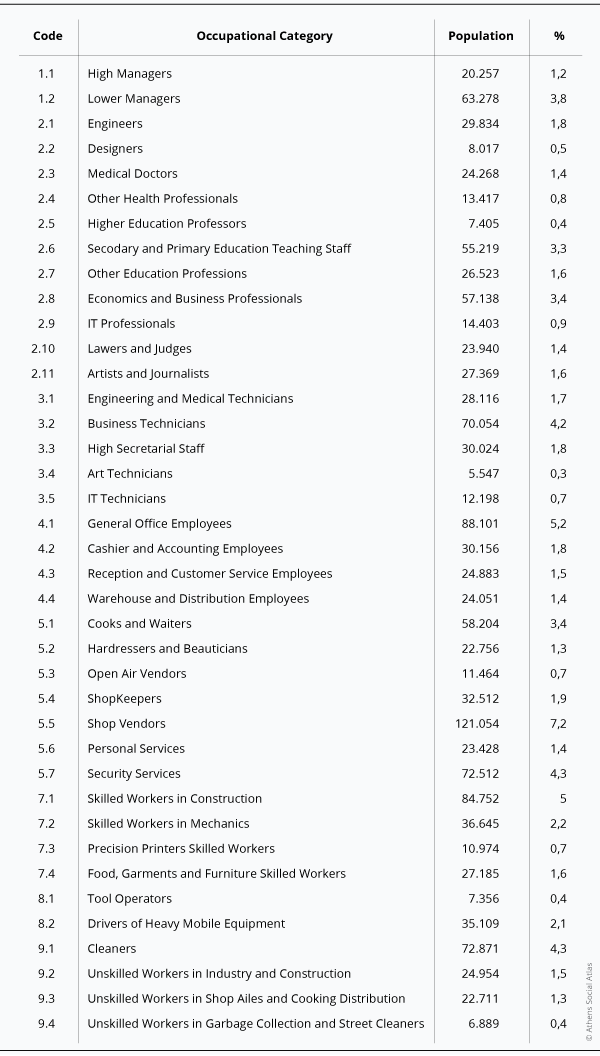
39 occupational categories were used in this analysis, each of which had an important specific weight (1.500 memebrs) covering positions acrossthe occupational hierarchy. The first digit of their code in table 5.1.1 corresponds to the one of the nine broad occupational categories according to the ISCO08 model, followed by ELSTAT in the 2011 census (www.statistics.gr/occupation). The second part of the code identifies the specific category within the broader category indicated by the first digit. Occupations related to the primary sector (agriculture etc.) were excluded from the analysis due to their small number in the metropolis and their very uneven distribution between centre and periphery.
Table 5.1.1: Occupational categories used for the analysis of residential segregation in metropolitan Athens (2011)
Data source: EKKE-ELSTAT (2015)
The analysis provided three components which “explain” (in statistical terms) 45% of the information (variance) contained in the initial dataset. This makes them quite important, especially when we take into account the large number of the initial variables. It means that 45% of the variance among the residential location patterns of these 39 occupational categories can be summarised by these first three components produced by the PCA (Principal Components Analysis). The (social) content of each component can be deduced by their relation (correlation in statistical terms) with the initial variables (table 5.1.2).
Table 5.1.2: Correlation coefficients of the 39 occupational variables and the three principal components produced by the PCA used to explore residential segregation in metropolitan Athens (2011)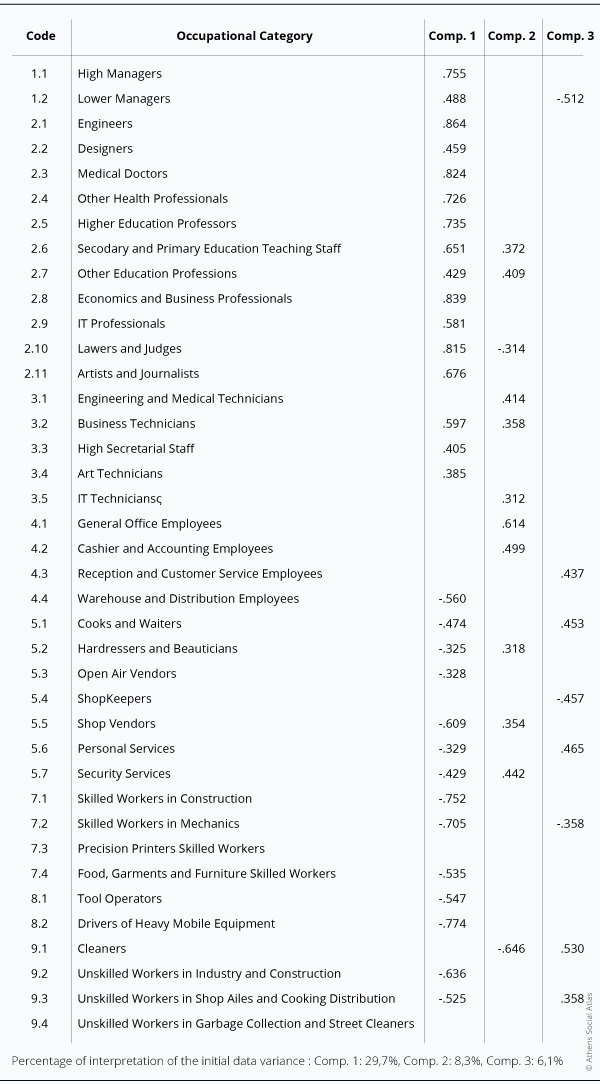
Data source: EKKE-ELSTAT (2015)
Table 5.1.2 shows that the first and most important component (1) –since it “explains” about 30% of the total variance– is about the systematically different residential location of the upper and upper-middle categories from that of the lower and lower-middle ones. Component 1 has a high positive correlation with the former and a high negative correlation with the latter (table 5.1.2). This means that these two groups of categories tend to locate in residential space in opposite ways.
Component 2 reflects the opposition between a broad part of intermediate categories with the category of cleaners, but also with that of lawyers and judges. In spatial terms this reflects the relative absence of these broad intermediate categories from parts of the city centre, where lower and higher status groups are simultaneously overrepresented. This is also true for suburban areas of higher social status, where cleaners have a significant presence as live-in domestic personnel.
Finally, component 3 refers to the dissimilar spatial location of certain lower and intermediate occupational categories related to the status of small business owner or the position in the management hierarchy (shop-owners and intermediate managers), compared to simple salaried positions (client service employees, cooks and waiters, cleaners).
These three components were used for the clustering of the 3.000 URANUs of the Greek capital in seven discrete types of residential areas. Every URANU included in the PCA is attributed factor scores, which relates it to each of the three principal components according to the URANU’s occupational profile. The factor scores of the 3.000 URANUs for each of the three principal components were used in a k-means cluster analysis in order to identify the seven most homogeneous clusters of URANUs.
The cluster analysis provided the following typology of the Athens metropolitan area (table 5.1.3):
Table 5.1.3: Social types of residential areas in metropolitan Athens (2011)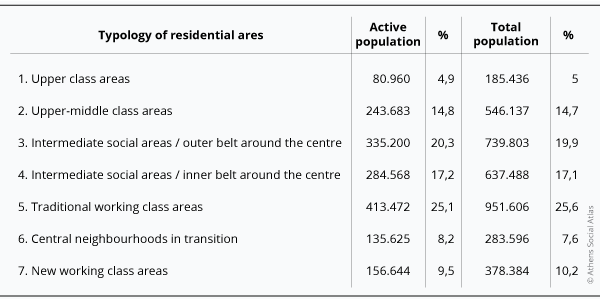
Data source: EKKE-ELSTAT (2015)
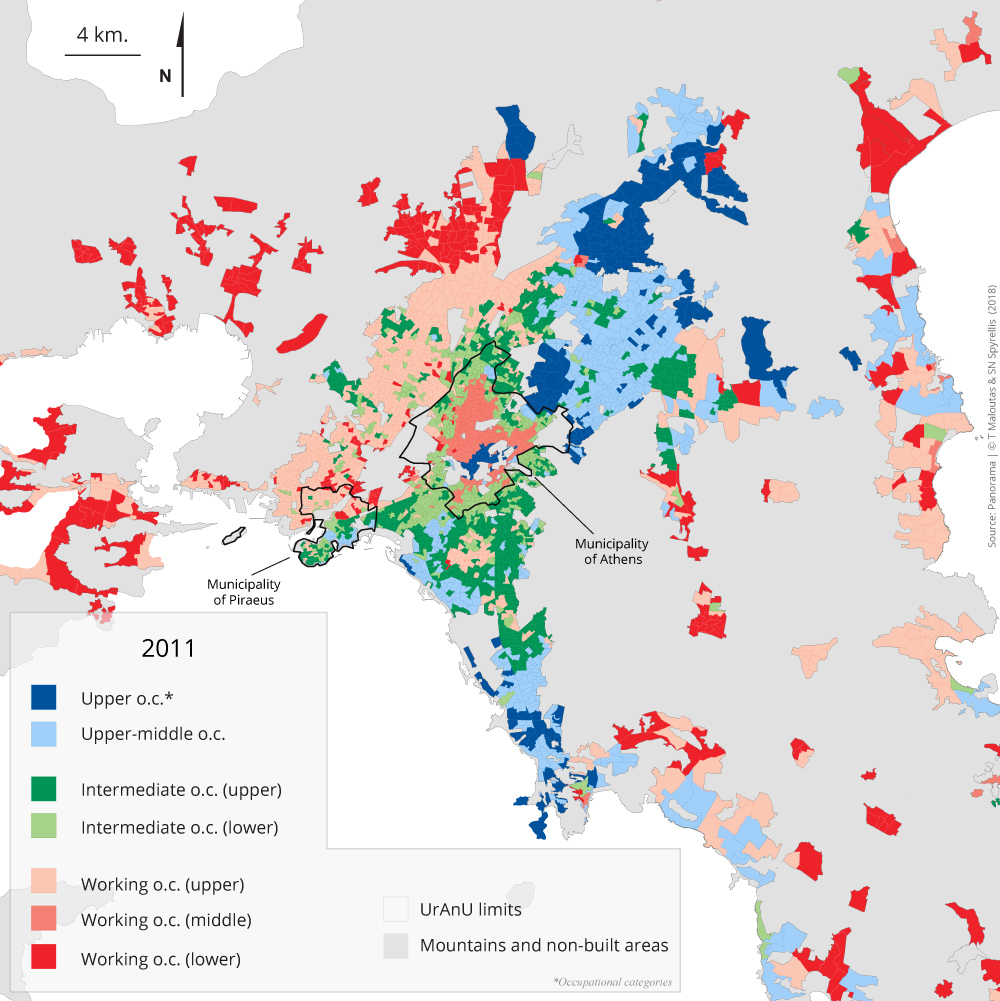
Map 1 depicts the social typology of the city’s residential areas following the aforementioned analysis. Neighbourhoods where upper social categories are overrepresented are painted in blue. They comprise most parts of the municipalities of Psychico, Filothei, Papagou and–further North– of Kifisia, Nea Erythrea, Ekali, Dionysos, Penteli and Thrakomakedones. In the South they comprise the coastal areas part of Palaio Faliro and –further South– of Glyfada, Voula and Vouliagmeni. In the city centre they mainly comprise the neighbourhoods of Kolonaki and Plaka.
The much broader areas where upper-intermediate categories are overrepresented are painted in light blue. These areas are usually next, and often around, the previous ones within the central part of the agglomeration, but they also extend to the East coast of the region as well as in Piraeus.
Map 5.1: Social typology of residential areas in Attiki (2011)
The most socially mixed areas, where intermediate occupational categories are overrepresented, are painted in dark and light green. They are mainly located at the periphery of the Municipality of Athens and in neighbouring municipalities, like Vyronas, Kaisariani, Zografou, Galatsi, Kallithea, Moschato and Piraeus. They are also present in the western suburns, in parts of Petroupoli, Ano Peristeri and Haidari. The difference between dark and light green areas –dark green areas have a relatively higher percentage of upper and intermediate categories and light green areas have a higher percentage of working class categories– coincides with a different location: the two types are next to each other, but the areas with the relatively lower social profile are closer to the city centre and mainly located within the Municipality of Athens.
The areas painted in pink are the largest in surface and population and they mainly comprise traditional working class neighbourhoods from Salamina and Perama to Menidi (Acharnes). This type of areas is also present in parts of East Attiki, both on the coast and the mainland.
Some working class groups –mainly unskilled– are overrepresented in parts of the Municipality of Athens, between the nucleus of bourgeois strongholds in the centre and the socially mixed neighbourhoods of the municipality’s periphery. They are painted in brick-red colour and they comprise parts of the ‘historical centre’, Patissia, Kypseli, Gyzi, Ampelokipi and Pangrati.
Finally, the most homogeneous working class neighbourhoods are located at the periphery of the metropolis and are coloured in red. This type of residential area is mostly found in Salamina, Perama, Aspropyrgos, Ano Liosia, Zafyri, Menidi, Tavros, Rentis in the western part of the city, as well as in other areas of the western periphery not included in Map 1, like Mandra, Magoula and Megara. It is also present is some parts of the eastern periphery, mainly in Marathonas and within the broader area of Mesoghia.
Similar maps were published in Maloutas (1997: 3), Μαλούτας (2000: 46) and Sivignon et al. (2003: 131) for 1991 and in the special section on Athens of the daily newspaper Eleftheros Typos, for 2001 (June 17, 2007).
Table 5.1.4: Social composition of residential area types in metropolitan Athens (2011)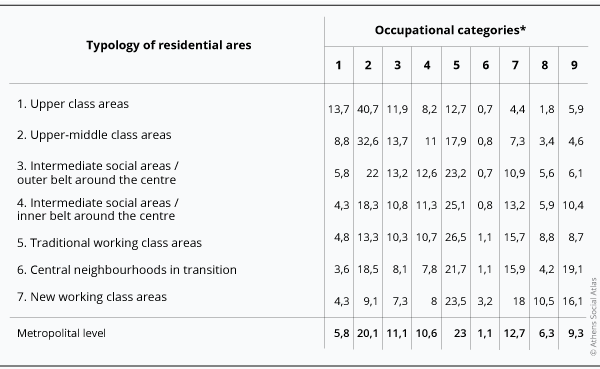
* 1. Managers, 2. Professionals, 3. Technicians and related professions, 4. Office employees, 5. Service employees and salespersons, 6. Skilled farmers, animal breeders, forestry workers and fishers, 7. Skilled workers and related professions, 8. Machine tool operators and assembly workers, 9. Unskilled workers.
Data source: EKKE-ELSTAT (2015)
Table 5.1.4 shows the social composition of the seven types of residential areas. There is a gradual change from type 1, where upper occupational categories are overrepresented to type 7 where lower occupational categories are overrepresented. This gradual change is clearly depicted in Figure 1, where occupational categories are aggregated in three broad categories: upper (managers and professionals), intermediate and working class –the first containing categories 1 and 2, the second 3, 4 and 5 and the third 6 to 9 of Table 5.1.4.
Figure 5.1: Percentage composition of residential areas in metropolitan Athens in terms of broad occupational categories (2011)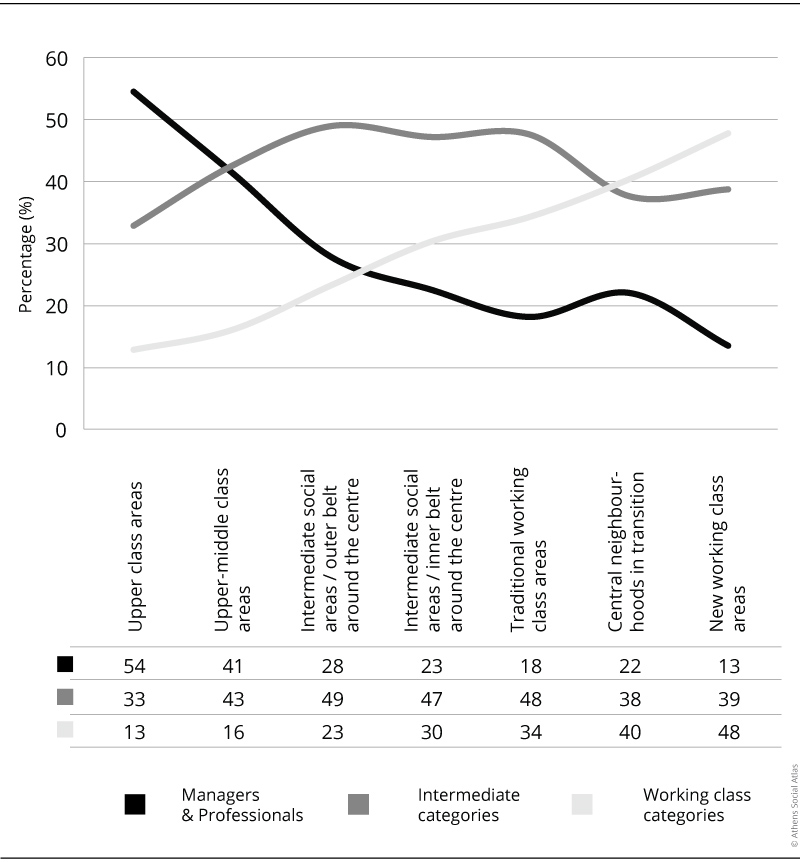
Data source: EKKE-ELSTAT (2015)
Managers and professionals are the absolute majority only in type 1 residential areas. In type 2 their presence is almost equivalent to that of intermediate categories. The latter are the majority in most types (type 2 to 5), while working class categories are the majority in the last two types (6 and 7). The only “anomaly” in this gradual change of percentage presence of social categories in the hierarchy of social types appears in the neighbourhoods of the centre under social reshuffling (type 6). Managers –and mainly professionals– have higher percentages than expected in this type of areas and intermediate categories have lower ones. These are the most socially polarised areas of the city.
[1] ‘Developed’ is used for countries in the category ‘very high human development’ according to the Human Development Index (HDI) of the UN Development Program (UNDP) in 2011; HDI combines life expectancy at birth, average duration of schooling and GDP per capita. Further details at: http://www.undp.org/content/undp/en/home/librarypage/hdr/human_developmentreport2011.html.
Entry citation
Maloutas, T. Spyrellis, S. (2019) Inequality and segregation in Athens: Maps and data, in Maloutas T., Spyrellis S. (eds) Athens Social Atlas. Digital compendium of texts and visual material. URL: https://www.athenssocialatlas.gr/en/article/inequality-and-segregation-in-athens/ , DOI: 10.17902/20971.92
Atlas citation
Maloutas T., Spyrellis S. (eds) (2015) Athens Social Atlas. Digital compendium of texts and visual material. URL: https://www.athenssocialatlas.gr/en/ , DOI: 10.17902/20971.9
References
- ΕΚΚΕ-ΕΛΣΤΑΤ (2015), Πανόραμα Απογραφικών Δεδομένων 1991-2011. Διαδικτυακή εφαρμογή για την πρόσβαση και χαρτογράφηση κοινωνικών δεδομένων, διαθέσιμο από: http://panorama.statistics.gr/.
- Maloutas, T. (1997), «La ségrégation sociale à Athènes», Mappemonde, 4(97): 1-4.
- Μαλούτας, Θ. (2000), «Κοινωνική μορφολογία των μεγάλων αστικών κέντρων», στο Θ. Μαλούτας (επιμ.) Κοινωνικός και Οικονομικός Άτλας της Ελλάδας, τ. 1: Οι Πόλεις, Αθήνα-Βόλος, ΕΚΚΕ – Πανεπιστημιακές Εκδόσεις Θεσσαλίας, σ. 46-47.
- Μαλούτας, Θ. (2018) Η κοινωνική γεωγραφία της Αθήνας. Κοιννωικές ομάδες και δομημένο περιβάλλον σε μια νοτιοευρωπαϊκή μητρόπολη, Αθήνα, Εκδόσεις Αλεξάνδρεια.
- Μαλούτας, Θ., Πανταζής, Π. κ.ά. (1999), Η κοινωνική γεωγραφία των ελληνικών πόλεων. Αθήνα – Λάρισα – Βόλος, Τελική έκθεση, Ερευνητικό έργο «Η κοινωνική μορφολογία των ελληνικών πόλεων», Φορέας ανάθεσης: ΥΠΕΧΩΔΕ, Διεύθυνση Πολεοδομικού Σχεδιασμού. Φορέας υλοποίησης: Εργαστήριο Χωρικής Ανάλυσης & Θεματικής Χαρτογραφίας, Πανεπιστήμιο Θεσσαλίας, Τμήμα ΜΧΠΑ.
- Préteceille, E. (2015), Les évolutions de la ségrégation dans la métropole parisienne 1999-2008, Παρίσι, Sciences Po – OSC.
- Robson, B.T. (1969), Urban Analysis. A Study of City Structure with Special Reference to Sunderland, Καίμπριτζ, Cambridge University Press.
- Sivignon, M. (σε συνεργασία με) Deslondes, O., Maloutas, T. & Auriac, F. (επιμ.) (2003), Atlas de la Grèce, Παρίσι, CNRS-Libergéo – La Documentation Française.
- Spyrellis, S.N. (2013), Division sociale de l’espace métropolitain d’Athènes. Facteurs économiques et enjeux scolaires, Διδακτορική διατριβή, Παρίσι, Université Paris-7 Denis Diderot.
- Tabard, N. & Aldeghi, I. (1990), Transformation socio-professionnelle des communes de l’Ilede-France entre 1975 et 1982, Παρίσι, CRÉDOC.
- Timms, D. (1971), The Urban Mosaic. Towards a Theory of Residential Differentiation, Καίμπριτζ, Cambridge University Press.

