Intergenerational social mobility: Social inequality in the access of young people to education and occupation during the 2000s*
Maloutas Thomas
Education, Ethnic Groups, Social Structure
2016 | Feb
The reproduction of inequality through education in urban space
In capitalist societies, social inequality is reproduced structurally, as the social origin of young people –notwithstanding liberal promises for equal opportunities– still largely determines their route towards the social position they eventually hold. Education, in Western societies at least and in spite of important differences among them, has been a privileged way for social mobility, but at the same time a privileged mechanism through which individuals of varying social origins systematically develop different and unequal aptitudes marking their social trajectories (Moore 2004). Social origin in terms of unequal economic, cultural and social capital remains an important factor in determining the social outcome of the educational process.
The democratisation of education in modern times allowed access to employment and power positions, which previously were hitherto a hereditary privilege. This democratisation was a gradual process that prolonged educational trajectories, increased the average level of education, as well as the participation of representatives from lower social strata in all levels of education (Moore 2004). Thus, social mobility increased but inequality continued to be reproduced systematically, since access to constantly higher educational skills required by the sought-after professional posts remained unequal (Duru-Bellat 2006).
At the same time, education is a mechanism legitimising the socially unequal result it creates, attributing unequal educational performance to unequal personal characteristics of individuals and, primarily, to their unequal abilities and the unequal efforts they have made (Duru-Bellat 2009, Dubet et al. 2010).
The educational strategies of the middle classes were reinforced by educational policies that increased parental choice during the past decades in places where neo-liberal ideas and policies prevailed (Oria et al. 2007). These policies have resulted in an increase in social inequalities (Power et al. 2003, Dubet et al. 2010, Dronkers et al. 2010, Oberti et al. 2012, Merle 2012).
The intensity of family educational strategies and their impact on social inequality are related to the development of the middle classes. Things have significantly changed from the time when the middle class represented a small minority; since the 2nd World War the middle class has been expanding in Western societies, and more recently has been undergoing an intense process of internal diversification.
Capitalist globalisation and the economic restructuring it brought about have intensified social inequalities. In the Western world’s major capitals, this trend has assumed the form of social polarisation (Sassen 1991) while income divergence between higher and lower deciles and percentiles has increased significantly (Hamnett 2003). Inequality has increased less in smaller capitals, where the pressure of globalisation on local job markets is generally more limited. In any case, the predominance of neoliberal social regulation models has freed market mechanisms and their dividing impacts, deepening inequality, while the consequences were more limited in cases marked by some form of resistance against the dismantling of welfare systems (Hamnett 1996).
Traditionally, education has been a privileged field of investment for Greek families, highly connected to the increased social mobility of the post-war period. Many researchers have described the role of education in the reproduction of social inequality during the post-war decades (Λαμπίρη-Δημάκη 1974, Τσουκαλάς 1977,Φραγκουδάκη 1985, Κάτσικας & Καββαδίας 1994,Κοντογιαννοπούλου-Πολυδωρίδη 1995, Κασσωτάκης 1996, Panayotopoulos 2000, Sianou-Kyrgiou 2006 & 2008, Χατζηγιάννη & Βαλάση 2009, Θάνος 2010 & 2012).
The data from the 2001 Population Census were used to highlight an important socio-spatial differentiation in educational performance (Maloutas 2007). More recently, the processing of a large database with the characteristics and the performance of all national university entry exams participants in 2004-2005 in Attica showed the relationship among performance, school and residence area (Maloutas et al. 2013). The importance of private schools , as well as the particularities of the housing market –namely the high rate of home ownership and low housing mobility (Allen et al. 2004)– are key parameters explaining the housing selection strategies developed by middle and upper-middle class households and the impact of those strategies on reproducing social inequalities.
In this paper, the focus is exclusively on the reproduction patterns of class positions for different social groups in Athens. The main issues developed in the following are the social differentiation in the length of educational trajectories; the correlation between the occupational category of parents and children, and the role of the place of residence in reproducing class positions through education and the job market.
Aim and methodology
The paper’s aim is to highlight the trends of social mobility in Athens between 2001-2011, starting after the long and intense post-war mobility had stopped and ending when the current crisis had become apparent. The trends of intergenerational social mobility within that decade become evident when the social position of the parents is compared to that of their children according to the 2001 and 2011 Population Census data.
Large sample surveys are the usual means to examine social mobility and to analyse the intergenerational transitions among occupational categories with the required level of detail. In addition, field research with a fixed sample (panel) is used in order to control changes in these trends over time. Goldthorpe’s (1980) surveys on social mobility in Britain are amongst the most comprehensive and characteristic of the kind.
This paper attempts to identify social mobility patterns using an alternative approach, based on the analysis of detailed data from the 2001 and 2011 Population Census (EKKE-ELSTAT 2015).
This choice is based on the premise that in Athens –as well as in Southern Europe in general– intergenerational cohabitation, a result of the relative delay in the disengagement of young people from the parental home, allows us to trace mobility patterns through the correlation of attributes (occupational and other) of the household’s members, taking into account the position of each person in the nuclear family. Thus, contrary to countries where young people usually leave their parents’ household before they begin their careers, in Southern Europe, their long-term cohabitation allows the detection of social mobility patterns. The long-term intergenerational cohabitation in Southern Europe indirectly offers the possibility to realise such research, provided that the individuals residing with their parents for long periods are not significantly different from same-age peers, an issue analysed below.
The use of Population Census data is obviously faced with limitations. Given those limitations, the paper focuses on:
- Calculating the length of educational trajectories for the age group 15-29 (those born between 1972 and 1987 for the 2001 Census, and between 1982 and 1997 for the 2011 Census) in relation to the social status of the parental household. This shows some preliminary information on inequality in terms of social mobility in the sense that the length of educational trajectories of children appears to correlate with the social status of their parents.
- Correlating the occupational category of those who remain in the parental household and are part of the age group 22-34 (those born between 1967 and 1980 for the 2001 Census and between 1977 and 1990 for the 2011 Census) with the social characteristics of the parental household. In this way, we matched specific occupational positions between parents and children, providing an indirect outlook on social mobility patterns and trends.
- How the place of residence affects social mobility, a question examined through the comparison of mobility patterns and trends of the same social group in places of residence with different social characteristics.
In addition to the key parameter of social status, we examine the role of gender and ethnic group in the formation of social mobility patterns and trends.
The most significant methodology issue in this case concerns the way in which the social character of the parental household is defined. Given the investigative character of this research, we have opted to refer exclusively to the profession of the father [1].
Young people residing with their parents.
The increasing difficulty young people face in entering the job market and the expansion of social inequalities have led to increased rates of further delays in achieving independence from the parental household. According to research by EUROFOUND, for young people between 18-29 in Europe, cohabitation rates with parents reached 48% in 2011, up from 44% in 2007. Greece is close to the average, with 46% and 37% respectively while for Italy and certain Eastern European countries (Hungary, Slovenia, Lithuania), rates are much higher and increasing at a fast pace (EUROFOUND 2014). The upward trend is also evidenced in countries with traditionally lower rates, such as the United Kingdom, where the rate of cohabitation with parents for children between 20-34 years increased from 21% in 1996 to 26% in 2013 (BBC 2014).
According to the data of the last two Population Censuses, the rate of cohabitation of young individuals between 22-34 years in Athens rose from 35.4% in 2001 to 39.3% in 2011. The increase seems to be mainly due to young unemployed individuals (table 1), though the percentage of working young individuals that live with their parents amounts also to more than 1/3 of their group.
Table 1: Percentage of young individuals between 22-34 years residing in parental households, in relation to their main occupation in Athens.
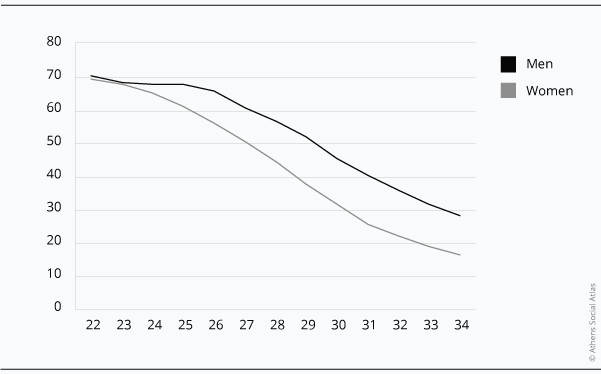
Figure 1: Percentage of young male and female Greeks living in their parental homes in Athens in 2011.
Cohabitation with parents mainly is higher for men (43.6%) rather than women (34.9%, figure 1) a phenomenon observed internationally. Also, it mainly concerns people born in Greece (44.1%) rather than people not born in Greece (17.3%), the latter including in this case individuals from non EU Eastern European countries, North Africa, the Middle East and the Indian subcontinent.
How representative a sample are young individuals residing in parental households?
To evaluate how representative young individuals residing with their parents are, compared to the entire young population of their age, we have compared a series of characteristics of these two groups.
Greeks aged 15-29 living in their parents’ household appear to follow approximately the same length of educational trajectories as the total of same-age peers. A very small elongation of these trajectories for the first group appears between 2001 and 2011. However, this is not the case for young migrants, who present significantly longer educational trajectories when living with their parents. This significant difference may be linked to the different conditions for integration between first and second generation migrants.
As for unemployment, young people aged 15-19 residing at their parents’ households did not significantly differ from the overall population in 2001, while in 2011 unemployment seems to be a reason for remaining at their parents’ house.
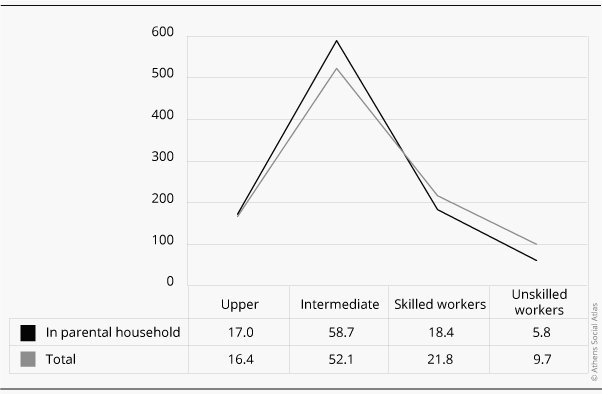
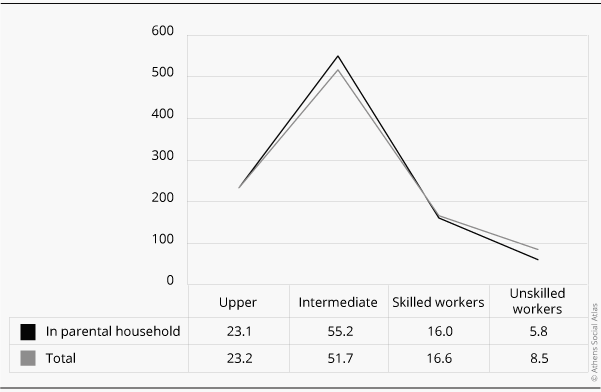
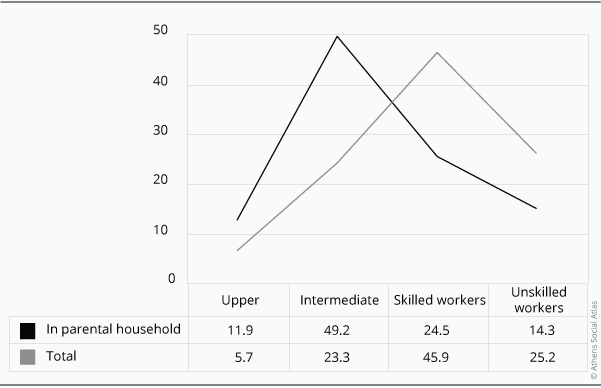
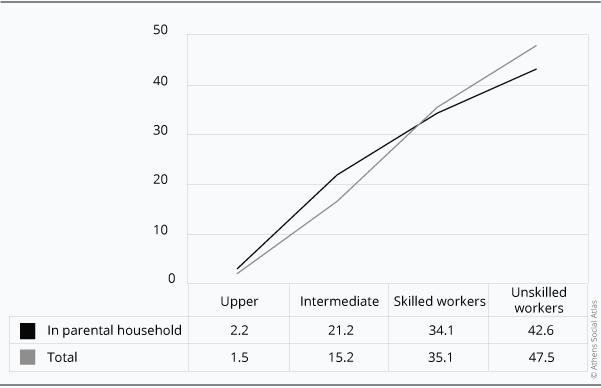
Young people staying with their parents do not appear to differ from the overall population of same-age peers as to the occupational categories they belong to. Based on a rough classification into high-status occupational categories, intermediate and categories of technicians and workers, the allocation of those living with their parents and the overall age group are similar. Indeed, in 2011, the differences between the two decreased even more (figures 2 and 3).
Figure 2: Percentage of young people aged 22-34 per occupational category in Athens 2001
Figure 3: Percentage of young people aged 22-34 per occupational category in Athens 2011
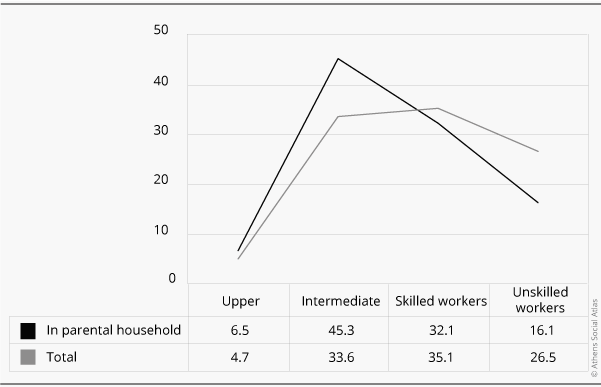
For young migrants, things are somewhat different. Those from Eastern Europe, the Middle East and North Africa who reside with their parents, have significantly higher professional posts compared to their overall age group with the same ethnic identity, while the position of those from the Indian Subcontinent is equally low in both cases (figures 4,5 and 6), confirming the social hierarchy of ethnic groups (Kandylis et al. 2012).
Figure 4: Percentage of young individuals aged 22 to 34 from Eastern Europe per occupational category in Athens 2011
Figure 5: Percentage of young individuals aged 22 to 34 from countries of North Africa and the Middle East per occupational category in Athens 2011
Figure 6: Percentage of young individuals aged 22 to 34 from the Indian Subcontinent per occupational category in Athens 2011
Summing-up, we found that young men and women residing in their parental homes have approximately the same educational trajectory length and distribution in broad occupational categories, as their overall age category. This similarity is almost absolute for native Greeks, while young migrants or children of migrants present significant differences in both the length of their educational trajectories and their occupations in favour of those staying at the parental home.
General social mobility trends in the 2000s.
Education
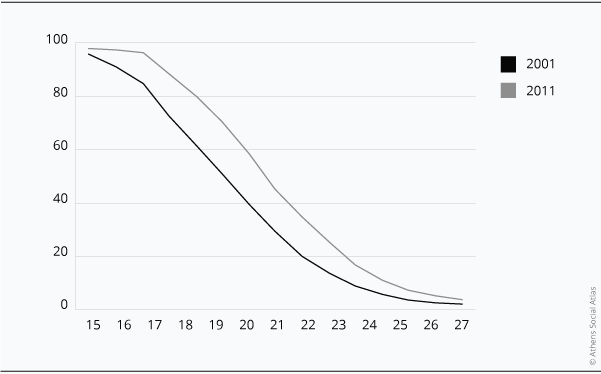
Based on the 2001 and 2011 Population Censuses, the lengthening of educational trajectories is a key characteristic of the 2000s, (figure 7).
Figure 7: Percentage of young individuals aged 15-29 who are pupils/students
The comparison between 2011 and 2001 indicates that the 12-year long education has become the norm for the majority of young people up to 18 years old. The group whose age corresponds to university education has significantly increased in percentage too. Educational trajectories have undoubtedly lengthened.
The educational trajectories of both young men and women have lengthened, while the distance between men and women in 2001, insofar as length of educational trajectories is concerned, widened in favour of women in 2011.
Occupation and unemployment
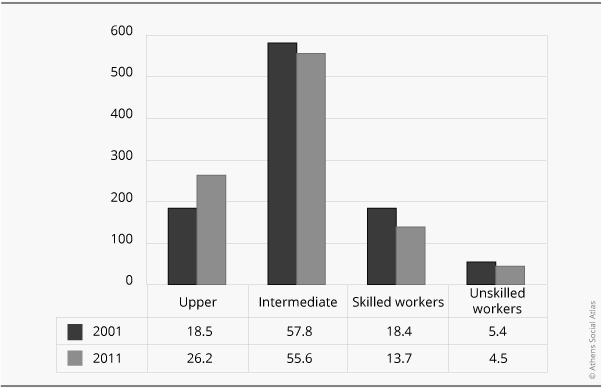
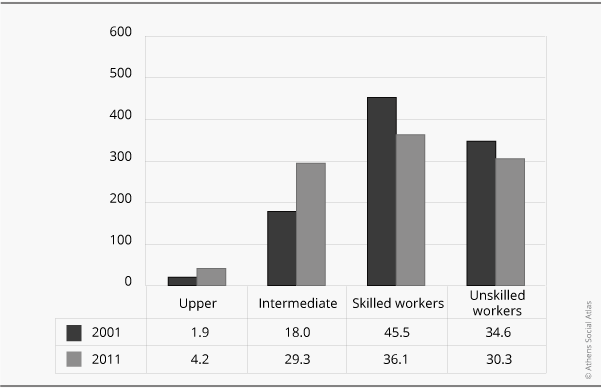
Figure 8: Percentage of young (22-34) native Greeks per broad occupational category in Athens (2001 & 2011)
According to the distribution of young Greeks aged 22-34 in four broad occupational categories in the beginning and the end of the 2000s, only the percentage of those classified in the highest category is increasing, while percentages in all other categories, especially those of non-specialised and skilled workers, are decreasing. For young migrants or children of migrants, the percentage of those included in the intermediate and upper categories is increasing, while the amount of those included in the remaining categories is decreasing. Overall, the data show an increase in the upper end of the scale and a decrease in the remaining spectrum of professional positions (figures 8 and 9)..
Figure 9: Percentage of young (22-34) migrants per broad occupational category in Athens (2001 & 2011)
At the beginning of the decade, unemployment was much lower for young men compared to young women. As overall unemployment rose towards the end of the decade, gender differences have disappeared, at least for the younger generations (Μαλούτας 2015b, 147-148).
The general trends during the 2000s were as follows:
- Educational trajectories have lengthened overall and 12-year education became the norm almost for the entire young population
- In terms of occupations, the percentage of people in upper occupational categories has increased while the weight of the remaining categories , especially workers, has decreased.
- Intermediate occupational categories are the more numerous throughout that period
- The distribution of the native Greek and immigrant population in occupational categories is very dissimilar as the relative weight of lower occupational categories is higher in the immigrant population
- Female employment is concentrated in intermediate and high occupational categories
- Unemployment rose significantly in the 2000s while gender differences decreased in young individuals
Reproduction of social inequalities
Social differentiation in the length of educational trajectories
One aspect of the reproduction of social inequality is the average length of educational trajectories in households whose heads belong to socially diverse occupational categories. In conditions of equal opportunities, the differences between these categories should be small and random, something that does not happen in reality
Figure 10: Percentage of young individuals aged 15-29 in education in Athens, by occupational category of the reference person in their household
The first finding is that the educational trajectories of young people from households belonging to higher professional groups are generally longer than those from intermediary or lower strata.
The second finding is that during the 2000s, the length of educational trajectories increased for all young people –irrespective of the social environment from which they originated.
The third finding is that the increase in the length of educational trajectories was significantly higher for young people from families with intermediary and lower occupational categories. This is an indication of decreasing social inequality, although it is not sufficient to prove such a trend..
Regarding gender, the duration of education appears to be longer for men from families in high occupational categories: Households of legal professionals are representative of this trend. In the intermediate (for example retail salespersons) and low (Unskilled Industry and Construction Workers) occupational categories, evidence shows the inverse relationship in terms of gender.
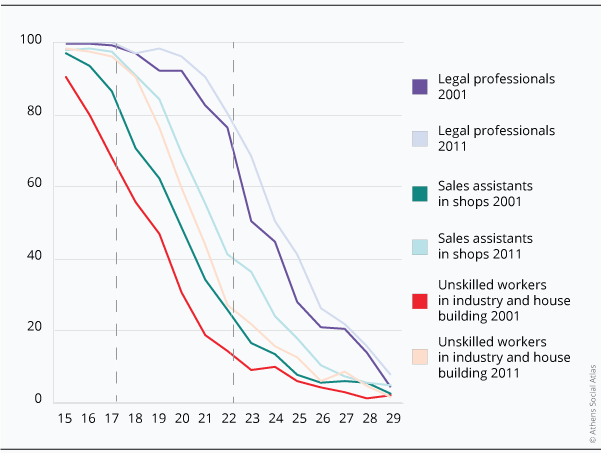
Educational trajectories have become longer for all young people irrespective of their socio-occupational background. However, the differences between social strata remain. The gap is much smaller at the end of secondary education, but significantly widens for University education age groups (figure 11). Thus, the significant convergence between people with high, intermediate and low family occupational backgrounds is confined to the completion of 12-year education, where the difference is approximately 5 percentage points at age 17 years. At the age of completion of 4-year higher education the difference remains significant (40-50 percentage points).
Figure 11: Percentage of young individuals in Athens, aged 15-29, in education by age and occupational category of the household’s reference person
The educational trajectories are longer regardless of the nationality of the reference person in the household. The three large nationality groups selected as indicative of the differences among the immigrant population were the people born in Eastern Europe, North Africa and the Indian Subcontinent. Young people originating from Eastern Europe and North Africa converge with native Greeks insofar as the length of their educational trajectories is concerned –a fact also reflecting the fairly successful inclusion of second generation migrants in education. For people originating from the Indian Subcontinent , the extension of educational trajectories was much smaller and the difference from native Greeks increased instead of decreasing.
The convergence between native Greeks and main migrant groups as to the length of education trajectories –as is the case with social convergence mentioned above – is true for 12-year education but much less for post-secondary or university education.
Social divergence in the reproduction of occupational categories
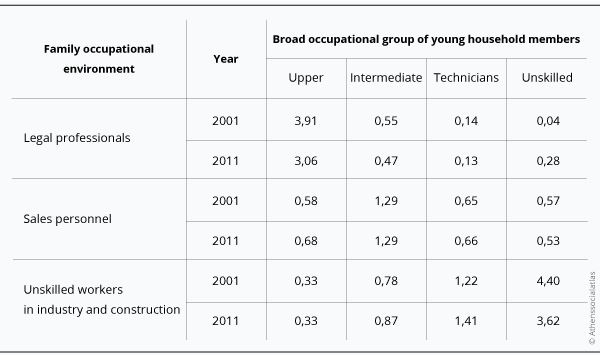
Table 2 shows the access possibilities to one of the four broad occupational categories for young people from three indicative family occupational backgrounds (Lawyers, Retail Salespersons, Unskilled Industry or Construction Workers). The number in each cell reflects the average probability of each young man or woman to join that specific occupational category, compared to the average probability of 1, i.e.irrespective of social origins.
Table 2: Probability for young individuals aged 22-34 from a household with a reference person that is a Lawyer, Retail Salesperson or Unskilled Industry or Construction Worker, to gain access to different occupational groups (average probability=1)
Table 2 shows that inequalities in access to higher and lower occupational positions remain very large at the end of the 2000s, despite their slight decrease compared to 2001. Thus, for young people from a family environment of Law graduates, the chances of pursuing a profession included in the broad group of high occupational categories are 3 times higher than average, while for those from the broad group of Unskilled Workers, the chances are three times less than the average.
Gender affects social mobility probabilities. Women have a higher probability of a career in higher professions compared to men, regardless of their social origin. However the probabilities of women pursuing such a career or pursuing a profession that does not require specialisation are only slightly higher than those of men, when both come from an environment of high occupational categories. The difference in favour of women is much larger for young people whose parents belong to intermediate or lower occupational categories. The difference is even more significant when it comes to women’s ‘avoidance’ of skilled and unskilled worker professions, which are male-dominated.
The role of space in the reproduction of inequalities
The neighbourhood effect and the length of educational trajectories
The debate on the role of space in the reproduction of social inequalities is extensive and complicated. The fact that young people growing up in Psychiko or Ekali have more chances of covering longer educational trajectories and assume higher positions in the occupational hierarchy than those growing up in Perama or Zefyri is not proof of the role space plays however. This difference is mainly due to the different social characteristics of the population in those areas and not due to space itself.
The spatial characteristics –other than those of the immediate (family) social environment from which the young individuals derive– relate to three main parameters (Buck 2001, Atkinson and Kintrea 2001, Lupton 2003):
1) The neighbourhood’s overall social character, which affects role models and the social stratification of the pupil population in local schools.
2) The quality of locally offered services, the most significant being the quality of local schools.
3) The neighbourhood image, that can range from stigmatisation to the impression that it is a top-end neighbourhood.
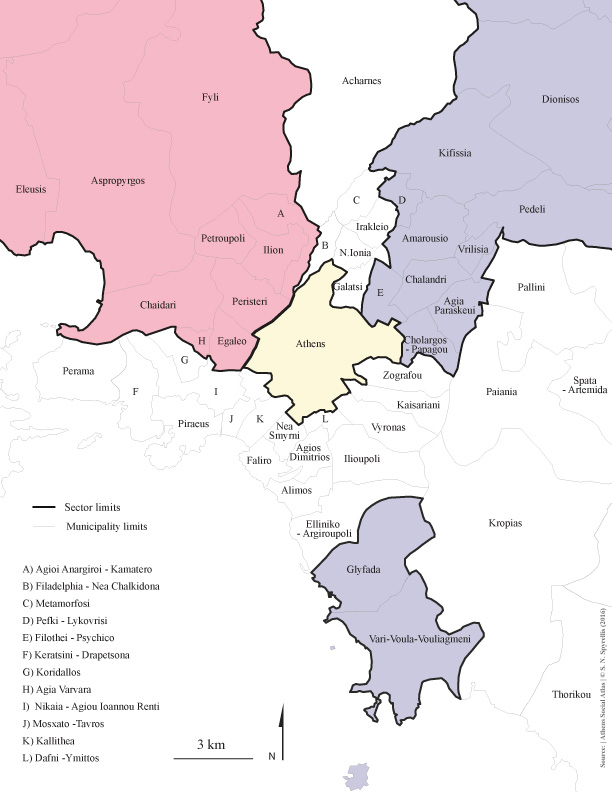
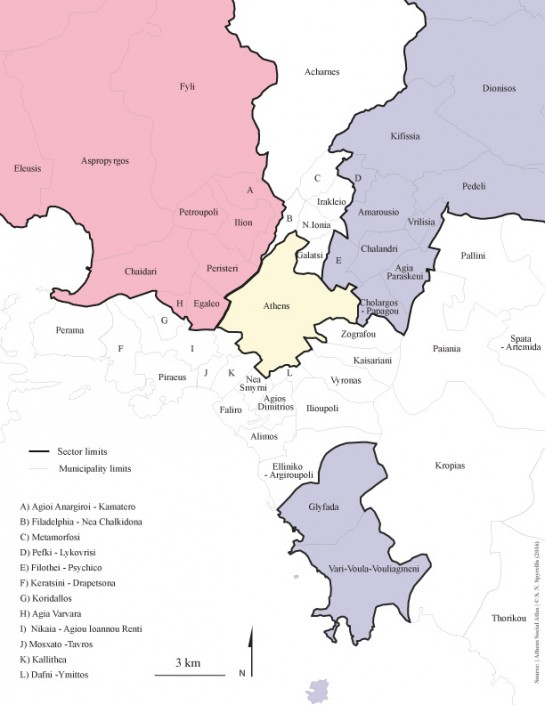
The data from the Population Census are not adequate for a satisfactory assessment of the role of space – the neighbourhood effect. Hence, the paper attempts a limited approach of the neighbourhood effect by looking into potentially significant differences between young individuals from the same socio-professional environment, but residing in neighbourhoods with a significantly different social character. The indicators used are the length of educational trajectories and unemployment. We have selected two Municipality groups (Northern and Southern suburbs on the one hand and Western suburbs on the other hand standing for broad middle-class and working-class environments respectively, map 1).
Map 1: Municipalities selected for the Northern and Southern Suburbs group (blue) and the Western Suburbs (pink)
The differences we observe in the length of educational trajectories of young individuals from parents with educational background in Law that reside either in the Northern & Southern suburb group or the Western group are very limited. On the contrary, the length of the educational trajectory of young individuals whose parents are Retail Salespersons or Unskilled Industry and Construction Workers is much longer when they reside in the Northern & Southern suburbs.
Neighbourhood effect and unemployment
Unemployment in Attica increased significantly between 2001 and 2011. However, the extent to which it affects young individuals from the same socio-professional environment, living in neighbourhoods with a different social character, varies considerably.
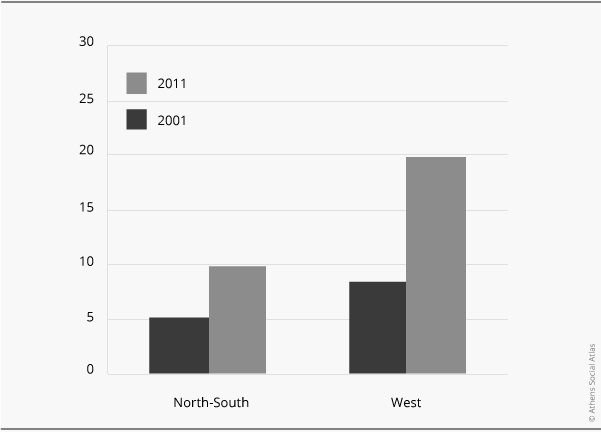
Unemployment in children of families with high professional positions (Engineers, Lawyers or Doctors) who lived in the West Suburbs in 2001 was higher compared to their peers in the Northern or Southern suburbs. In 2011, the gap between the two groups had widened further and the unemployment rate for the former was double than for the latter (figure 12).
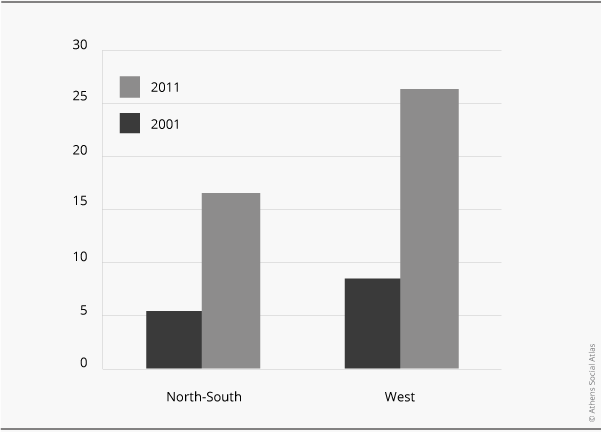
The same pattern applies to the children of Unskilled Industry or Construction Workers, the difference being that for them, the rise in unemployment was much higher no matter whether they lived in the Northern and Southern or in the Western Suburbs (figure 13).
Figure 12: Percentage of unemployed young individuals aged 22-34 whose father is an Engineer, a Lawyer or a Doctor, by place of residence in Athens
Figure 13: Percentage of unemployed young individuals aged 22-34 whose father is an Unskilled Industry or Construction Worker, by place of residence in Athens
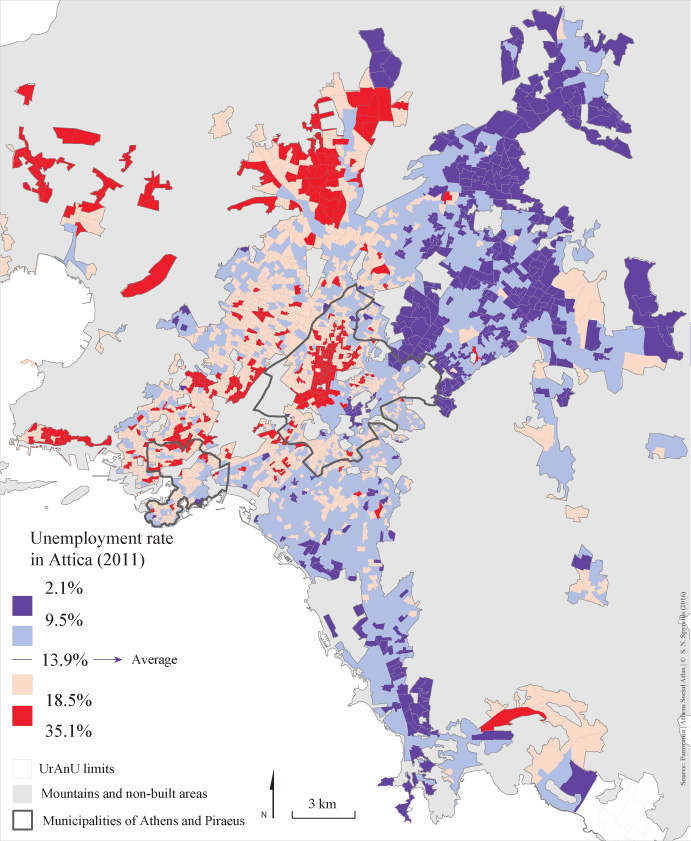
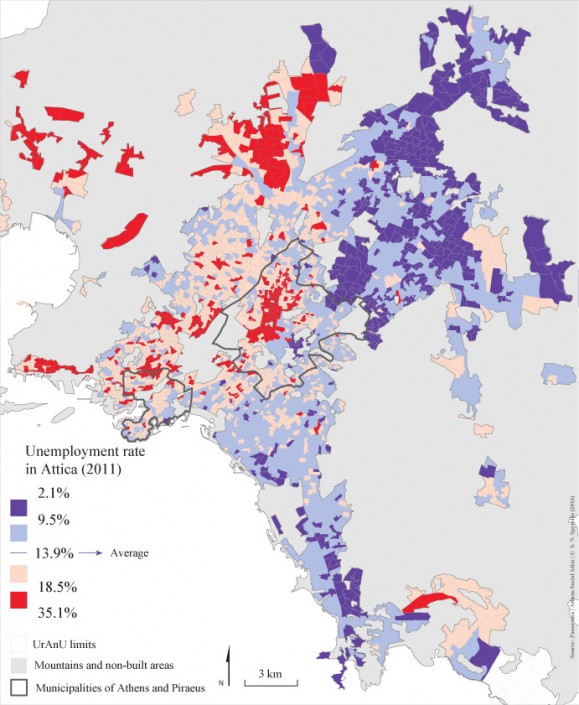
Map 2: Percentage of unemployment per Census Tract in Attica (2011)
According to the Population Census, unemployment in the Athens Metropolitan Area drastically increased in areas with a high percentage of lower socio-occupational categories.. Thus, the correlation of the spatial distribution of unemployment with the distribution of higher occupational categories (Managers and Professionals) moved from -0.46 in 2001 to -0.75 in 2011, while for the lower occupational categories (Unskilled Workers) the coefficients were 0.23 and 0.59 respectively (Maloutas 2015). This means that within a decade the spatial distribution of unemployment became much more similar to the distribution of lower occupational categories and much more dissimilar to the distribution of higher categories (map 2).
Reproduction of inequality through the patterns of intergenerational reproduction of occupations
Examples of intergenerational transition within and between occupational categories
Population Census data can be used to compare the occupation of young people who live with their parents with the occupation of the reference person in the household..
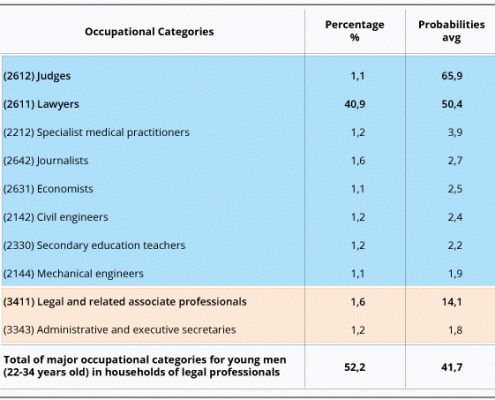
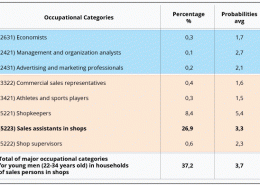
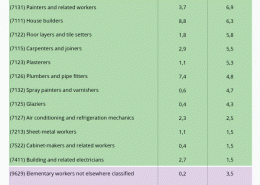
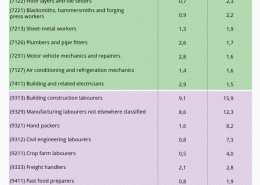
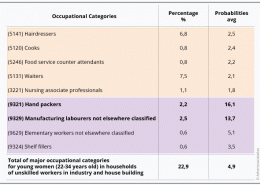
The following tables show the most common professional groups which young men and women enter into when they come from specific socio-occupational environments.
The occupational categories of the reference person in the parental home we indicatively selected are the following: Law graduates, Secondary Education Teachers, Retail Salespersons, Construction Technicians and Unskilled Industry & Construction Workers.
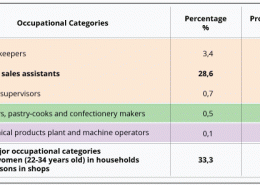
The tables show the occupational categories joined by young persons aged 22-34 of a specific socio-occupational background (column 1), the percentage of those young persons included in each occupational category (column 2) and the probability of any one young person in this particular group to join that occupational category (column 3). That probability was obtained by dividing the percentage in column 2 with the percentage of that occupational category in the overall population of the age group. These tables only include occupational categories for which the probability of access to those coming from a given socio-professional background, are more than 150% of the average of all young individuals of the same age.
In tables 3-12 high occupational categories have been highlighted in a light blue colour, intermediary in beige, technical occupational categories in green and unskilled workers in purple.
The observation of intergenerational professional mobility in tables 3-12 shows that the probabilities of young persons joining an occupational category depend on:
1) the hierarchical position of their parents’ profession, which they usually follow
2) the particular subject of their parents’ profession, which they follow more frequently when it requires a significant level of specialisation, thus creating a family tradition
Most occupational categories present a high degree of internal (family) reproduction without there necessarily being any institutional/regulatory obstacles in the access of third parties to those professions. The percentage of internal reproduction is highly correlated to the social position of the profession: high professional positions generally have higher reproduction percentages followed by lower positions in specialised manual labour professions.
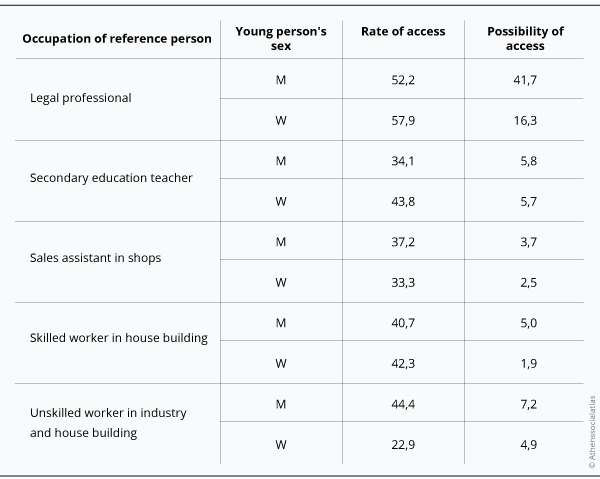
Table 13 summarises the information appearing in the previous tables (3-12) with regard to the access percentage and the probability to access professions that are the most common and probable choices of young persons between 22-34 years of age, according to the profession of the reference person of the household they are part of.
Table 13: Percentage and access probabilities to occupational categories towards which young individuals aged 22-34 are mainly oriented according to the profession of the reference person in their household (2011)
Insofar as young individuals from families of Law graduates are concerned, more than 50% (for women the percentage reaches 60%) have access to the main choices of this specific group, which in their great majority relate to the legal profession. The probability of this group accessing these choices of occupational category is much higher than the average probability of every young individual gaining access to these categories irrespective of their socio-occupational background.
For those from households of Secondary Education Teachers, the access rate to the main choices of their group is lower, as is the difference in their probabilities of access compared to the average young person. Another difference from the previous group is that the reproduction of the family occupation is much more limited, even if it remains much higher than the majority of the remaining occupational categories. In addition, the usual choices of young women in that group lead them to higher occupational categories at a rate exceeding 40% while for men of the same group this rate is almost half (tables 5 & 6).
Young persons from families of Retail Salespersons have lower rates of access to their group’s main choices (which to a large extent are directly related to the occupation of salesperson). This means that the dispersion of more than 60% of the young people of this group is wide and covers a large number of other occupational categories.
As for the two remaining groups of young persons, coming from families of manual workers, the access rate to the main group choices (also directly related to their socio-occupational background) is high, mainly for men. The occupational environment of these households is largely male-dominated and its reproduction by young women of the group is not easy. Thus, the course of these women appears to be upward, mainly towards the wider group of intermediate occupational categories. However, a more careful observation of occupational categories usually accessed by these young women shows that they mainly join lower categories of service-related professions (hairdressers, waitresses, beauticians). Based on these observations, the general finding that young women have an upward trajectory compared to young men has to be stated with some caution.
Conclusion
Investigating social reproduction with the use of data from the two most recent Population Censuses led to the following conclusions, briefly summarised below:
- Educational trajectories have lengthened, but this does not lead to a reduction in social inequalities.
- The lengthening of educational trajectories concerns everyone, including young migrants. More education is socially diffuse, which initially seems to lead to a reduction in inequalities created by unequal education credentials.
- Notwithstanding this lengthening and the social diffusion of education, inequalities persist, especially with regard to ages above secondary education. Inequalities are particularly high in ages corresponding to the end of graduate and post-graduate studies. Consequently, the lengthening of educational trajectories does not seem to expand to those levels that constitute a stake for access to sought-after positions in the job market. Essentially, it is limited in the completion of Secondary education, which has gradually become a prerequisite in order to avoid exclusion from access to the job market. It is not a competitive advantage, as it is a given for the vast majority of young people of the same age.
- The difference in favour of women with regard to the length of educational trajectories widened in 2011, due to a series of factors, among which the limited and low-quality positions in manual labour categories for women in comparison to men.
- Employment is a scarcer resource, given the rapid increase of unemployment at the end of the decade, creating conditions that favour the increase of inequalities.
- Access to employment became socially more unequal in the 2000s, as concluded by the increase of correlation coefficients between unemployment and lower professional positions.
- The increasing effect of unemployment on inequality is apparent in the noticeable spatial concentration of unemployment in the 2000s in areas where lower occupational categories are over-represented.
- The comparison of reproduction possibilities for a series of indicative occupational categories between 2001 and 2011 shows a slight decrease in unequal probabilities of accessing higher and avoiding lower occupational positions, in favour of the lower and against the higher categories, while probabilities for intermediate categories remain steady. These small decreases might be due simply to:
- An increase in the population share of higher and the reduction of lower categories in the 2000s.
- A change, between 2001 and 2011, in the content of the aggregate hierarchical groups under which occupational categories are classified by the International Labour Office., This contributed to a further increase in the rates of higher groups and the decrease of lower ones
- Mapping specific reproduction patterns for selected occupational categories has shown that parental occupation leads to a wide range of possible choices for young people when it comes to professional hierarchy as well as the content in which intergenerational trajectories are traced. In this sense, intergenerational social mobility is defined to a large extent by the parents’ occupation.
[1] An additional problem is the change of the definition of household “heads” (1991) or “persons in charge” (2001) between Censuses. These terms do not appear in 2011 and hence was substituted by the reference person, i.e. the first person reported on the census sheet, which in most cases practically coincides with the previous definitions.
* This text is a summarised version of Maloutas (Μαλούτας 2015).
Entry citation
Maloutas, T. (2016) Intergenerational social mobility: Social inequality in the access of young people to education and occupation during the 2000s*, in Maloutas T., Spyrellis S. (eds) Athens Social Atlas. Digital compendium of texts and visual material. URL: https://www.athenssocialatlas.gr/en/article/intergenerational-mobility/ , DOI: 10.17902/20971.61
Atlas citation
Maloutas T., Spyrellis S. (eds) (2015) Athens Social Atlas. Digital compendium of texts and visual material. URL: https://www.athenssocialatlas.gr/en/ , DOI: 10.17902/20971.9
References
- ΕΛΣΤΑΤ – ΕΚΚΕ (2015) Πανόραμα Απογραφικών Δεδομένων 1991-2011. Available from: https://panorama.statistics.gr/.
- Θάνος Θ (2010) Κοινωνιολογία των κοινωνικών ανισοτήτων στην εκπαίδευση. Αθήνα: Νήσος.
- Θάνος Θ (2013) Εκπαίδευση και Κοινωνική Αναπαραγωγή στη Μεταπολεμική Ελλάδα (1950-2010). Ο Ρόλος της Ανώτατης Εκπαίδευσης. Βεργέτη Μ και Καραφύλλης Α (επιμ.), Αθήνα: Αφοί Κυριακίδη.
- Κασσωτάκης Μ (1996) Η πρόσβαση στην ανώτατη εκπαίδευση στην Ελλάδα. 1η έκδ. Αθήνα: Γρηγόρης.
- Κάτσικας Χ και Καββαδίας Γ (1994) Η ανισότητα στην ελληνική εκπαίδευση. Η εξέλιξη των ευκαιριών πρόσβασης στην ελληνική εκπαίδευση (1960-1994). Αθήνα: Gutenberg.
- Κοντογιαννοπούλου Πολυδωρίδη Γ (1995) Κοινωνιολογική Ανάλυση της Ελληνικής Εκπαίδευσης. Οι Εισαγωγικές Εξετάσεις. Τσαούσης ΔΓ (επιμ.), Αθήνα: Gutenberg.
- Λαμπίρη Δημάκη Ι (1974) Για μια ελληνική κοινωνιολογία της εκπαίδευσης. Αθήνα: ΕΚΚΕ.
- Μαλούτας Θ (2015) Διαγενεακή αναπαραγωγή της κοινωνικής ανισότητας. Ανιχνευτική διερεύνηση της πρόσβασης των νέων στην εκπαίδευση και το επάγγελμα στα απογραφικά δεδομένα του 2001 και 2011. Στο: Θάνος Θ (επιμ.), Κοινωνιολογία της Εκπαίδευσης στην Ελλάδα. Ερευνών απάνθισμα, Αθήνα: Gutenberg, σ 584.
- Μαλούτας Θ (2016) Εκπαιδευτικές στρατηγικές των μεσαίων στρωμάτων και στεγαστικός διαχωρισμός στην Αθήνα. Επιθεώρηση Κοινωνικών Ερευνών 119(Α): 175–209.
- Σιάνου Κύργιου Ε (2006) Εκπαίδευση και κοινωνικές ανισότητες. Η μετάβαση από τη Δευτεροβάθμια στην Ανώτατη Εκπαίδευση (1997-2004). Παπαγεωργίου Βασιλού Β (επιμ.), Αθήνα: Μεταίχμιο.
- Τσουκαλάς Κ (1977) Εξάρτηση και αναπαραγωγή. Ο κοινωνικός ρόλος των εκπαιδευτικών μηχανισμών στην Ελλάδα, 1830–1922. 1η έκδ. Πετροπούλου Ι και Τσουκαλάς Κ (επιμ.), Αθήνα: Θεμέλιο.
- Φραγκουδάκη Ά (1985) Κοινωνιολογία της εκπαίδευσης. Θεωρίες για την κοινωνική ανισότητα στο σχολείο. Αθήνα: Παπαζήσης.
- Χατζηγιάννη Α και Βαλάση Δ (2009) Ανώτατη εκπαίδευση και αναπαραγωγή των διακρίσεων: Η «μικρή και η μεγάλη πόρτα» στην ελληνική τριτοβάθμια εκπαίδευση. Στο: Μαλούτας Θ, Εμμανουήλ Δ, Ζακοπούλου Έ, κ.ά. (επιμ.), Κοινωνικοί μετασχηματισμοί και ανισότητες στην Αθήνα του 21ου αιώνα, Αθήνα: ΕΚΚΕ, Μελέτες – Έρευνες ΕΚΚΕ, σσ 207–245.
- Allen J, Barlow J, Leal J, et al. (2004) Housing and welfare in Southern Europe. Oxford: Blackwell.
- Atkinson R and Kintrea K (2001) Disentangling area effects: evidence from deprived and non-deprived neighbourhoods. Urban studies, SAGE Publications 38(12): 2277–2298.
- BBC (2014) More than 25% of young people share parents’ homes. Available from: http://www.bbc.com/news/uk-25827061 (accessed 21 January 2014).
- Buck N (2001) Identifying neighbourhood effects on social exclusion. Urban studies, SAGE Publications 38(12): 2251–2275.
- Dronkers J, Felouzis G and van Zanten A (2010) Education markets and school choice. Educational Research and Evaluation 16(2): 99–105. Available from: http://www.tandfonline.com/doi/abs/10.1080/13803611.2010.484969.
- Dubet F, Duru-Bellat M and Vérétout A (2010) Les sociétés et leurs écoles. Paris: Seuil.
- Duru-Bellat M (2006) L’inflation scolaire: les désillusions de la méritocratie. Paris: Editions du Seuil, République des Idées.
- Goldthorpe JH (1980) Social mobility and class structure in modern Britain. 1st ed. Oxford: Claredon Press.
- Hamnett C (1996) Social polarisation, economic restructuring and welfare state regimes. Urban studies, Sage Publications 33(8): 1407–1430.
- Kandylis G, Maloutas T and Sayas J (2012) Immigration, inequality and diversity: socio-ethnic hierarchy and spatial organization in Athens, Greece. European Urban and Regional Studies 19(3): 267–286.
- Lupton R (2003) Neighbourhood effects: can we measure them and does it matter? LSE STICERD Research Paper No. CASE073, London: London School of Economics & Political Science (LSE) – Centre for Analsys of Social Exclusion.
- Maloutas T (2015) Socioeconomic segregation in Athens at the beginning of the 21st Century. In: Tammaru T, Marcińczak S, Van Ham M, et al. (eds), East meets West: New perspectives on socio-economic segregation in European capital cities, London: Routledge.
- Maloutas T, Hadjiyanni A, Kapella A, et al. (2013) Education and social reproduction: The impact of social origin, school segregation and residential segregation on educational performance in Athens. In: RC21 (ISA) Conference on ‘Resourceful Cities’, Berlin, p. 29.
- Merle P (2012) La ségrégation scolaire. Paris: La Découverte.
- Moore R (2004) Education and society: Issues and explanations in the sociology of education. Cambridge: Polity.
- Oberti M, Préteceille E and Rivière C (2012) Les effets de l’assouplissement de la carte scolaire dans la banlieue parisienne. Paris: Osc-Sciences-po.
- Oría A, Cardini A, Ball S, et al. (2007) Urban education, the middle classes and their dilemmas of school choice. Journal of Education Policy, Taylor & Francis 22(1): 91–105.
- Panayotopoulos N (2000) Oppositions sociales et oppositions scolaires: Le cas du système d’enseignement supérieur grec. Regards Sociologiques 19: 57–74.
- Power S, Edwards T and Wigfall V (2003) Education and the middle class. Buckingham: Open University Press.
- Sedghi A and Arnett G (2014) Europe’s young adults living with parents – a country by country breakdown. The Guardian, London, 24th March. Available from: https://www.theguardian.com/news/datablog/2014/mar/24/young-adults-still-living-with-parents-europe-country-breakdown.
- Sianou Kyrgiou E (2008) Social class and access to higher education in Greece: Supportive preparation lessons and success in national exams. International Studies in Sociology of Education, Taylor & Francis 18(3–4): 173–183.


