Property transformations in the centre of Athens during the economic crisis years (2009-2018). The case of Exarcheia.
Lialios Giorgos
Economy, Housing, Quartiers
2021 | Sep
Athens’ city centre during the economic crisis years
Since 2009, when the global economic crisis was “transferred” to Greece and the local economy weaknesses have surfaced, the property market began to “freeze”. In the center of Athens, businesses were shutting down and the living conditions deteriorated. Simultaneously, Athens center became a place of protests, conflict and riots.
In Exarcheia the atmosphere was already tensed, as an important event had preceded: the murder of school student A. Grigoropoulos by a police officer in December 2008. During most of the economic crisis’ decade, continuous clashes between the police and anarchists, the wanton destructions of private and public property, as well as the presence of drug dealing in this area, dominated the public debate, locally or beyond Greek borders, about Exarcheia,
However, few years after the outbreak of the crisis, the scenery started to change, due to three interconnected processes. Since 2014, the increase of tourist flows towards Athens, as the city became rapidly a city break destination. The growth of Airbnb, that spread aggressively in the whole city center (and additionally of the Golden Visa, with the latter having less intense impact on the local real estate market). Lastly, the fact that Athens emerged as an “investment opportunity” in the global real estate markets, mainly due to the very low real estate prices following years of economic recession. These developments started to have visible impacts in Exarcheia in 2015, and more intensively in 2017-2018, when local and international capital investments expanded their presence in Athens’ city center.
The research
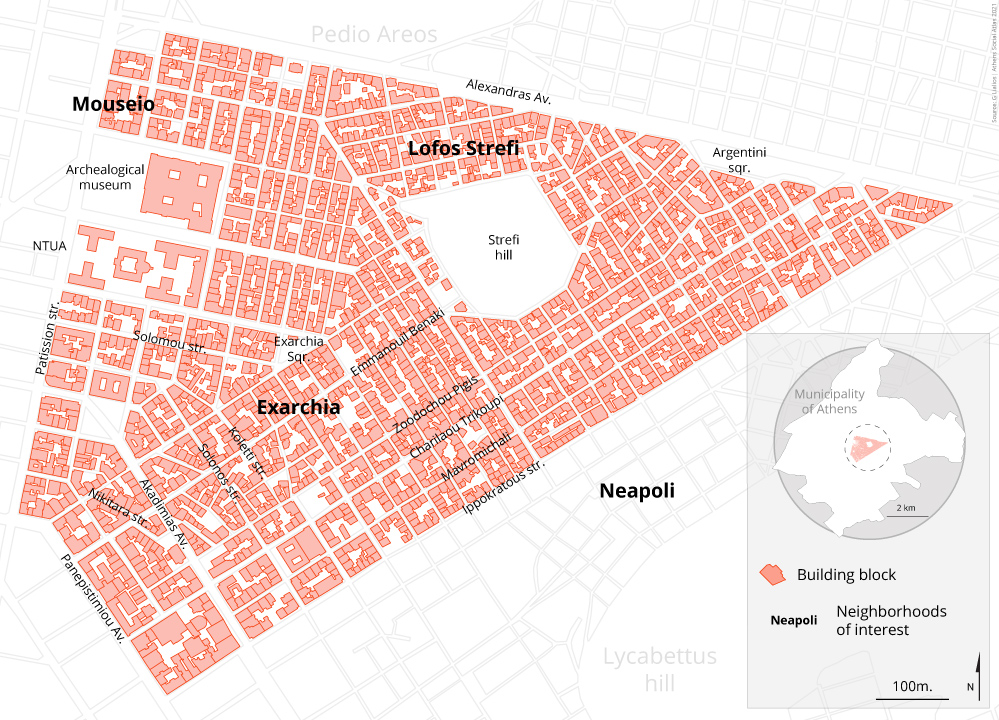
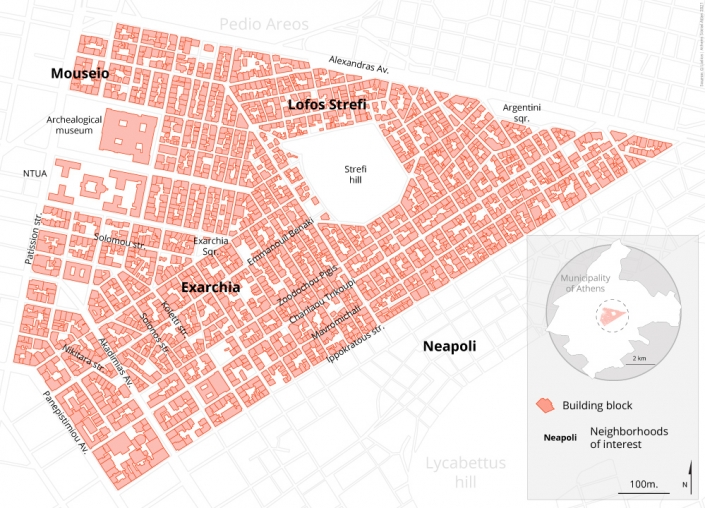
To investigate the effect of all these above interconnected dynamics on the local real estate market, the broader area of Exarcheia was chosen as a study case. Considering that urban dynamics are not limited by administrative borders, a buffer zone around the official boundaries of Exarcheia was selected. The zone concerned 227 blocks that are delimited by Patision, Panepistimiou, Alexandras and Ippokratous avenues and include: the neighborhoods of Exarcheia, Mouseio, Strefi hill, a part of Neapoli and a small part of the Athens’ historical center (map 1).
Map 1: The study area
Time
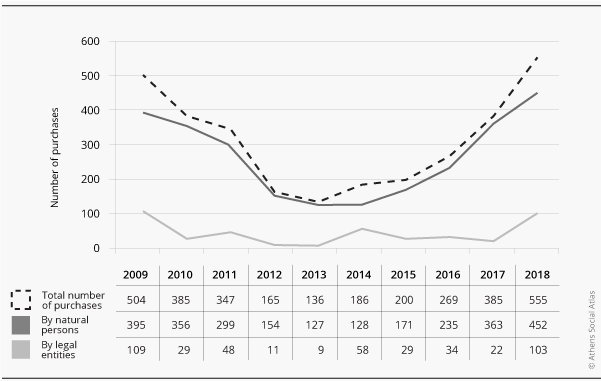
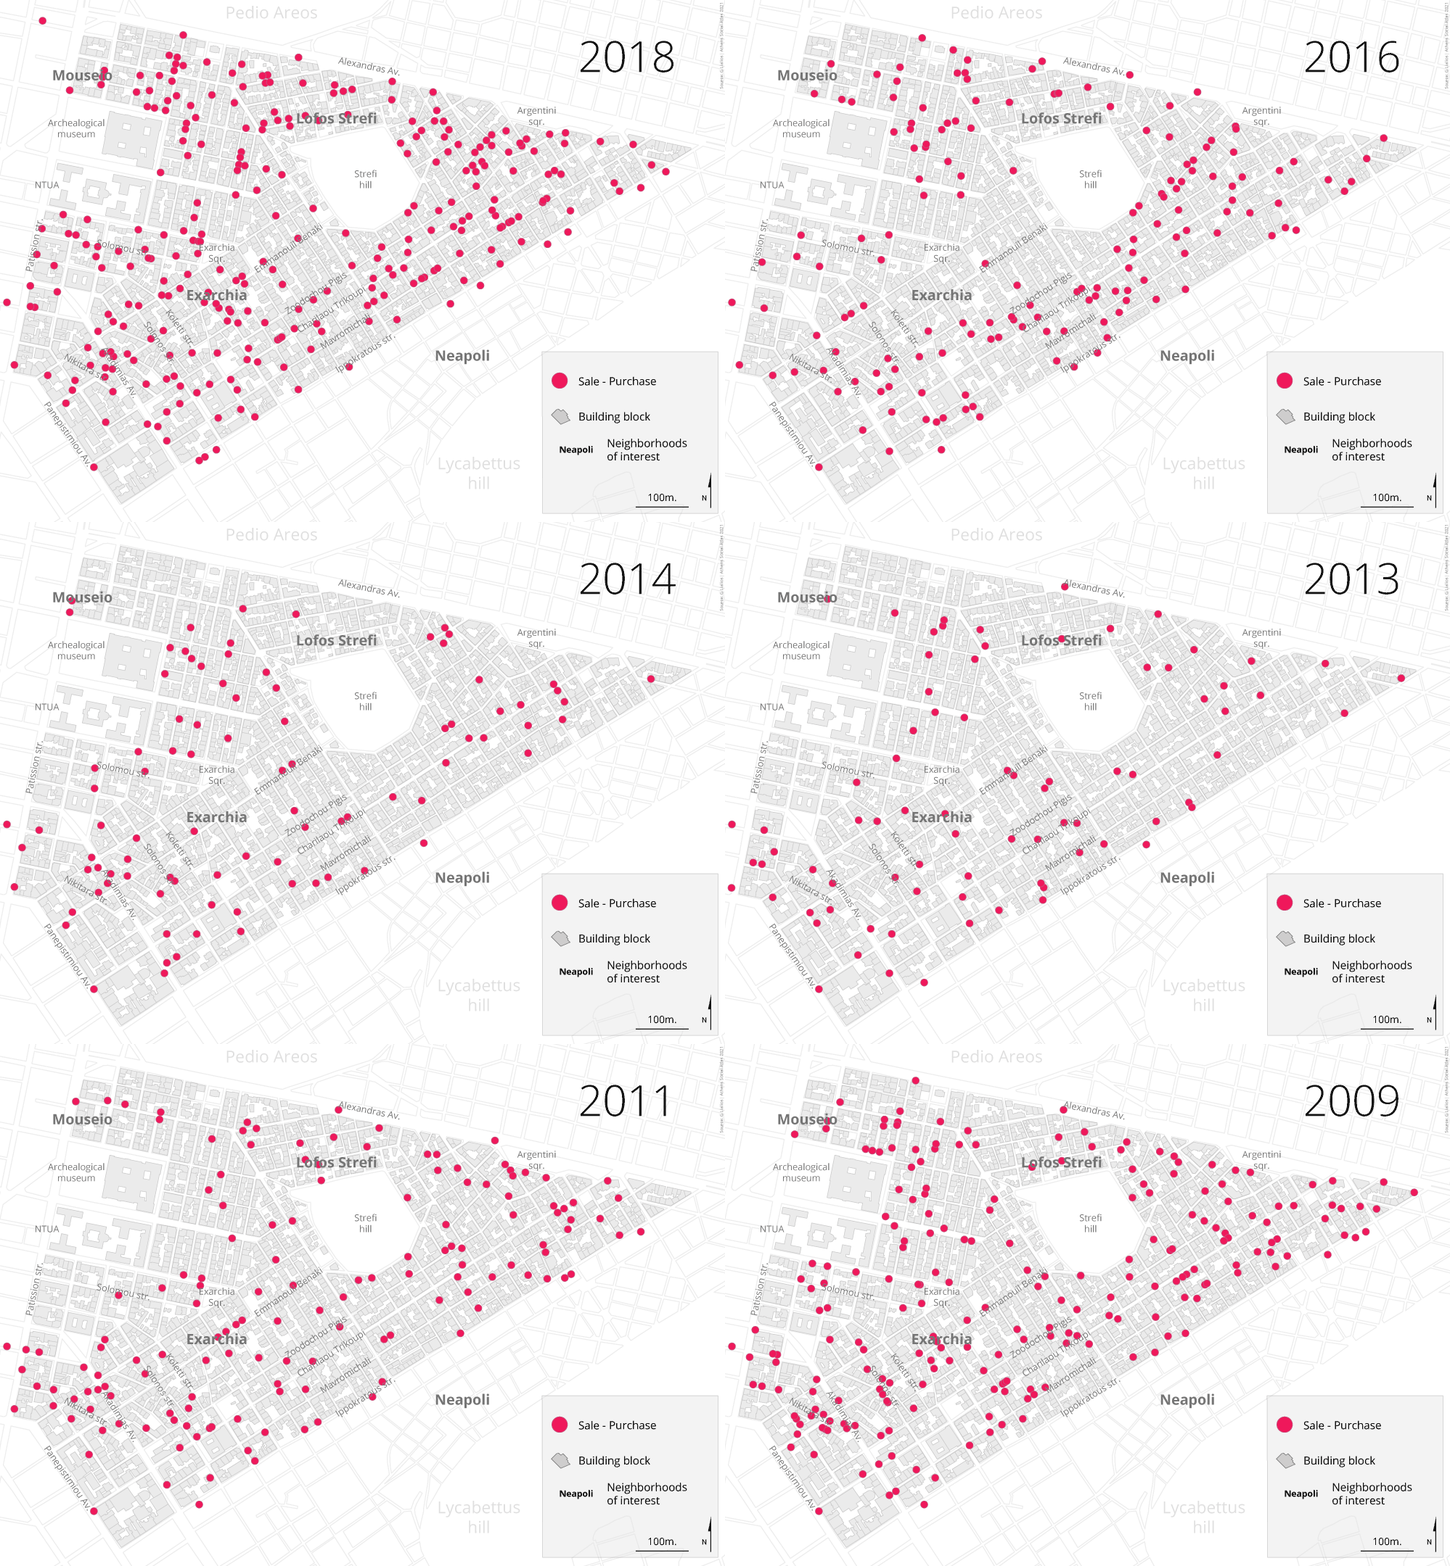
The findings show that the first signs of the real estate crisis in Exarcheia becomes visible in 2010 (-23,6% in sales, compared to 2009). In 2012 and 2013, the property transactions in the studied area were limited (-73% in 2013, compared to 2009). From 2014 onwards, the property market show signs of recovery, however a remarkable difference/growth manifests in 2017 (+43,1%, compared to 2016) and 2018 (+44,1%, compared to 2017), a growth that exceeds in absolute numbers the transactions in 2009 (graph 1, map 2).
Graph 1: Property purchases per year (2009-2018)
Map 2: Location of sales and purchases per year (2009-2018)
Space
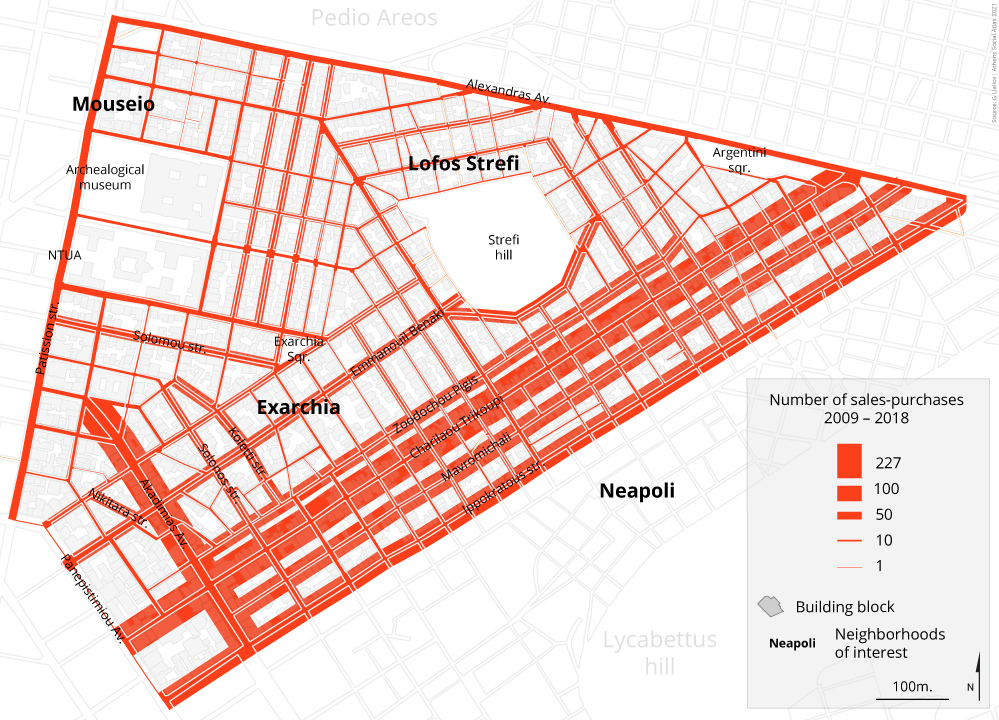
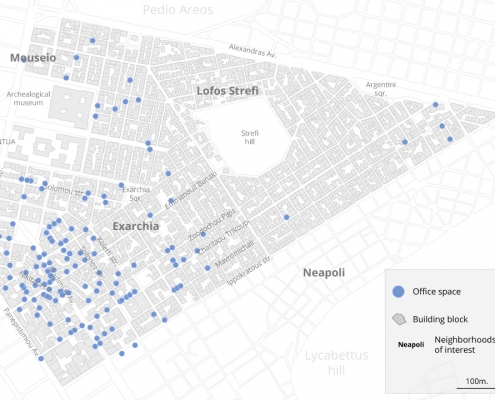
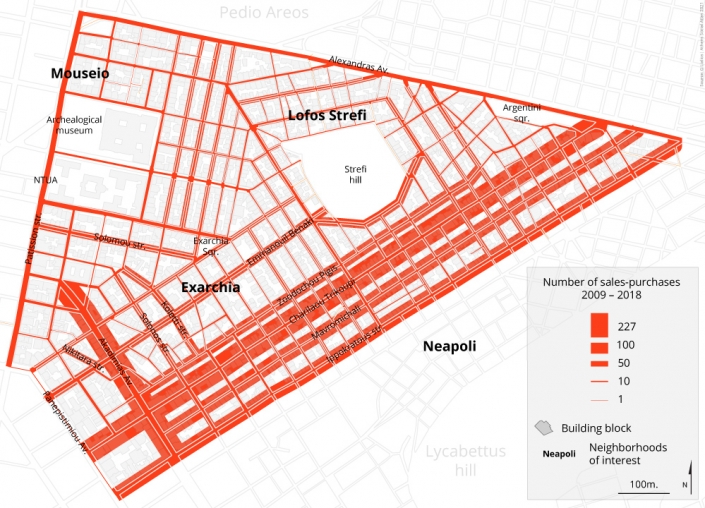
Regarding the spatial distribution, the transactions were scattered in the whole area of study. Real estate transactions happened on almost every street in the studied area, during 2009-2018. Market interest have clustered, without being limited, along main streets, in areas with higher presence of office buildings:
-Akadimias street (227 purchases, 7,25% of total)
-Charilaou Trikoupi street (219 purchases, 6,99% of total)
-Mavromichali street (135 purchases, 4,31% of total)
-Ippokratous street (133 purchases, 4,25% of total)
-Zoodochou Pigis street (102 purchases, 3,26% of total).
Considerable number of transactions was also located at Benaki, Koletti, Nikitara, Solomou and Solonos streets. It should be noted though, that the property transactions along the boundaries of the study area (parts of Alexandras, Panepistimiou and Patision – all main streets) were fewer than those along secondary streets of the area (map 2).
Map 3: Distribution of sales and purchases per street (2009-2018)
Property use
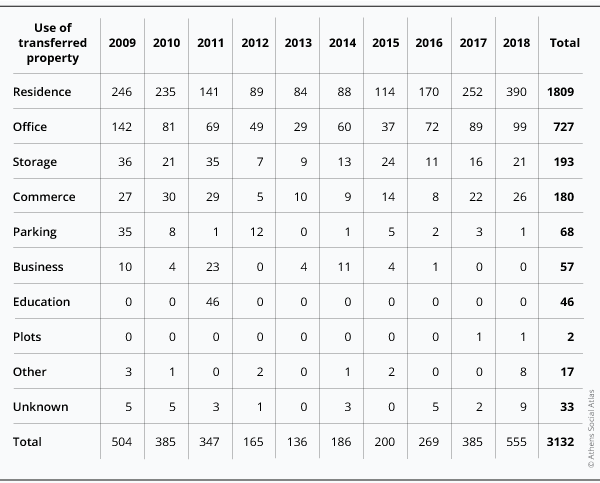
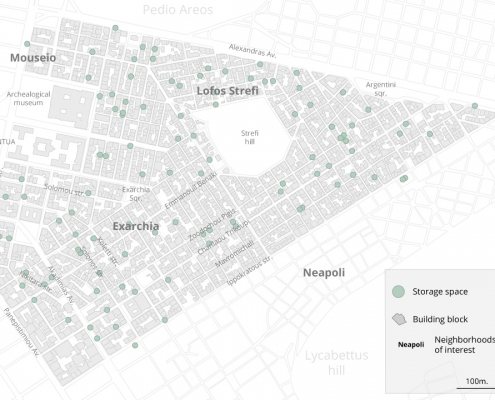
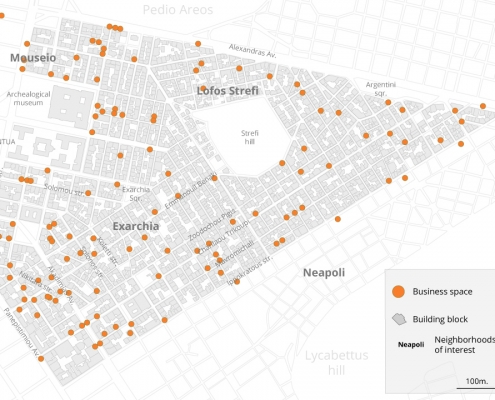
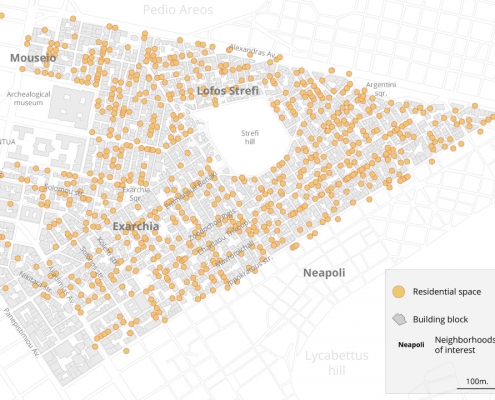
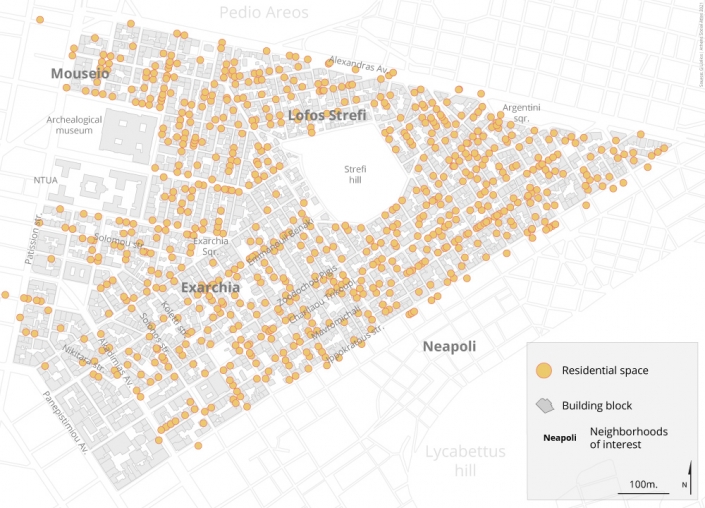
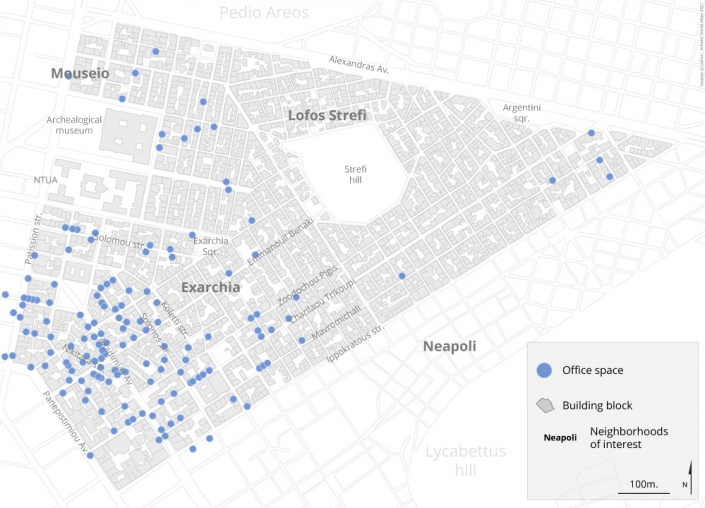
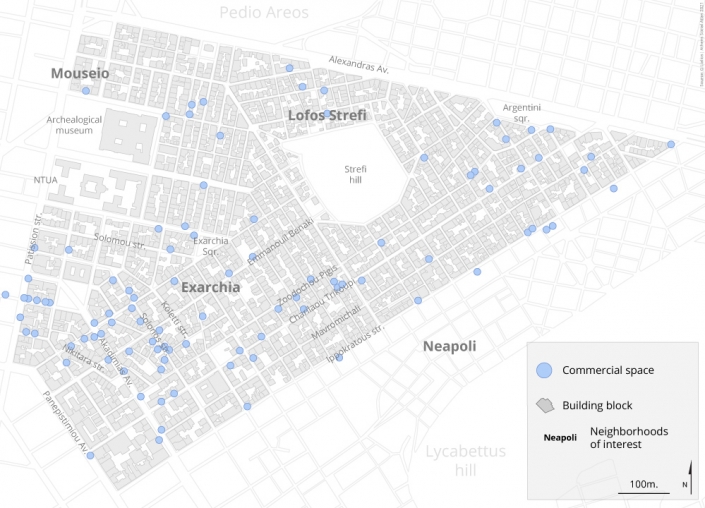
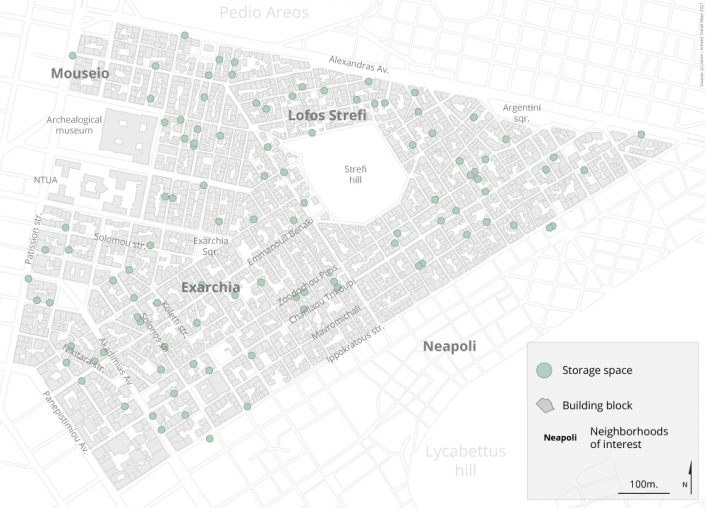
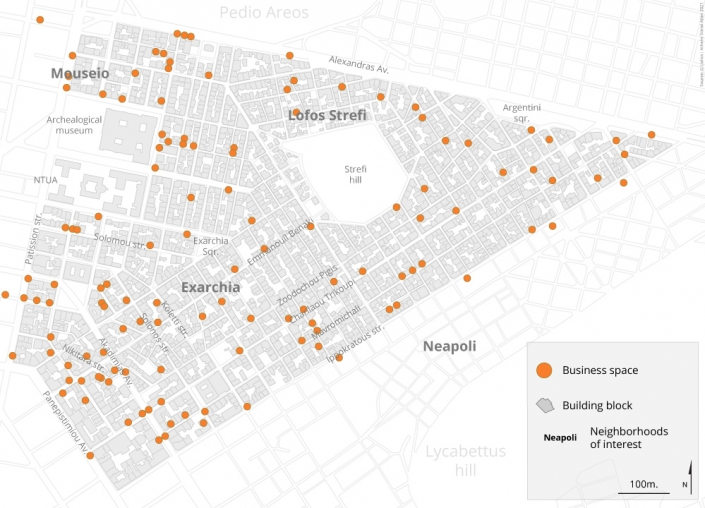
Only half of the cases examined (1.809 of 3.132, 57,9%) concerned residential apartments. Another 727 transactions concerned office spaces (23,2% of total), 193 storage spaces in apartment buildings (6,1%), 180 commercial spaces (5,7% of total), 68 parking spots (2,1% of total), 57 listed as other business spaces, 46 listed as spaces hosting educational activities . As the findings show, the market interest on residential real estate in the studied area boomed already in 2017 (+48,2%, compared to 2016) and 2018 (+35,3%, compared to 2017). While in 2017 the sales of residential real estate exceeded those in 2009.
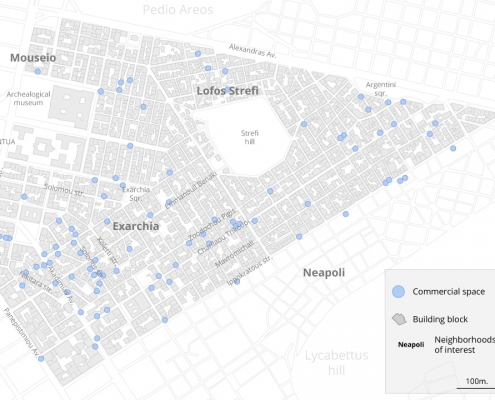
On the contrary, transactions of office spaces, that represent the second largest category of properties sold during the crisis decade, remained even in 2017 and 2018 and at lower levels compared to the ones in 2009. The small number of sales of commercial spaces echoes/reflects the general economic recession, considering also the large number of shut down shops and businesses during the same period in the center of Athens and Exarcheia in particular (table 1, maps 4-8).
Table 1: Use of transferred property 2009-2018
Maps 4-8: Location of transferred properties 2009-2018. Most common usage categories
Property size
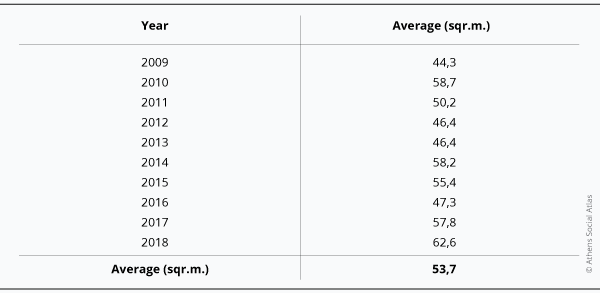
During the examined decade, sold properties in the study area reached at total of 90.000 m2. The average property size was 53,67 m2. The yearly distribution of the mean property size shows almost no size variation- which is linked to the lack of larger properties in the area and reflects its (middle class or student) residential character (table 2).
Table 2: Average transferred property surface per year
Ownership
As the analysis revealed most cases (table 3) concerned purchases of the full property. Out of the 3.132 transactions, 2.158 (68,9%) concerned full-property rights (100%) over one asset. Also, 691 cases (22%) concerned the sale of the 50% of a property- usually those properties were bought by two (individual) buyers. As a result, the 90,9% of all transactions concerned purchases of the 50% or the 100% of a property.
Table 3: Purchase of property rights per percentage of ownership
The rest of the cases concerned co-ownership and involved various ownership percentages, starting even from 1% (obviously in those cases the property was bought together with other people or companies). There have also been cases that concerned the sale only of a percentage of the property. In these cases, the most probable scenario is that that someone’s share in a property was bought off by the other owners of the same property.
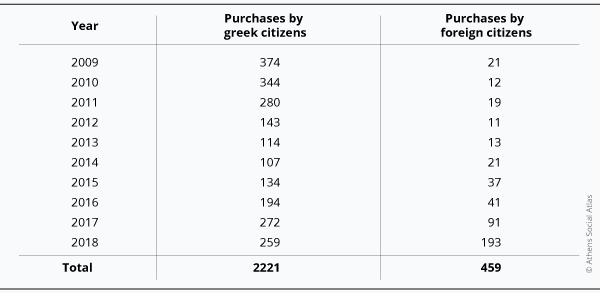
Concerning the buyers’ background, during 2009-2018 3.132 property rights were bought by 2.121 different buyers (either people or legal entities). Out of those, 2.680 were bought by 1.994 people:
-1.658 Greeks bought 2.221 property rights (70,9% of total)
-336 foreigners bought 459 property rights (14,6% of total).
The remaining 452 property transactions involved 127 legal entities (14,5% of total).
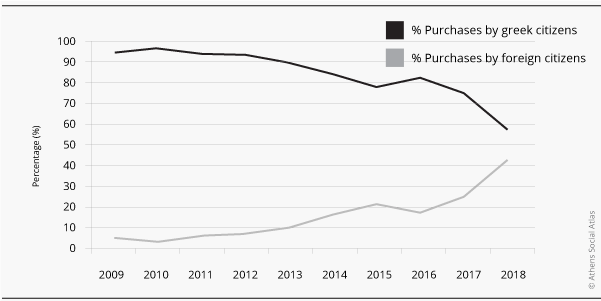
As it turns out (table 4, graph 2), Greeks have dominated property sales in the area during the whole decade, reaching the lowest point in 2014 and returning to the levels of 2011 by 2018.
Table 4: Number of property purchases by Greek and foreign citizens per year (natural persons)
Foreigners were accounted for a very small part of the transactions during 2009-2013 (for example, 2009: 5,2% of all transactions by people). From 2014 onwards, their participation in the local real estate market started growing. In 2014 16,4% of assets were purchased by foreign nationals with this percentage reaching 21,3% in 2015, 17,2% in 2016 and 24,9% in 2017. Suddenly, in 2018 this group accounted for 42,5% of all transactions between individuals (not legal entities) and the 42% of all sales to foreigners during the decade.
Graph 2: Percentage of property purchases by Greek and foreign citizens (natural persons)
The property purchases by legal entities (graph 1) accounted only for the 21,6% of the total sales of 2009. Their involvement in the local market continued to fall during the first half of the 2010s, and hit a low point at 2013 (6,6%), a decline that is in line with the broader situation in the local real estate market at that time. In 2014, the participation of legal entities in real estate transactions rose to 31,3% of the total, to sharply fall to 14,5% in 2015 (year of government change). The decline continued for both subsequent years (12,6% in 2016, 5,7% at 2017) to rise up to 18,5% in 2018.
Legal entities
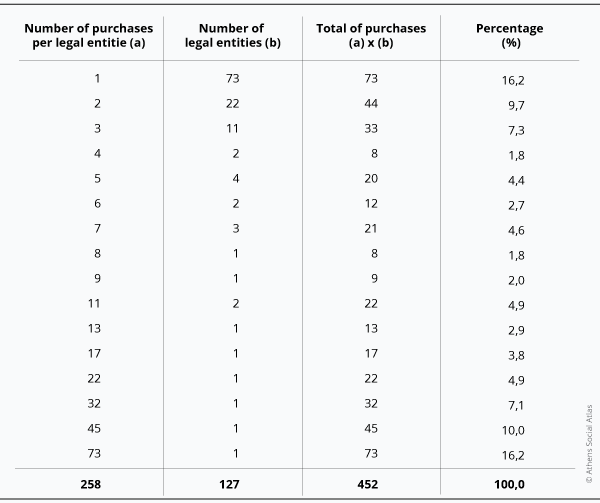
During the examined period a total of 127 legal entities bought 452 property rights in the area. Most legal entities bought just one property (73 out of 127). Two properties were bought by 22 legal entities (9,73% of the total sales by legal entities), and three properties by 11 legal entities (7,3% of total). As a result, 33,18% of all property sales that involved legal entities concerned owners buying 1-3 properties (table 9).
Table 5: Number of property purchases by legal entities per year
On the contrary, there were 8 legal entities that bought a large number of properties (over 10). Those 8 companies bought almost half (49,55%) of all property rights that bought by legal entities during the crisis decade. Interestingly, the 73 sales conducted just by one company account for the 16,67% of all property sales by legal entities during the crisis decade.
Regarding the ownership percentage bought, 407 of legal entities (90% of total) acquired a whole property, and the rest smaller percentages. In one case, a company acquired 15% of 31 properties in the same building.
Concerning the type of legal entities involved, most of them (33) were As for their business sector, most of them were investment, real estate and leasing companies.
However, not all legal entities were companies. Among those recorded were social security funds, (business) chambers, associations, organizations or the church. Most of those actors bought only one property.
As for their locational preferences, one third of the properties bought were located in Akadimias str. Also, a number of properties were located in Koletti, Ippokratous and Zoodochou Pigis streets.
Natural persons
As the findings show out of the 3.132 transactions of property rights 2.221 were made by 1.658 Greeks and 459 from 336 foreigners. An interesting observation in the statistics per year (table 13) is that transactions by foreigners were limited in the beginning of the economic crisis (for example, 5,2% of all sales by natural persons in 2009, 3,3% in 2010). However, foreigners increase gradually their participation in the local market, to account in 2018 for half of all transactions by natural persons (Greeks and foreigners) – 21,3% in 2015, 17,2% in 2016, 24,9% in 2017 and, suddenly, 42,5% in 2018.
This finding clearly points at the dramatic weakening of the locals’ purchasing power, and the growing number of foreigners (and companies as well) looking for deals in a promising real estate market and purchasing properties in Exarcheia.
Table 6: Number of property purchases by natural persons per year
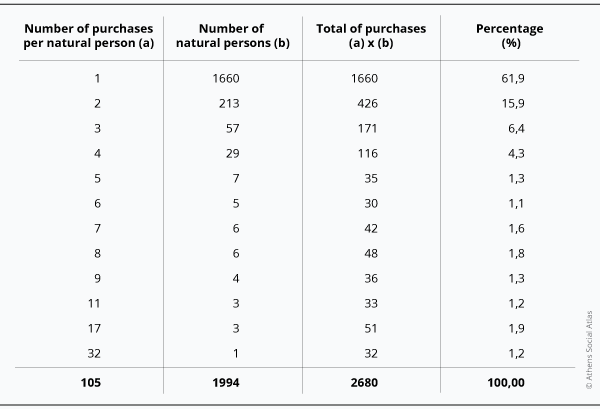
Another interesting finding is that there was no property consentration, as most natural persons (61,6%) bought only one property (a total of 1.660 property rights). Only 1,3% bought 5 property rights (table 6).
Nationalities
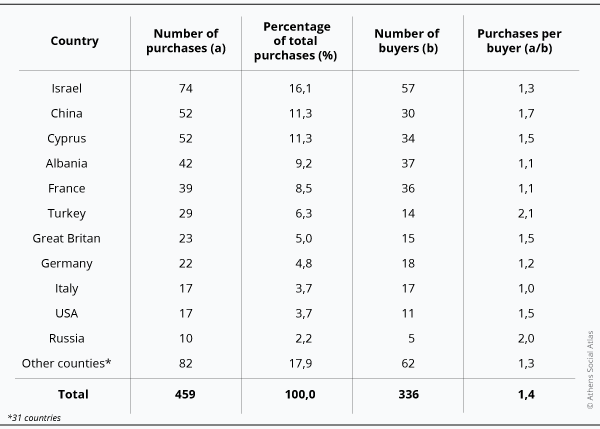
During 2009-2018, people from 42 countries bought properties in Exarcheia (table 7). In the Land Registry database foreigners were recorded as non-Greeks – the place of permanent residence was not examined as in todays globalized environment it does not have a decisive force. In this context, people with Greek names, that are citizens of other countries (Greek diaspora) were categorized as foreigners.
Table 7: Number of property purchases by foreign citizens and number of buyers by nationality (2009-2018)
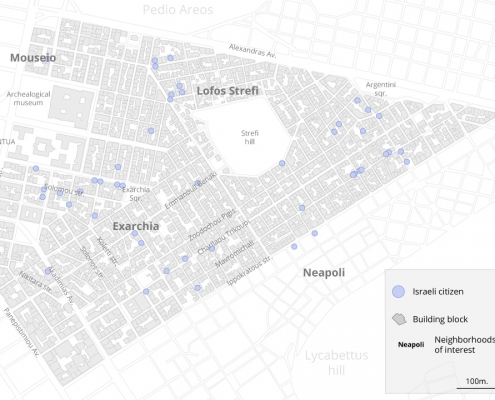
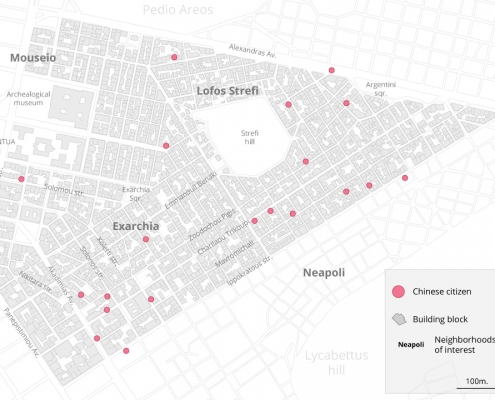
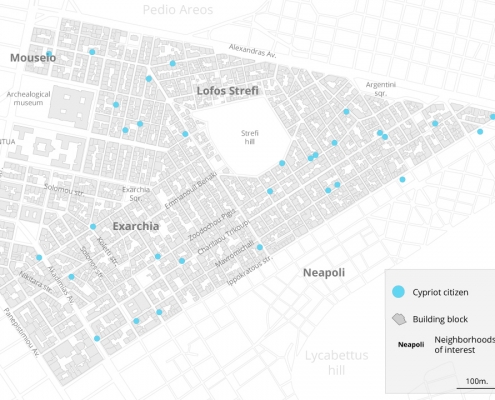
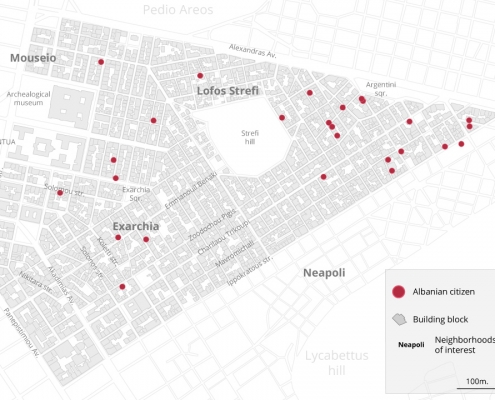
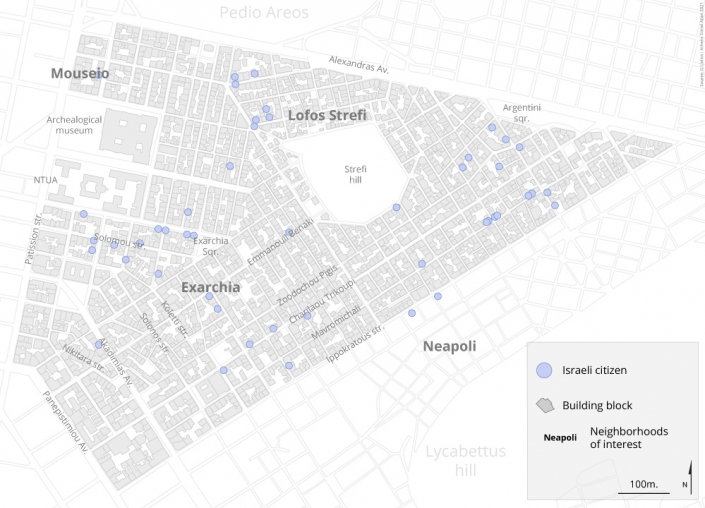
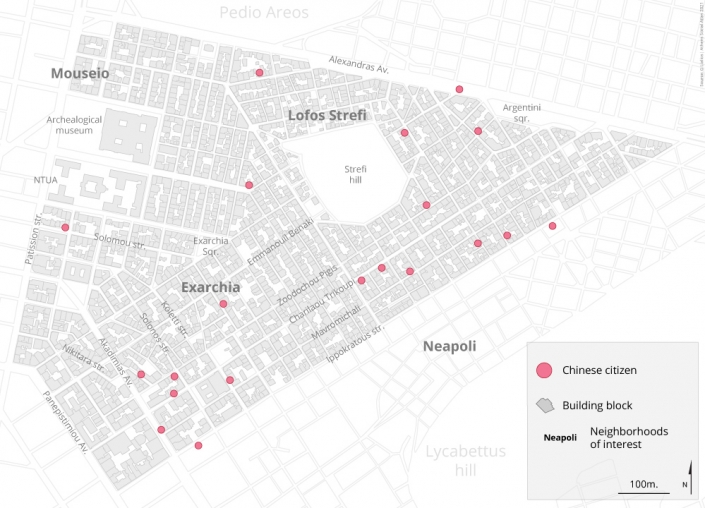
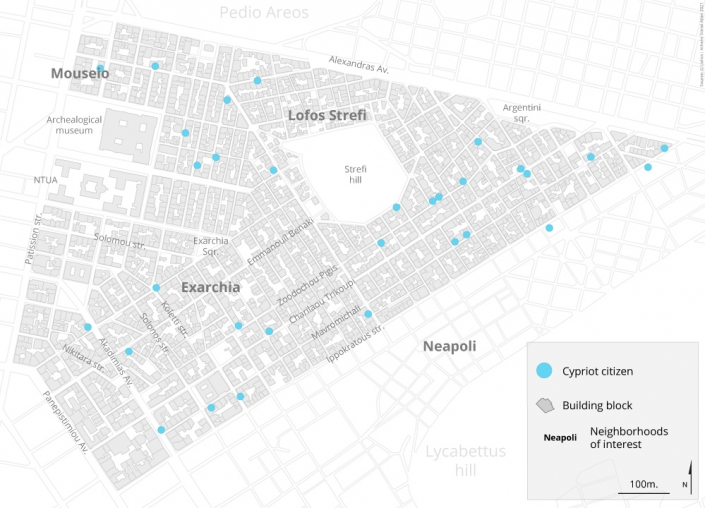
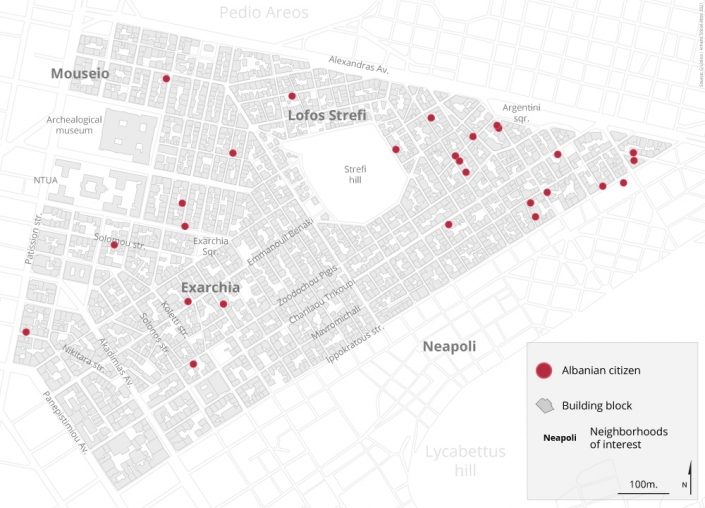
The analysis of the sale contracts based on the nationality of the new buyers (table 7) confirms the general belief that Israeli (at a larger extent) and Chinese (at a lesser extent) were among the nationality groups involved in an important number of transactions . The second largest nationality group (after the Israelis) was unexpected: Albanians. A number of buyers were also from France and Cyprus. In general, half the foreign buyers were nationals of four main countries (Israel, Albania, France, Cyprus).
Maps 9-12: Location of sales and purchases per buyer nationality
As for the number of properties acquired by non-Greek nationals (table 6), Israelis remain at the top of the list, with 74 properties in the broader Exarcheia area (16,2% of all sales by foreigners). Chinese nationals are in second place, with 52 properties, together with Cypriots. Albanians are in fourth place, with 42 properties, followed by the French (39 properties) and Turks (29 properties). Generally speaking/In general, about half of all properties (47,9%) bought by foreigners, were bought by people from 4 countries (Israel, Cyprus, China and Albania).
Conclusions
The analysis of all sale contracts concluded during the economic crisis and for assets in Exarcheia reveals that a large number of the properties bought, especially after 2015 moved form long term to short term rentals. This conclusion emerges indirectly (from the rising number of Airbnb listings and reports on long term rentals rise up to 30-35% in 2018) but also directly from the findings of this research. As this study shows purchases concern also whole buildings which have been transformed into hotels. Additionally, new buyers concerned often individuals or companies involved in the hospitality sector. The statues of companies buying properties in Exacheia clearly stated that their purpose is managing and short-term renting properties.
The image of decadence associated with Exarcheia during the economic crisis in the public debate seems to have helped, if not fostered, real estate speculation. The consecutive clashes with police forces, the destruction of public and private property and drug dealing, have all supported this image and surely discouraged new residents form moving in Exarcheia. At the same time, those events had a negative effect on the permanent residents, with some of them moving away, as a consequence of the area’s degradation and criminality. The price decline, centrality and the youthful, revolutionary, and alternative character of this particular area (promoted as being part of a “travelling experience” recently), have initially encouraged sales in Exarcheia. However, it remains unknown to what extent the promoted negative image of Exarcheia (the portrayal of Exarcheia as a no-go zone, where anarchy and drugs rule), has been entwined with other political or economic motives aimed at first pushing down property prices and subsequently “normalize” the area through real estate development. This question may be easy to assume but difficult to prove. Undoubtedly, the real estate capital looks forward to this “normalization” by investing in properties and short-term rentals, as long as this does not change this areas’ “branded” character. In any case, it is very interesting that an area portrayed in the public debate as a no-go zone is directly targeted by local and foreign capital, to the extent that shows signs of gentrification.
[1] Main photo: Avgi newspaper, Μπλε Πολυκατοικία: η ιστορία και ο μύθος της, 11/12/2013
Entry citation
Lialios, G. (2021) Property transformations in the centre of Athens during the economic crisis years (2009-2018). The case of Exarcheia, in Maloutas T., Spyrellis S. (eds) Athens Social Atlas. Digital compendium of texts and visual material. URL: https://www.athenssocialatlas.gr/en/article/property-transformations-in-exarcheia/ , DOI: 10.17902/20971.103
Atlas citation
Maloutas T., Spyrellis S. (eds) (2015) Athens Social Atlas. Digital compendium of texts and visual material. URL: https://www.athenssocialatlas.gr/en/ , DOI: 10.17902/20971.9
References
About the financial crisis and its consequences on the real estate market and housing
- Μονοκρούσος Π (2014) ξελίξεις στην αγορά κατοικίας στην Ελλάδα – Οικονομετρική μελέτη για τους ερμηνευτικούς παράγοντες και την εξέλιξη των τιμών στην εγχώρια αγορά κατοικίας. Αθήνα: Eurobank Greece Macro Monitor.
- Μπελαβίλας Ν και Πρέντου Π (2005) Τα εγκαταλελειμμένα κτίρια και τα ξενοίκιαστα εμπορικά καταστήματα: Το χωρικό σχήμα της κρίσης. Στο: Κοινωνικός άτλαντας της Αθήνας. Ηλεκτρονική συλλογή κειμένων και εποπτικού υλικού, Αθήνα.
- Σαμπανιώτης Θ και Χαρδούβελης Γ (2012) Η ελληνική αγορά ακινήτων στα χρόνια της κρίσης. Στο: Η αγορά ακινήτων στην πρόσφατη χρηματο-οικονομική κρίση, Αθήνα: Τράπεζα της Ελλάδος.
- Ρεβύθης Ι (2017) Εξελίξεις στην Ελληνική αγορά Ακινήτων. Οικονομικά Χρονικά 159.
- Kapopoulos P, Rizos A and Zekente K-M (2020) Alpha Bank Economic Research. Athens.
About the Airbnb and the golden visa
- Μπαλαμπανίδης Δ, Παπατζανή Ε και Πέττας Δ (2021) Το Airbnb στην πόλη. Ευκαιρία ή απειλή; Αθήνα: Εκδόσεις Πόλις.
- Κουκουμάκας Κ (2019) Οι Κινέζοι σπάνε κάθε ρεκόρ στο πρόγραμμα της Golden Visa. Vice. Available from: https://www.vice.com/el/article/wjwwm5/oi-kinezoi-spane-ka8e-rekor-sto-ellhniko-programma-ths-golden-visa (ημερομηνία πρόσβασης 11 Δεκεμβρίου 2019).
- Alexandri G (2018) Planning Gentrification and the “absent” state in Athens. International Journal of Urban and Regional Research 42.
- Thornton G (2019) Οικονομία διαμοιρασμού: Κοινωνικές επιπτώσεις και ρυθμιστικές παρεμβάσεις. Grant Thornton. Available from: https://www.grant-thornton.gr/press-releases/2019/sharing-economy-2019/.
About the Exarcheia neighbourhood
- Αθηνάκης Δ (2017) Εξάρχεια: Να ζει κανείς ή να μη ζει; Περιοδικό «Κ» Καθημερινής. Available from: https://www.kathimerini.gr/k/k-magazine/939704/exarcheia-na-zei-kaneis-i-na-mi-zei/ (ημερομηνία πρόσβασης 18 Δεκέμβριος 2017).
- Βατόπουλος Ν (2015) Η ατμόσφαιρα των γκέτο απλώνεται στην Αθήνα. Η Καθημερινή. Available from: https://www.kathimerini.gr/life/city/837713/i-atmosfaira-ton-gketo-aplonetai-stin-athina/ (ημερομηνία πρόσβασης 7 Νοεμβρίου 2015).
- Δασκαλοπούλου Ν (2018) Ξεναγοί στο τελευταίο «γαλατικό χωριό των αναρχικών στον κόσμο. Εφημερίδα των Συντακτών. Available from: https://www.efsyn.gr/ellada/koinonia/152401_xenagoi-sto-teleytaio-horio-ton-anarhikon-ston-kosmo (ημερομηνία πρόσβασης 2 Ιουνίου 2018).
- Τζιαντζή Α (2016) Θα εξαφανίσωμεν τα Εξάρχεια. Εφημερίδα των Συντακτών. Available from: https://www.efsyn.gr/ellada/koinonia/82149_tha-exafanisomen-ta-exarheia (ημερομηνία πρόσβασης 12 Σεπτεμβρίου 2016).
- Η Καθημερινή (2018) Επιστολή διαμαρτυρίας κατοίκων των Εξαρχείων στον Εισαγγελέα για την εγκληματικότητα στην περιοχή. Available from: https://www.kathimerini.gr/society/962019/epistoli-diamartyrias-katoikon-ton-exarcheion-ston-eisaggelea-gia-tin-egklimatikotita-stin-periochi/ (ημερομηνία πρόσβασης 2 Μαΐου 2018).
- Pettas D, Avdikos V, Iliopoulou E, et al. (2021) “Insurrection is not a spectacle”: experiencing and contesting touristification in Exarcheia, Athens. Urban Geography, Taylor & Francis: 1–23.
- Cappuccini M (2015) Urban space and social networks in times of crisis. A local perspective from the Exarchia neighbourhood of Athens. Greek Review of Social Research 144: 129–134.
- Vradis A (2020) Spatial politics and the spatial contract in Exarcheia, Athens, Greece (1974–2018). Transactions of the Institute of British Geographers, Wiley Online Library 45(3): 542–558.

