The study of urban sprawl through historical maps - The case of Petroupolis
Chalkias Christos|Kalogeropoulos Kleomenis|Tsatsaris Andreas
Built Environment, Infrastructures, Quartiers
2018 | Feb
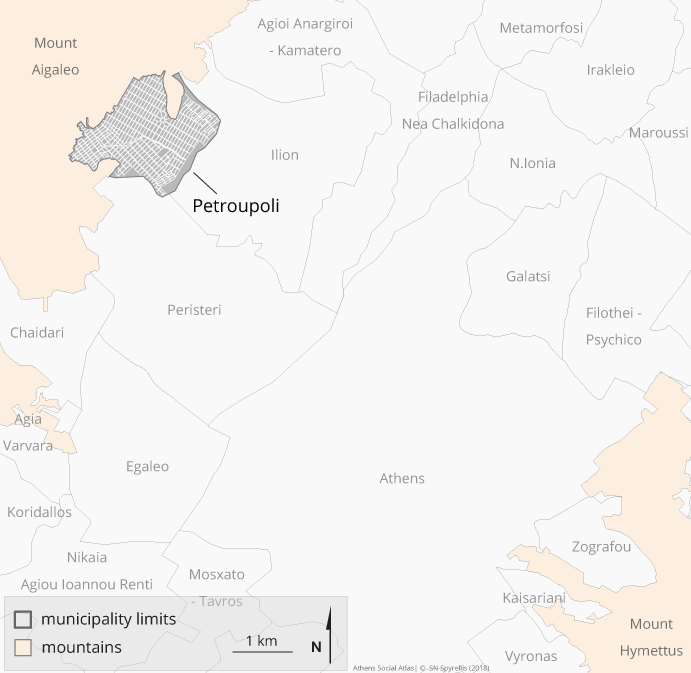
Recent urban spatial changes can be explored at many levels and in addition to their social, environmental, economic and political dimensions. The present paper is an original investigation of urban sprawl examining the process at the individual building level. Each building is recorded by the census and displayed at the block level. The suburb of Petroupolis (Map 1) was selected as a case study area, being a typical example of dynamic development of the urban tissue in the Athenian metropolis after the interwar period. The study is based on historical maps used in six different National Population Censuses (1961-2011) conducted by the Hellenic Statistical Authority (ELSTAT). These maps were properly processed and documented, using Geographical Information Systems (GIS) techniques, leading eventually to mapping urban sprawl in Petroupolis during that period.
Map 1: Municipality of Petroupoli
The same methodology can be used to study and map changes in the urban fabric of urban agglomerations and other settlements all over Greece, based on the historical archive of ELSTAT which includes analogue maps that were used to organise National Population Censuses since 1961.
Introduction
The last century was characterized by anthropogenic interventions in the environment, mainly in America and Europe (Antrop 2000, Jaeger et al., 2010). Among the most significant of them is urban sprawl. This phenomenon is widely known under the English term “urban sprawl”, which in Greek is commonly referred to as “urban diffusion” (Γεμενετζή 2011; Γερόλυμπου & Παπαμίχος, 2001; Κουρσάρη, 2008; Λαγαριάς, 2013).
Modern urban spatial changes are a multi-level phenomenon combining the geographical (spatial) with the social, environmental, economic and political dimensions (Λαγαριάς, 2013). Many cities across the globe -especially in the United States- have been developed in the model of dispersed sprawl rather than on the traditional European model of the compact city (Schneider & Woodcock, 2008). The mobility of inhabitants -both social and spatial- contributes to the continuous transformation of the urban landscape (Κανδύλης, 2008). In Greece, mobility during the first three decades after WWII, was mainly linked to internal migration. This mobility was primarily spatial, but led also to an important and long wave of social mobility (Μαλούτας, 2008).
In large parts of Southern Europe, the social and spatial mobility led at some point to urban sprawl. The whole process was fuelled by (a) the intensity of urbanization, especially after the war, (b) the self-promoted housing at the outskirts of cities, mainly by lower social strata, as well as (c) the lack of planning and control mechanisms. In more recent decades, when urbanization slowed down and self-promotion by lower social groups almost disappeared, urban expansion was maily due to the production of second homes, to the effect of strong economic growth on the tendency of the middle strata to relocate in the suburbs and to large infrastructure projects (Καυκαλάς κ.ά., 2015).
This entry deals with urban sprawl within the Municipality of Petroupolis, aggregating the moves of its former and new inhabitants throughout the considered period. The maps created by the Hellenic Statistical Authority (ELSTAT) and related to each National Population Census (NPC) from 1961 to 2011 were properly processed, using Geographical Information Systems (GIS) techniques, and documented, leading eventually to portraying the spatiotemporal expansion of the urban tissue.
Data
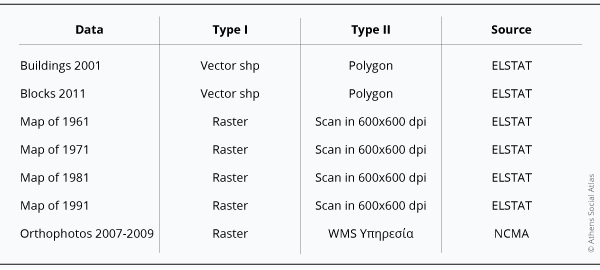
The main data produced by ELSTAT and used in this work are:
- Historical cartographic maps (1961, 1971, 1981 and 1991) – raster data following the scanning of printed material.
- Shape file of the building stock of the 2001 NPC and shape file of the city blocks of the NPC 2011 – vector data.
- Modern orthophotographs (orthophotographs 2007-2009 produced by the National Cadastre & Mapping Agency SA – NCMA).
The following table shows the data used in this work (Table 1).
Table 1: Data of the methodology
Methodology
The proposed methodology, concerning the use of historical cartographic documents in order to study the sprawl of urban settlements in Greek agglomerations, follows the basic workflow steps usually comprised in the Information System analysis process. These are (a) preparing, (b) processing and (c) analyzing the data. In this application, we used the ArcGIS 10.3 Geographic Information System.
Data preparation consists of a series of procedures, in order to get processable digital form, proper spatial reference and metric value.
For acquiring a digital identity, the 1961, 1971, 1981, 1991 maps were scanned in A0 size and 600 dpi in order to get a digital image of high resolution which, at the same time, does not produce an excessively heavy digital mosaic of archive files to be managed by the system.
In order to overlay correctly and process the scanned maps in successive locations, all of them must have a common spatial reference. It is therefore necessary to match the georeference system of the scanned historical maps with a selected reference map, for which a digital cartographic background is already registered. The shapefile of the 2011 Block was selected as the most appropriate reference map, based on the fact that it is referenced on the most widely used system in the country (Greek Geodetic Reference System 87 – EGSA 87) and, also, is the most recent.
After geo-referencing, the historical maps acquired correct orientation and scale and therefore their valid co-processing (e.g. through common positions and places, measurements, etc.) was enabled.
Data processing includes a sequence of tasks regarding how they are processed. Starting with the Buildings shapefile of 2001, an updated copy of the same file was made. Using the 2007-2009 orthophotos, and with the help of a Web Mapping Service WMS by NCMA within ArcGIS, an update was made (in the building stock of the 2001). This update captures the building stock of the NPC 2011 (the orthophotos of 2007-2009 being the closest in time to 2011). This update includes both the desappearence of a number of buildings or/and the creation of new ones.
An archive (shape file) of the building stock of 2001 is then created. This archive is based on the 1991 NPC map and mainly comprises the building stock of the 1991 NPC. The procedure in this case consists mainly of the deletion of buildings within the respective decade.
The next step is to create a new copy of the 1991 building stock (the file that was built earlier). This file, after a similar processing using as a background the 1981 NPC map, leads to the building stock of the 1981 NPC. The same procedure is repeated until the NPC of the 1961 building stock is created.
The third step is to analyze the data in order to estimate the urban sprawl over time from the Census of 1961 to the Census of 2011. At this stage, all the necessary procedures are carried out in order to portray the sprawl at the individual building scale.
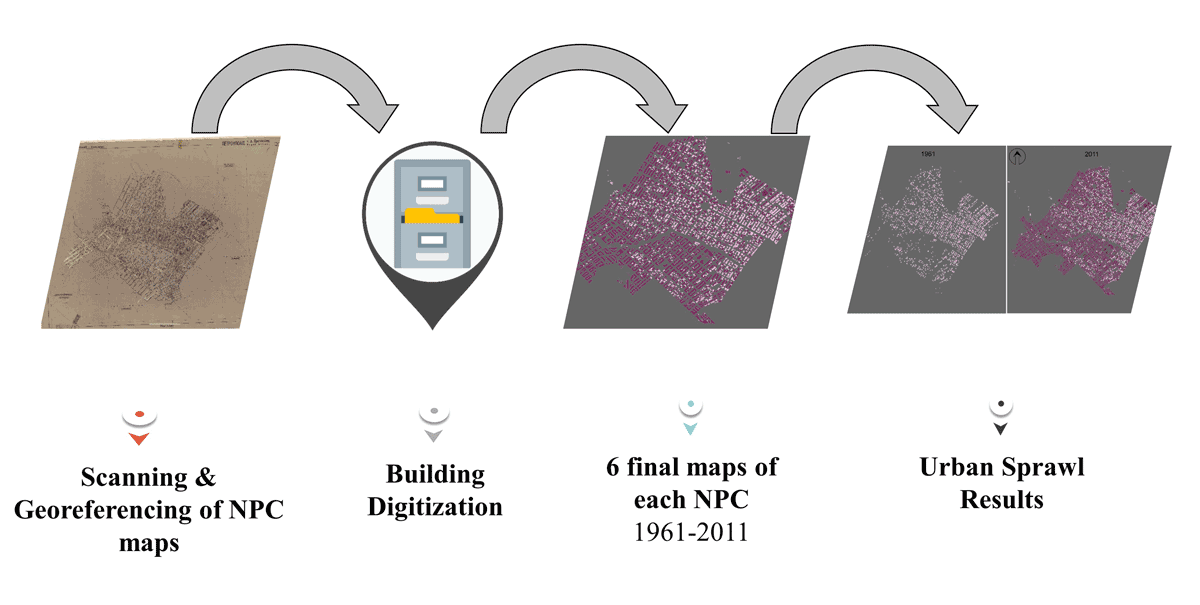
The following figure briefly shows the method folloed in this paper (Figure 1).
Figure 1: Stages of the method
Results
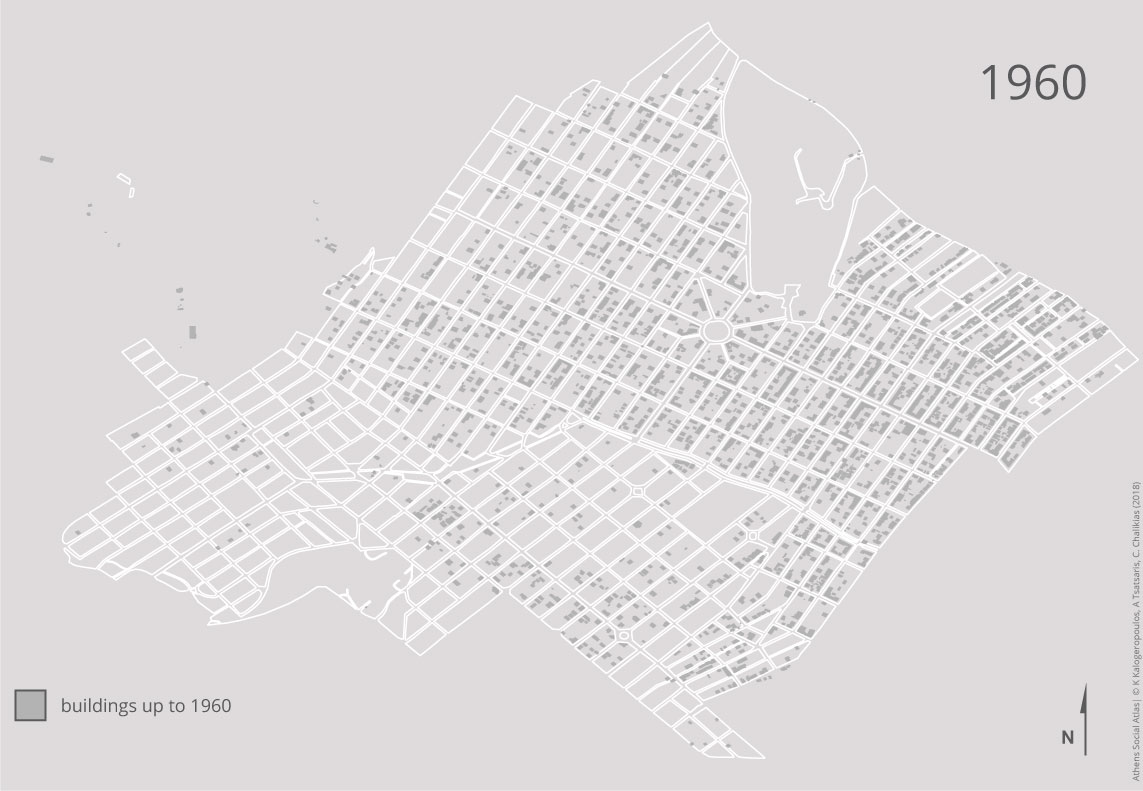
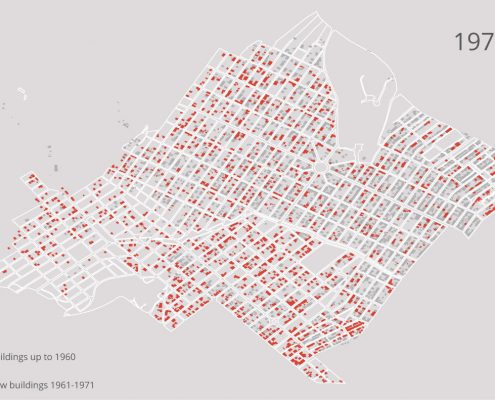
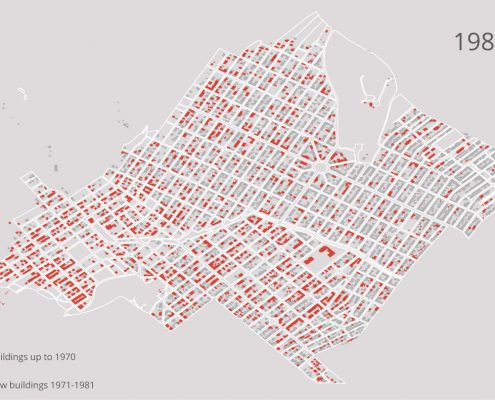
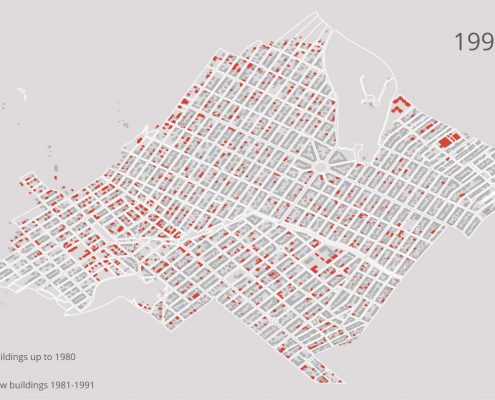
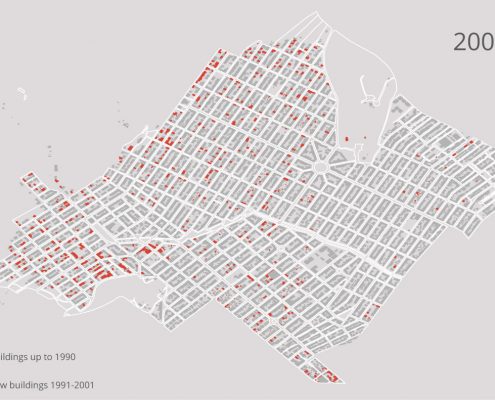
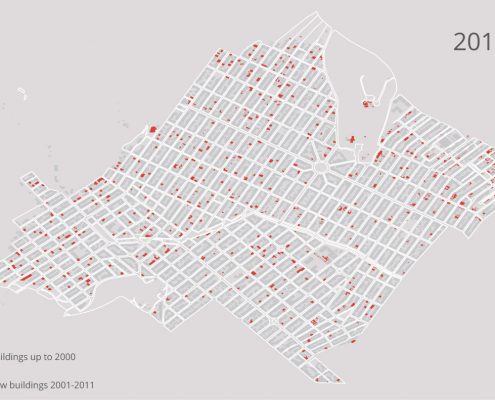
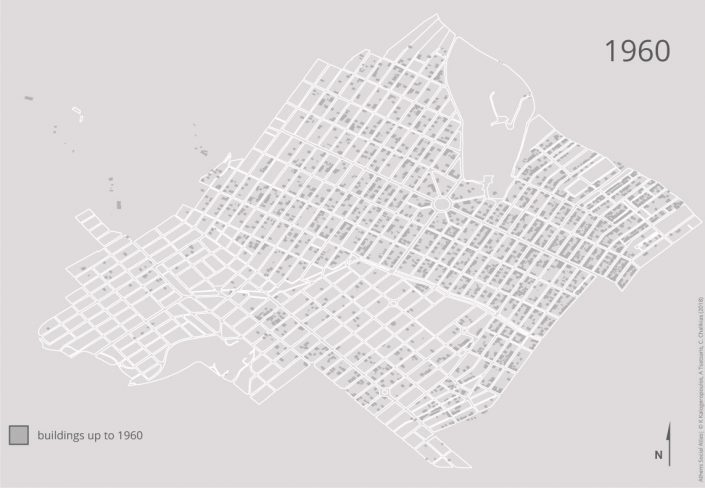
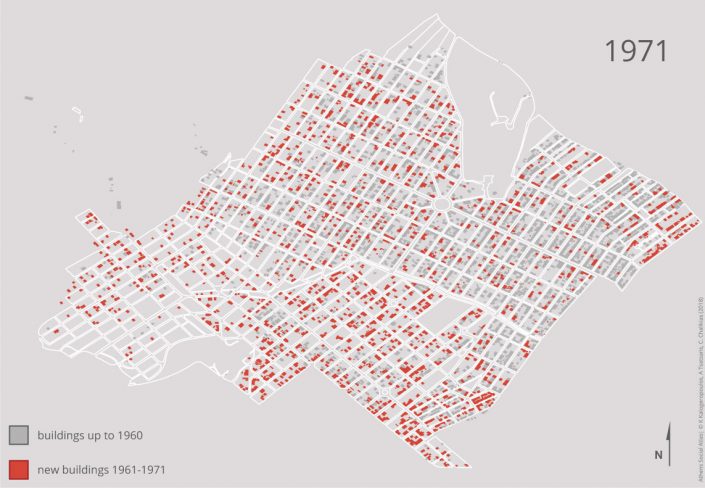
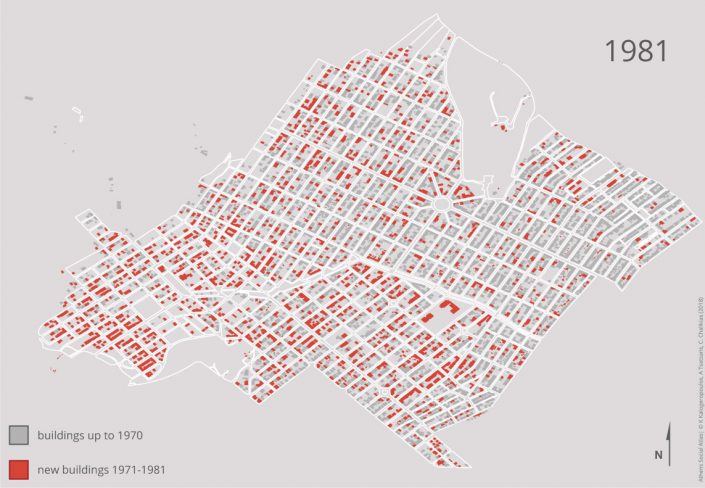
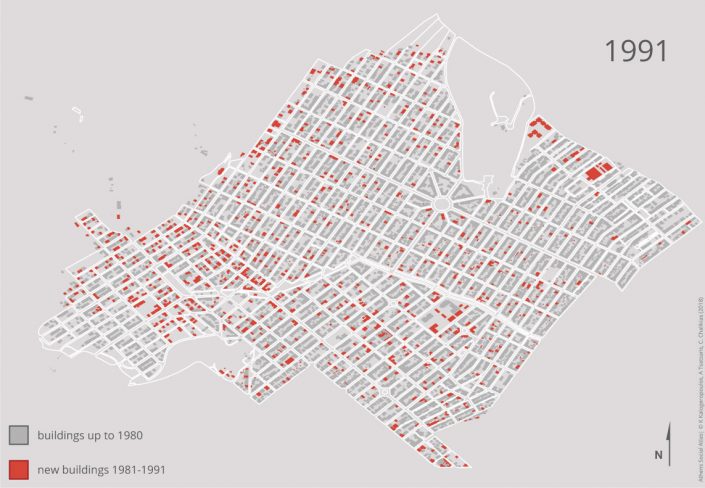
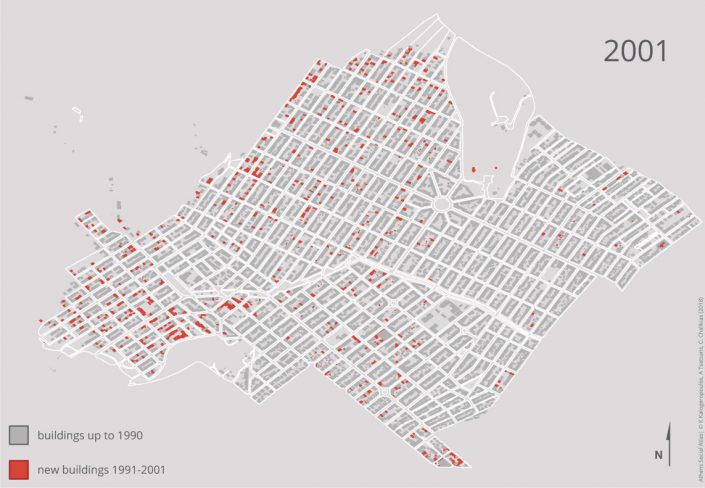
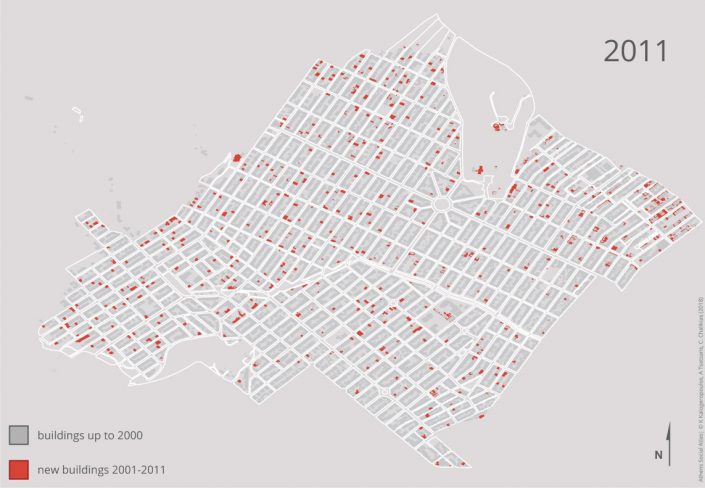
This study examined the sprawl within the Municipality of Petroupolis from 1961 to 2011. The process already described resulted in a total of six maps (one for each NPC), in which the building stock is documented and depicted for each NPC (Maps 2-7).
Maps 2-7: The sprawl of the urban tissue in the Municipality of Petroupolis from 1961 to 2011
New buildings produced after the previous NPC are depicted in red in each map and indicate the extent, the location and the form of the sprawl of the urban fabric during the decade before each NPC.
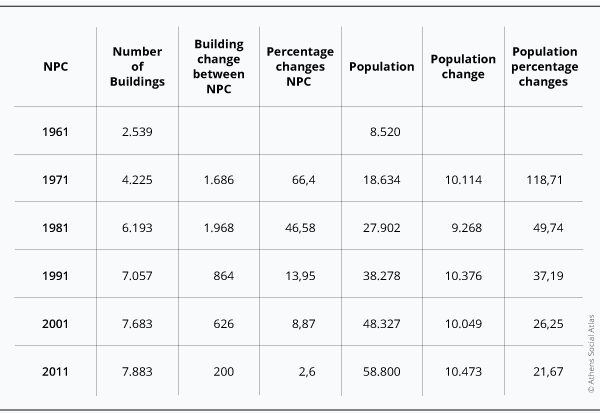
The municipality gradually developed towards the North – Northwest, extending reaching the foothills of Mount Pikilo. The quantitative documentation of the above-mentioned maps, regarding the building stock, show a rapid increase of built space in the study area, during 1961-2011. This is certainly related to the population increase during the same period (Table 2) since the majority of buildings are residential:
Table 2. Quantitative documentation of sprawl and population growth in Petroupolis, 1961-2011
Source: ELSTAT
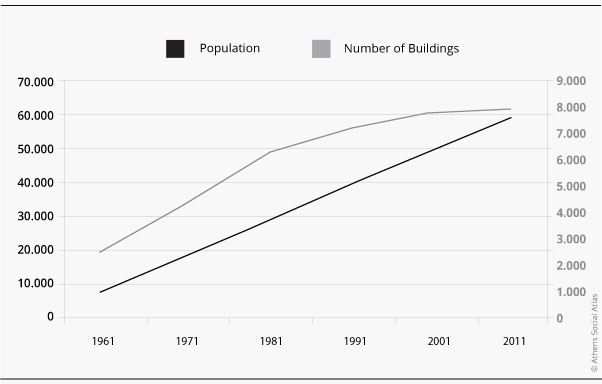
The highest increase in population and building numbers in the study area was observed between the 1961 and 1971. During that period, a residential core was created in Petroupolis, with a high concentration of population and consequently building infrastructure. Both the building stock and population gradually increased every decade. However, their growth progressively decreased. However, up to the last census there is a rising trend in both characteristics (Figure 2).
Figure 2. Number of buildings and population in Petroupolis, Attica, during the period 1961-2011
Source: ELSTAT
Conclusions
In this work, historical cartographic data were processed and analyzed, aiming at facilitating the grasp and interpretation of socio-economic phenomena. Similar background data exist in almost all government agencies that produce cartographic maps, but remain most of the time untapped.
By applying the proposed method–the analysis of ELSTAT’s historical maps- we introduced a particular concept and procedure to implement such approaches, while by using a relatively small part of the urban tissue of the Athenian metropolis, we believe to have proved the usefulness of the method.
The importance and innovation of this method, compared to others (for example satellite imagery or aerial photography), is that urban sprawl is examined on the individual building scale within each block, since all buildings in each block were recorded in each NPC.
Eventually, this method can be used to study and map the changes of the urban tissue in a variety of settlements in Greece, using the historical archive of ELSTAT, which comprises analogue and digital (after 2000) maps produced to organize NPCs since 1961.
Entry citation
Chalkias, C., Kalogeropoulos, K., Tsatsaris, A. (2018) The study of urban sprawl through historical maps – The case of Petroupolis, in Maloutas T., Spyrellis S. (eds) Athens Social Atlas. Digital compendium of texts and visual material. URL: https://www.athenssocialatlas.gr/en/article/urban-sprawl-in-petroupolis/ , DOI: 10.17902/20971.81
Atlas citation
Maloutas T., Spyrellis S. (eds) (2015) Athens Social Atlas. Digital compendium of texts and visual material. URL: https://www.athenssocialatlas.gr/en/ , DOI: 10.17902/20971.9
References
- Γεμενετζή Γ (2011) Αστική διάχυση και οικιστικό δίκτυο, έννοιες και εργαλεία ανάλυσης με εφαρμογή στην περιοχή επιρροής της Θεσσαλονίκης. ΑΠΘ.
- Κανδύλης Γ (2008) Μετακινήσεις για εργασία, μετανάστευση και διαδικασίες αναπροσδιορισμού της λειτουργικής περιφέρειας της Αθήνας. Στο: Εμμανουήλ Δ, Ζακοπούλου Έ, Καυταντζόγλου Ρ, κ.ά. (επιμ.), Κοινωνικοί και Χωρικοί Μετασχηματισμοί στην Αθήνα του 21ου Αιώνα, Αθήνα: Εθνικό Κέντρο Κοινωνικών Ερευνών.
- Καραδήμου-Γερόλυμπου Α και Παπαμίχος Ν (2001) Θεσσαλονίκη: από την μονοκεντρική πόλη στη διάχυτη αστική ανάπτυξη. Προσεγγίσεις του φαινομένου με αφορμή το βιβλίο του Γρ. Καυκαλά, Θεσσαλονίκη, μείωση της μονοκεντρικότητας στο πολεοδομικό συγκρότημα και ο ρόλος του τριτογενούς τομέα. Βιβλιοκρισίες, Αθήνα.
- Καυκαλάς Γ, Βιτοπούλου Α, Γεμενετζή Γ, κ.ά. (2015) Η μεταβαλλομένη γεωγραφία των πόλεων. Στο: Καυκαλάς Γ, Βιτοπούλου Α, Γεμενετζή Γ, κ.ά. (επιμ.), Βιώσιμες πόλεις, Αθήνα: Σύνδεσμος Ελληνικών Ακαδημαϊκών Βιβλιοθηκών, σ 51.
- Κουρσάρη Ε (2008) Αθήνα και αστική διάχυση, Νέες διαρθρώσεις του περιαστικού χώρου και αναδυόμενες γεωγραφίες της πόλης. ΕΜΠ.
- Λαγαριάς Α (2013) Αστική εξάπλωση: Οι διαδικασίες αστικού μετασχηματισμού μέσα από τη μορφοκλασματική (fractal) γεωμετρία και τα μοντέλα προσομοίωσης. ΑΠΘ.
- Μαλούτας Θ (2009) Κοινωνική κινητικότητα και στεγαστικός διαχωρισμός στην Αθήνα: Μορφές διαχωρισμού σε συνθήκες περιορισμένης στεγαστικής κινητικότητας. Στο: Μαλούτας Θ, Εμμανουήλ Δ, Ζακοπούλου Έ, κ.ά. (επιμ.), Κοινωνικοί μετασχηματισμοί και ανισότητες στην Αθήνα του 21ου αιώνα, Αθήνα: ΕΚΚΕ, Μελέτες – Έρευνες ΕΚΚΕ, σσ 28–61. Available from: http://www.ekke.gr/open_books/athens_2008.pdf.
- Antrop M (2000) Changing patterns in the urbanized countryside of Western Europe. Landscape ecology, Springer 15(3): 257–270.
- Jaeger JAG, Bertiller R, Schwick C, et al. (2010) Urban permeation of landscapes and sprawl per capita: New measures of urban sprawl. Ecological Indicators, Elsevier 10(2): 427–441.
- Schneider A and Woodcock CE (2008) Compact, dispersed, fragmented, extensive? A comparison of urban growth in twenty-five global cities using remotely sensed data, pattern metrics and census information. Urban Studies, Sage Publications Sage UK: London, England 45(3): 659–692.

